International Journal of Scientific & Engineering Research, Volume 6, Issue 1, January-2015
ISSN 2229-5518
1669
The Performance analysis of a OFDM signal in PAPR by using
Signal Clipping
1Md. Khalid Hossen
Electronics & Communication Engineering Khulna University, Khulna-9208, Bangladesh ece090913@gmail.com
2Md. Shahriar Uzzal
Electronics & Communication Engineering Khulna University, Khulna-9208, Bangladesh shahriarece09@gmail.com
Abstract— In Orthogonal frequency division multiplexing (OFDM) technique the 3rd and 4th generation network is also introduced. So many advantages are still in a OFDM technique. There are some disadvantages also. Pick to average power ratio (PAPR) is one of the disadvantages in a OFDM. There are two types in which called Signal distortion techniques, Symbol- scrambling techniques In this paper we will discuss about signal
clipping which under signal distortion technique. In signal clipping we will see PAPR performance and BER performance. By changing the threshold level the proper PAPR and BER is observed
Index Terms—BER, OFDM, FDM, PSK, IDFT, QAM, SLM
A. INTRODUCTION
With the rapid growth of digital communication in recent years, the need for high-speed data transmission has increased. New multicarrier modulation techniques such as OFDM (Orthogonal frequency-division multiplexing) are currently being implemented to meet ever increasing demand for more communication capacity [1] [5] [6]. In an OFDM system, a high-rate serial information-bearing Symbol stream is split into many low-rate parallel streams [2]. Wireless communications has many advantages, such as speed, simplicity, mobility and flexibility, but in the same time it suffers from, inter-symbol interference (ISI) and multipath propagation (frequency selective fading). Supporting high data rates channel of the conventional single carrier system required various modulation techniques.
OFDM is the most popular one. The first OFDM scheme was proposed by Chang in 1966[1]. Even though the concept of OFDM has been around for several years, but it has not been recognized as a great method for high speed bi-directional wireless data communication until recent years. (DVB-T) and Asymmetric Digital Subscriber Line (ADSL). These days the OFDM technique is considered as a strong candidate for the fourth generation (4G) of mobile communication systems. OFDM has many advantages: such as, flexibility to the channel conditions without the need of channel equalization, robustness to the fading, and resistance to multipath [1].
On the other hand, OFDM suffers a high Peak to Average Power
Ratio (PAPR). A high PAPR makes the signal peaks move into the non-linear region of the RF power amplifier which causes signal distortion. A large PAPR increases the complexity of the analog-to- digital and digital-to-analog converters and reduces the efficiency of the RF power amplifier. Recently, researchers have discovered many techniques on PAPR reduction, for instances, clipping, peak windowing, tone reservation, tone injection, random phase updating, coding, and selected mapping (SLM) [4].Here we discussed about clipping, peak windowing, selective level mapping. And we have shown about the PAPR and BER performance of the reduction technique.
B. OFDM THEORY:
Orthogonal Frequency Division Multiplexing is a special form of multicarrier modulation which is particularly suited for transmission over a dispersive channel. Here the different carriers are orthogonal to each other, that is, they are totally independent of one another. This is achieved by placing the carrier exactly at the nulls in the modulation spectra of each other. Since the symbols are formed by rectangular windowing the carrier function, the spectrums of OFDM symbol are basically sinc functions [2]. The comparative bandwidth requirements of FDM and OFDM subcarriers are shown in figure
1.1..Performing OFDM modulation is same as performing IFFT (Inverse Fast Fourier Transform) or IDFT (Inverse Discrete Fourier Transform) on a signal. That’s why IFFT block is used to analyze OFDM modulation techniques. The equation of IDFT as shown below
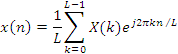
Here  are the subcarriers that modulate the parallel symbols. Once modulated, these subcarriers shift the bandwidth of the symbol to a frequency apart. Successive modulation of the
IJSER © 2015 http://www.ijser.org
International Journal of Scientific & Engineering Research, Volume 6, Issue 1, January-2015
ISSN 2229-5518
1670
subcarriers with the L parallel symbols takes the whole bandwidth reserved for the transmission
C. Operational block diagram of OFDM Figure 1.1shows the operational block diagram of OFDM system. First the data bits are PSK modulated. PSK or QAM modulations are mostly implemented in OFDM as baseband modulation techniques. Their choice depends on various factors like the bit rate and sensitivity to errors. Then the signal is serial to parallel converted into L parallel symbols. The output is fed to the L-point IDFT block with required number of zero padding, if required any. Based on the delay spread of the multi-path channel, an adequate guard-interval must be chosen.

And for the discrete time signal PAPR And for the discrete time signal PAPR
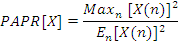
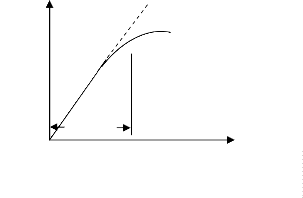
Here X is the symbol streams coming from the IDFT block. Max[X]2 is the maximum value in the modulated stream in the power form. E[X]2 is the average power of that stream. The high PAPR is a problem. The main reason is as shown in the figure 1.2. This happens linearly till the output is smaller than the saturation power level. As soon as the output crosses that level, the output varies non-linearly with the input power. That is the output power of the signal will no longer follow that of input [1]. This results in signal distortion at the transmitting end. At the receiving end, the bit error rate achieved will increase. Bit error rate will be intolerable when the PAPR of the
signal is too large.

P
Linear
Saturation
•
Non-linear region
Fig 1.2: For High PAPR problem in OFDM
The input signal to the amplifier in the OFDM system is an analog signal and the time domain samples of the output from the inverse

fast Fourier transform (IFFT) is [4]:
Fig: 11 Block diagram of OFDM system
Figure 1.1 also shows the operational block diagram of OFDM receiver. At the receiver, first the received signals are demodulated by the channel carrier and low pass filtered. These are parallel to serial converted and then PSK demodulated [1]..
The PAPR effect is shown in figure. 3.1. And it can be seen that the peak power is about 17 times the average power [4].
The peak to average power ratio (PAPR) of a continuous time signal is given by [4],
If the number of subcarriers (N) is large are zero mean Gaussian random variables. And for complex Gaussian the OFDM signal is Rayleigh distributed with variance and the phase of the signal is uniform.Thus the probability of the PAPR of the discrete signal exceeds a threshold is given by [4]:

Let us show how PAPR increases by increasing the number of subcarriers N. Assume N Gaussian independent and identically distribute random variables x(n ) with zero mean and unit power. The
average signal power --
IJSER © 2015 http://www.ijser.org
International Journal of Scientific & Engineering Research, Volume 6, Issue 1, January-2015
ISSN 2229-5518
1671
..then
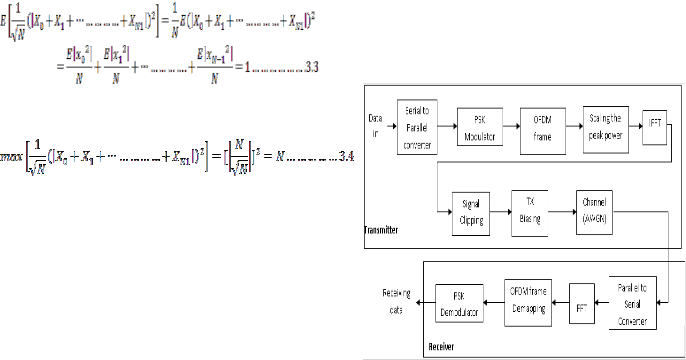
The data can transmit from one step to the other data transmission is shown in the figure. On this figure we can observe that data transmit at first serial to parallel. Then it modulated PSK modulation. After the PSK modulated the data signal OFDM modulated. Then scaling the peak power data will be IFFT. After the completion of IFFT the signal is clipped from the threshold level. From the threshold level signal is clipped.
The maximum value occurs when all the add coherently, which is
Thus, the maximum PAPR is N for N subcarriers.
One of the major disadvantages of OFDM systems is that the OFDM
signal has high Peak to Average Power Ratio (PAPR), and to deal with this problem many typical techniques have been proposed. Each one is different from others in complexity and performance, and can be divided into three major categories[7]:
1 Signal distortion techniques
Signal Clipping
Peak windowing
Peak cancellation
2 Coding Schemes
3 Symbol-scrambling techniques
.
Partial Transmit Sequences
Selected Mapping
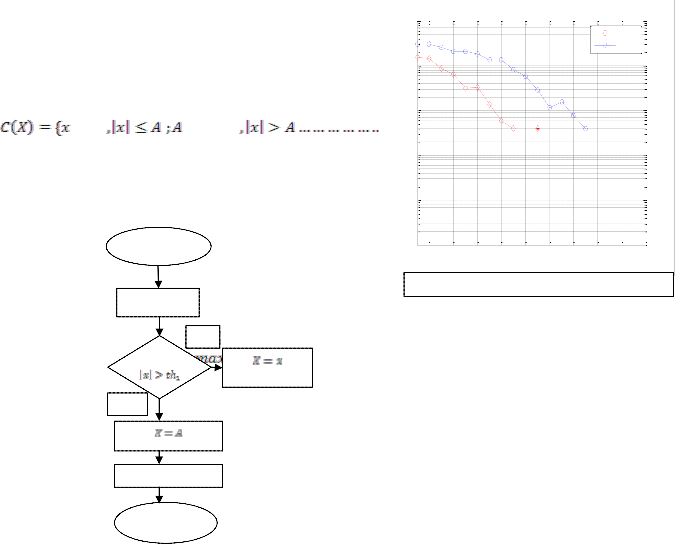
I. Signal Clipping:
Clipping is the simplest technique that is used to reduce PAPR in
OFDM system.. The following equation shows the amplitude clipping [5],
Fig 1.4 : Block Diagram for Signal Clipping

D. MATHEMATICALEXPRESSION:
BER vs SNR for 256-point PSK-OFDM
0
10
PSK
8-PSK
-1
10
-2
10
Where A is a positive real number and it presents the clipping level. 10-3
Peak regrowth happens when clipping exceed the clipping level. And
by repeating clipping and filtering process again the effect of this -4
10
distortion can be eliminated [5].
OFDM
2 4 6 8 10 12 14 16 18 20
SNR
Fig 1.7 BER vs SNR for 256 point PSK-OFDM
N
(OFDM YE
When the threshold level is increased then the PAPR is decreased. By changing the threshold level the appropriate PAPR is observed. When the threshold level is selected 0.06 then the PAPR is also reduced. For applying the threshold level 0.06 the PAPR will be 1.46.From the comparison it is shown that for the threshold level 0.06 the better PAPR is observed
PAPR Calculation
Fig. 1.3 Flow chart for
IJSER © 2015 http://www.ijser.org
International Journal of Scientific & Engineering Research, Volume 6, Issue 1, January-2015
ISSN 2229-5518
1672
PAPR of a OFDM without applying any method
1
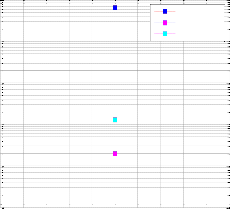
10
PAPR
average power
0 peak power
10
-1
10
-2
10
-3
10
-4
10
0 0.2 0.4 0.6 0.8 1 1.2 1.4 1.6 1.8 2

index
Fig 1.8: PAPR withiut applying any technique
PAPR of OFDM with clipping
1
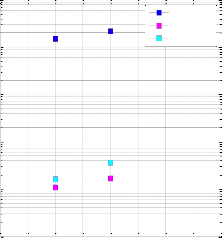
10
PAPR
average power
0 peak power
10
-1
10
-2
10
-3
10
-4
10
0 0.5 1 1.5 2 2.5 3 3.5 4

index(Here 1(Threshold=.04)& 2(Threshold=.06))
Fig 1.9: PAPR calculation for various threshold level in Clipping
BER vs SNR for QPSK-OFDM
0
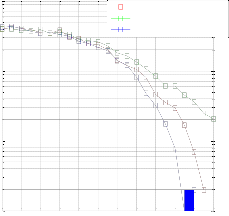
10
BER with Clipping(threshold(.06))
BER with Clipping(threshold(.04)) BER without Clipping
-1
10
-2
10
-3
10
-10 -8 -6 -4 -2 0 2 4 6 8 10 12
SNR (dB)
E. Conclusion
The BER comparison between the system with clipping and without clipping is shown in figure 2.1. It is observed by varying the signal to noise ratio from 1 to 22 dB and also calculating the bit error rate every time Both the curves gradually drop near 3x10⁻³ near the signal to noise ratio of 20 dB. So modulation at different points in the constellation diagram does not change the BER performance which is expected. In this curves the signal clipping which is just below 2x10-
1.From the figure it is observed that clipping signal BER performance
is better than other.
Now the better BER will be taken by choosing the appropriate threshold level. On this figure 2.1 it is shown that the threshold level
0.06 the BER rate is more appropriate than the threshold level 0.04
F. References:
1- Adarsh B. Narasimhamurthy, Mahesh K. Banavar, and Cihan Tepedelenlio˘ glu, “OFDM Systems for Wireless Communications”,2010, ISBN: 9781598297010.
2-Yao Xiao, “Orthogonal Frequency Division Multiplexing
Modulation and Inter-Carrier Interference Cancellation”, thesis, Department of Electrical and Computer Engineering, Graduate Faculty of the Louisiana State University and Agricultural and Mechanical College, May 2003, pp- 6 to 8, 10 and 14.
3- Jha, Uma Shanker, “OFDM Towards Broadband Wireless
Access”, Artech House Books, Norwood, 2007,ISBN:
9781580538091.
4-Santosh V Jadhav, “Orthogonal Frequency Division Multiplexing”, thesis, Department of Electrical Engineering, Indian Institute of Technology, Bombay, August 2003, pp- 12, 31, 32 and
35. In the authors depict a functional block diagram of OFDM
system.
5-Abhishek Arun Dash and Vishal Gagrai, “OFDM Systems and PAPR Reduction Techniques in OFDM Systems”, thesis, Department of Electronics and Communication Engineering, National Institute Of Technology, Rourkela, 2006 – 2010, pp- 13, 19,
20, 21 and 27-30.
6- SroyAbouty, Li Renfa, ZengFanzi and Fall Mangone,”A Novel
Iterative Clipping and Filtering Technique for PAPR Reduction
of OFDM Signals: System Using DCT/IDCT Transform”, College of Information Science and Engineering of Hunan University .
410082, Changsha, China.

7- GhanimAbd AL Kareem,”Proposed Combined PTS with Clipping and Filtering Technique for PAPR Reduction in OFDM System”. Engineering College, University of Al-Mustansiriya Baghdad.
Fig 2.1 BER using Clipping for different threshold level
IJSER © 2015 http://www.ijser.org