1988).
International Journal of Scientific & Engineering Research, Volume 3, Issue 11, November-2012 1
ISSN 2229-5518
The Formation of the High Tc Phase of Melt
Quenched Bi1.6Pb0.4Sr2Ca2Cu3Oy
Shirley T. Palisoc, Michelle T. Natividad, Phebe P. Mendoza
Abstract— The melt quench method was applied in the fabrication of Bi1.6Pb0.4Sr2Ca2Cu3Oy superconducting ceramics. The effects of melting the lead doped BSCCO were investigated using the scanning electron microscope and energy dispersive spectroscope (SEM/EDAX), differential thermal analyzer (DTA), x-ray diffractrometer (XRD) and magnetic susceptibility (χ-T) analyses. The results showed that the superconducting phase appeared even in the precursor samples. Glass forming tendency is also remarkably retarded. Sintering at 840°C for 24 hours completely vanished this glass forming ability. The critical temperature (Tc) onset was strongly dependent on the amount of non-superconducting impurities, grain size and intensity of the endothermic peak that affects the phase formation in the partially melted state.
—————————— ——————————
uperconductivity remained a much studied phenomenon for more than half a century after its discovery. A great deal of experimental information was gathered on its oc- currence and its properties and several useful theories were developed. Different methods were also applied for fabricat- ing superconducting materials. Among these were the alkox- ide route, citrate gel process, coprecipitation technique, com- bustion method, freeze dying, floating zone method, solgel, solid state reaction method, melt quench method and spray pyrolysis method (Yoo et al 2004). Efforts were also made to enhance and increase the volume fraction of the high Tc phase by several processes like low tremperature annealing, long time sintering, sintering under low oxygen partial pressure and lead (Pb) addition. The lead addition was found to be the
most efficient (Asamo et al 1989, Yoshizaki et al 1990).
This paper presents a simple way of fabricating Pb doped
BSCCO superconductiong glass ceramics known as the melt quench method. The method involves metling the raw materi-
als in a crucible and then quenched to room temperature. The study deals with the characterization of the melt quenched samples and the determination of the relationship between the melt quenched precursors and the sintered samples.
The nominal composition of Bi1.6Pb0.4Sr2Ca2Cu3Oy was pre- pared from Bi2O3, PbO, SrCO3, CaCO3 and CuO. The mixed powder was melted in an alundum crucible in an electric fur- nace at a temperature of 1080°C (Harada et al 1992) for 5 minutes. The melts were poured immediately onto a stainless steel plate and then cooled to room temperature. The obtained samples were characterized using the SEM/EDAX, DTA and
————————————————
Shirley Tiong Palisoc, Ph.D. In Materials Science is a professor at the Department of Physics, De La Salle University – Manila, Philippines. E-mail: shirley.palisoc@dlsu.edu.ph
Michelle Natividad, Ph.D. in Physics is an assistant professor at the De- partment of Physics, De La Salle University – Manila, Philippines.
Phebe Mendoza, M.S. in Physics is a faculty member of Holy Angel
University, Pampanga, Philippines
XRD. SEM/EDAX JEOL JSM35C was used to analyze the crys- tal grain structure and the micro composition of the precur- sors. X-ray diffraction measurement was carried out using the RIGAKU X-ray diffractometer. The diffractometer used CuKα radiation with a wavelength of 1.541838Å, generator tension of 30kV and generator current of 15mA. The scanning angle ranged from 2° to 41°. For the differential thermal analysis, the Perkin and Elmer Thermal Analyser was used. The reference material used for temperature difference was aluminum oxide (Al2O3).
The melt quenched precursors were weighed and divided to approximately 4 grams each. Each 4 gram powder was pelletized to 6 tons for 3 minutes using the hydraulic press. Each pellet was approximately 2 cm in diameter and 2.5 mm in thickness. All pellets were sintered at a constant tempera- ture of 840°C for 24 hours. The samples were left to cool inside the furnace to room temperature. The samples were character- ized by SEM/EDAX, DTA, XRD and χ-T tests.
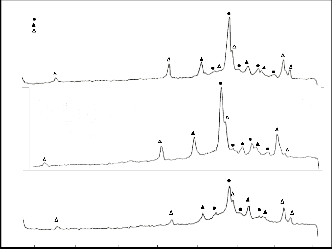
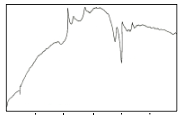
The XRD patterns for the melt quenched precursor (Fig. 1a) show that there is a coexistence of high Tc peaks correspond- ing to the 2223 and 2212 phases, respectively. A prominent peak at 2θ = 30° is observed in all the precursor samples. Ac- cording to Komatsu et al (Komatse et al 1988), this peak is as- cribable to the glassy phase which indicates that this phase is largely included in the melt quenched samples. Peaks attribut- ed to the impurity Ca2CuCO3 and CaO are observed around
2θ = 36.4° and 2θ = 37.5°, respectively. These peaks are present in all trials and no significant change in its intensity is ob- served. The peak at 2θ = 36.4° disappeared after sintering in trial 3. The peak around 2θ = 37.5° disappeared after sintering for trials 2 and 3 and a very minimal amount is left for trial 1. This can be attributed to the melting of the secondary phases Ca2CuCO3 and CaO at around 700°C – 750°C as shown in the DTA results. Peaks resulting from a semiconducting phase (2201) occurring at 2θ = 21.9° and 2θ = 7.1° are found in all precursors. This peak also disappeared after sintering. This may be attributed to the formation of the 2212 phase from
IJSER © 2012
International Journal of Scientific & Engineering Research, Volume 3, Issue 11, November-2012 2
ISSN 2229-5518
2201 phase during annealing at around 800°C (Kanai et all
1988).
(0010)
2212
2223
Unidentifi ed Peak
Trial 1
(0010)
Trial 2
Trial 3
0 10 20 30 40
2 (DE REE)
(1 15 )
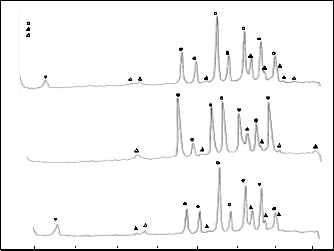
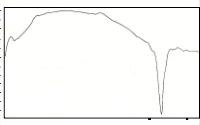
pattern of this DTA curve is very similar to that of the melt quenched sample reported by Sato et al (Sato et al 1989), alt- hough the endothermic and exothermic temperature peaks are different. The first exothermic peak after the glass transition can be attributed to the crystallization of the 2201 phase. It is noted that the second exothermic peak is always found to be strongest (Holesinger et al 1992). The reason for this is not yet clear. The second exothermic peak can be attributed to the formation of the secondary phase such as CaO, Ca2CuO3 and some undissolved Bi2O3. The third exothermic peak can be attributed to the crystallization of the 2212 phase. The endo- thermic peaks after the exotherms can be attributed to the melting of the secondary phases and partial melting of the
2201 phase. The exothermic peak around 790°C corresponds to the formation of 2212 phase and the subsequent formation of the 2223 phase enhanced by the partial melting of the 2201 phase (Sato et al 1989). This exothermic peak is followed by endotherms indicating the melting of the different phases.
It is noted that the endothermic peaks after the three ex-
otherms are nearly identical. However, some minor differ-
ences in their scans suggest that a small amount of zinc and aluminum, as shown in EDAX results, inhibit the formation in the partially melted state (Holesinger et al 1992). An exother- mic peak still appeared after the endothermic event for trial 1. This is likely attributed to an unknown phase formation or
2212
2223
Unidentified Peak
Trial 1
formation of 2223 phase since partial melting occurred around
830°C – 879°C (Hatano et al 1988).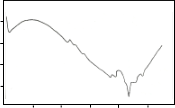
![]()
1 4.6
(0 08 )
(2 04 )
1 4.4
Trial 1
Trial 2
1 4.2
1 4.0
(1 15 )
1 3.8
0 2 00 4 00 6 00 8 00 1 000 1 200
Trial 3
![]() 1 .4
1 .4
0 T(°C)
Trial 2
0 .8
0 10 20 30 40
2 (DEREE)
Peaks at (115), (119) and (0014) corresponding to the 2223 phase is again observed after sintering and most of the re- maining peaks are attributed to the more stable phase which is the 2212 phase (Fig. 1b). The presence of the impurity peak at
2θ = 17.6° (Ca2PbO4) arising from the addition of lead in the
system and at 2θ = 36.4° (Ca2CuCO3) are very minimal. Data show a predominance of 2212 phase over 2223 phase for the
sintered samples.
Most thermal events in the DTA scans of the precursor
samples can be matched, suggesting that the crystallization
processes for the three trials are essentially the same (Fig. 2a).
0 .4
0 .0
-0 .4
-0 .8
![]() 0 .0
0 .0
-0 .1
-0 .2
-0 .3
-0 .4
0 2 00 4 00 6 00 8 00 1 000 1 200
T(°C)
Trial 3
0 2 00 4 00 6 00 8 00 1 000 1 200
T(°C)
Glass transition (Tg) at around 250°C – 398°C is observed be- fore three exothermic peaks. Two smaller endothermic peaks precede the main melting event at around 770°C- 860°C. The
IJSER © 2012
International Journal of Scientific & Engineering Research, Volume 3, Issue 11, November-2012 3
ISSN 2229-5518
0 .0
- 0 .2
- 0 .4
-0 .6
- 0 .8
-1 .0
-1 .2
-1 .4
-1 .6
-1 .8
-2 .0
-2 .2
0
Trial 1
2 00 4 00 6 00 8 00 1 000
T(°C)
Trial 2
1 .8
1 .6
1 .4
1 .2
1 .0
0 .8
0 .6
0 .4
0 .2
0 .0
-0 .2
- 0 .4
0
Trial 2
2 00 4 00 6 00 8 00
T(°C)
1 000
Trial
0 .0
0 .1
0 .0
-0 .1
-0 .2
-0 .3
-0 .4
-0 .5
-0 .6
0
Trial 3
2 00 4 00 6 00 8 00 1 000
T(°C)
Trial 1
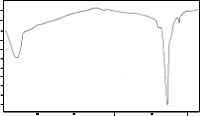
The DTA curves for the sintered samples are shown in Fig. 2b. The three curves show an endothermic peak at tem- perature between 820°C – 892°C. These endothermic peaks are attributed to the melting point of the samples. The peak at
90°C – 150°C may be due to the thermal instability of the sys- tem which occurs during the start of the run and not a phase transition of the sample. XRD results for the sintered samples show quite a stable 2212 phase as verified by DTA since no exothermic peak appears in the scan. At temperature 951.79°C for trial 1 an endothermic peak is observed. The reason for this is still unknown. This probably can be attributed to the melt- ing of the Cu2CaCO3 and CaO phases.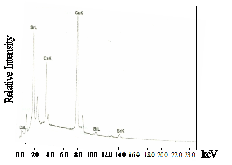
Trial
Trial
Trial 1
IJSER © 2012
International Journal of Scientific & Engineering Research, Volume 3, Issue 11, November-2012 4
ISSN 2229-5518
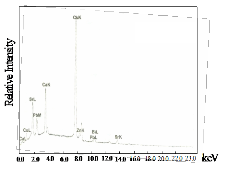
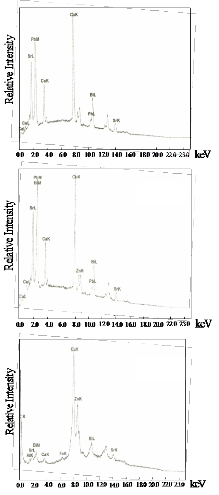
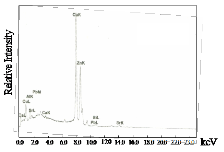
Fig. 3b shows the EDAX results for the sintered samples. It can be seen that in trial 3, the impurity did not disappear even after sintering. The relative amount of Bi, Sr, Ca, Cu and Pb of the three trials decreased after sintering. This could be explained by the removal of the glass phase after sintering as verified by the XRD results.
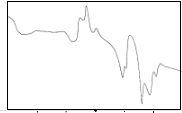
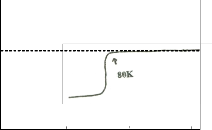
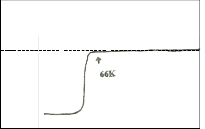
tered samples. The ac susceptibility for trial 1 shows a two step transition: a small one of the high Tc phase (106K) and a large step, one of the low Tc phase (68K). DTA results show a broad exotherm at approximately 930oC for trial 1. This peak is attributed to the formation of the high Tc phase. DTA results for trials 2 and 3 show the absence of this peak. Formation of high Tc phase in trial 1 is distinct and is related to this small step size which is not seen in the χ-T curve of trial 2. XRD re- sults also show that trial 1 has higher peak intensity and small amount of Ca2PbO4. The high Tc phase in trial 2 as identified by XRD results is verified by ac- susceptibility measurement showing a signal of high Tc phase at around 80K. The decrease in the Tc onset can be attributed to the large amount of Ca2PbO4 and non superconducting phases. Trial 3 has the lowest Tc onset (66K). XRD result shows that it has the highest percentage of coexisting low and high Tc peaks.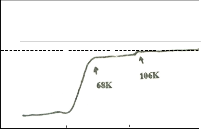
0
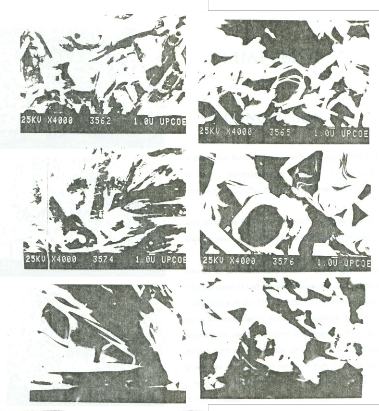
Fig. 5a shows the SEM micrographs of the precursor sam- ples. The needle like structure is abundant for all trials. These needle shape grain may be an intermediate state of non- superconducting phase (Shah et al 1988). This is consistent with the XRD results of the precursor samples. Fig. 5b shows the SEM micrographs of the sintered samples. As observed from the photographs, the sample in trial 1 (Tc onset of 106K) has advanced crystal growth as compared to trial 2 with big- ger grain size and lower Tc onset of 80K. The sample in trial 3 (Tc onset of 66K) has the least crystallization development. The change in microstructure is attributed to the change in thermal reaction. High Tc phase is formed during an endothermic reac- tion. A weak endothermic reaction shows a slow nucleation thus the high Tc phase slowly develops (Nasu et al 1990). DTA for sintered samples for trial 1-3 show a decrease in the endo- thermic sharpness and intensity thus nucleation slowly devel- ops. This is consistent with the SEM results. Small grain size is said to preferably attain High Tc end (Nasu et al 1990). This is also consistent with the χ-T results. As the endothermic peak decreases from trial 1-3, grain size increase and Tc onset de- creases.
50 100 150 T(K)
0
50 100 150 T(K)
0
50 100 150
T(K)
IJSER © 2012
International Journal of Scientific & Engineering Research, Volume 3, Issue 11, November-2012 5
ISSN 2229-5518
In this paper, the highest onset critical temperature for Bi1.6Pb0.4Sr2Ca2Cu3Oy ceramic is 106K. XRD results show that the precursor that has a higher intensity peak and less per- centage impurity phase lead to a higher transition tempera- ture. SEM results for the precursor sample shows that the glass forming ability is decreased due to the presence of both the superconducting and non-superconducting phases. This is consistent with the XRD results. DTA results show that most of the thermal events in the study can be matched, suggesting that the crystallization processes are essentially the same. However, differences in their endothermic and exothermic temperatures are observed. The presence of an exothermic peak after the main melting suggests a greater and enhanced high Tc phase formation. The absence of this exothermic peak suggests a less high Tc phase formation as collaborated by the χ-T results. The endothermic peak increased as Tc onset in- creased suggesting a faster nucleation and a decrease in grain size. This is consistent with the SEM results. This agrees with the results of Nasu et al (Nasu et al 1990) where smaller grain size is preferable in having high critical temperature. EDAX results also show several impurities. These impurities inhibit the formation of the 2212 and 2223 phases and affect the phase formation in the partially melted state.
The precursor that has the sharpest endothermic peak, smallest grain size, least amount of impurities and the highest peak intensity lead to a higher transition temperature.
[1] Asano T, Tanaka Y, Fukutomi M, Jikihara K & Maeda H. 1989. Prop- erties of Pb-Doped Bi-Sr-Ca-Cu-O Superconductors Prepared by the Intermediate Pressing Process. Japanese Journal of Applied Physics.
28:L595-L597.
[2] Harada R, Yoshinari O & Tanaka K. 1992. Crystallization of Super- conducting Phases in Melt-Quenched and Annealed Bi1.6Pb0.4Sr2Can-
1CunOy (n=1 to 4) Ceramics. Japanese Journal of Applied Physics.
31:2420-2426.
[3] Hatano T, Aota K, Ikeda S, Nakamura K & Ogawa K. 1988. Growth of the 2223 Phase in Leaded Bi-Sr-Ca-Cu-O System. Japanese Journal of Applied Physics. 27:L2055-L2058.
[4] Holesinger TG, Miller DJ & Chumbley LS. 1992. Crystallization of Bi- Sr-Ca-Cu-O glasses in oxygen. Journal of Materials Research. 7:1658–
1671.
[5] Holesinger TG, Miller DJ, Fleshler S & Chumbley LS. 1992. Pro- cessing of Bi-Sr-Ca-Cu-O Glasses Using Platinum and Alumina Cru- cibles. Journal of Materials Research. 7:2035-2039.
[6] Kanai T, Kumagai T, Soeta A, Suzuki T, Aihara K, Kamo T & Matsuda S. 1988. Crystalline Structures and Superconducting Properties of Rapidly Quenched BiSrCaCu2Ox Ceramics. Japanese Journal of Applied Physics. 27:L1435-L1438.
[7] Komatsu T, Sato R, Hirose C, Matusita K & Yamashita T. 1988. Prepa-
ration of High-Tc Superconducting Bi-Pb-Sr-Ca-Cu-O Ceramics by the Melt Quenching Method. Japanese Journal of Applied Physics.
27:L2293-L2295.
[8] Nasu H, Kuriyama N & Kamiya K. 1990. Influences of Nb Addition on Superconducting Properties in Bi, Pb-Sr-Ca-Cu-O Glass-Ceramics. Japanese Journal of Applied Physics. 29:L1415-L1418
[9] Sato R, Komatsu T, Matushita K & Yamashita T. 1989. Superconduct- ing Properties of Bi-Pb-Sr-Ca-Cu-O Ceramics Prepared by the Melt- Quenching Method. Japanese Journal of Applied Physics. 28:L583-L586.
[10] Shah SI & Jones GA. 1988. Growth and microstructure of Bi-Sr-Ca-
Cu-O thin films. Applied Physics Letters. 53:429-431.
[11] Yoshizaki R, Ikeda H, Yoshikawa K & Tomita N. 1990. Properties of Pb-Doped Bi-Sr-Ca-Cu-O Superconductors Prepared by a Hot-Press Method. Japanese Journal of Applied Physics. 29:L753-L756.
IJSER © 2012