International Journal of Scientific & Engineering Research, Volume 6, Issue 1, January-2015 1306
ISSN 2229-5518
The Effect of the Amplifier Length on the Gain and Noise Figure of the Er/Yb Co-Doped Waveguide Amplifiers
O. Mahran1,2 and A.A.Samir1
Abstract: The variations of the amplifier waveguide length on the gain and noise figure of the phosphate glass Er3+-Yb3+-co-doped waveguide amplifiers (EYCDWA) are calculated from the rate equations and the light propagation equations under the uniform dopant and the steady-state condition. The gain increases as the amplifier waveguide length increases then decreases for further increase in the length and noise figure increases as the amplifier waveguide length increases then saturated for further increase in the length for our case of calculations. In our analysis, the pump power variations make improvement for the gain and noise with the amplifier waveguide length variations, also we have neglected the amplified spontaneous emission (ASE) and have introduced the initial energy transfer efficiency.
Index Terms— Er/Yb codoped – Gain – Noise figure – waveguide – waveguide amplifier length.
—————————— ——————————
1. Introduction
Erbium-ytterbium (Er3+/Yb3+) doped fiber lasers and amplifiers show a growing potential for many applications in different areas such as industry, medicine, communication, military and research. Cladding pumped fiber lasers based on Er3+/Yb3+ doped silicate glass are an attractive technology for compact and efficient sources in the eye-safe spectral range [1], for both high power continuous wave (CW), as well as high repetition rate and high energy short pulse generation.
The erbium doped waveguide amplifiers have recently attracted a great deal of attention because of the plausibility of introducing various active elements in integrated optical circuits. These integrated optics devices require a higher concentration of erbium ions than long fibers for comparable. However, high erbium concentration will increase the number of the erbium clusters, and hence reduce the spacing between the erbium ions. In this case the overlapping between the electrons clouds of erbium ions, increasing the excited state absorption (ESA). Therefore, the clustering enhances the ESA [2]. The clustering greatly reduces the pump efficiency and degrades the gain performance. Fortunately, the rare-earth element ytterbium, exhibits a better overlapping between the Yb3+ emission spectrum and the Er3+ absorption
————————————————
1 Physics Department, Faculty of Science, Alexandria University,
Alexandria, Egypt.
2 Physics Department, Faculty of Science, Al Jouf University, Al Jouf, Sakaka,Saudi Arabia.
clustering effect and a large absorption cross-section compared to erbium, by which high the gain characteristics of the waveguide amplifiers.
ytterbium ion (Yb3+) dopant level can realized in the waveguide. This can noticeably reduce the quenching side-effect caused by high Er3+ dopant concentration [3], so the erbium-ytterbium (Er3+ - Yb3+) co-dopant can efficiently improve the gain characteristics of the waveguide amplifiers.
We choose the phosphate glass Er3+ - Yb3+ - co- doped waveguide amplifier (EYCDWA) because has attracted much attention and nowadays plays an important role in optoelectronic integrated circuits (OEICs) [4-6]. In this paper, the variations of the amplifier waveguide length on the gain and noise figure of the phosphate glass Er3+- Yb3+-co-doped waveguide amplifiers (EYCDWA) are calculated from the rate equations and the light propagation equations under the uniform dopant and the steady-state condition. The gain increases as the amplifier waveguide length increases then decreases for further increase in the length and noise figure increases as the amplifier waveguide length increases then saturated for further increase in the length for our case of calculations. In our analysis, the pump power variations make improvement for the gain and noise with the amplifier waveguide length variations; also we have neglected the amplified spontaneous emission (ASE) and have introduced the initial energy transfer efficiency.
2. Model of calculations
spectrum and an intense broad absorption in the wavelength range from 800 to 1080 nm, and has a weak
IJSER © 2015 http://www.ijser.org
International Journal of Scientific & Engineering Research, Volume 6, Issue 1, January-2015 1307
ISSN 2229-5518
For pumping, the rate equations for the Er3+ - Yb3+ - co- doped waveguide amplifier (EYCDWA) and the gain and noise figure are expressed in [7].
We can express the maximum gain G0 and the optimum waveguide length L0 as follows, respectively
G0 (L0) = γ1⁄α exp(ΓsσNEr L0) (1)

ln G0 −1 ln γ
L0 (G0) = α
ΓsσNEr
Where
(2)

γ = Ac σ12hνp
αBΓs(σ12 +σ21 )Pp (0)σ
(3)
The parameters in equations 1- 3 expressed in table 1 [7].
3. RESULTS AND DISCUSSION
Calculations are performed using Matlab programs to analyze the gain and noise figure characteristics of the phosphate glass EYCDFA and show its dependence on the amplifier length. The values of parameters used in the calculation are selected as [8-10]:
3.1 Effects of fiber length on gain
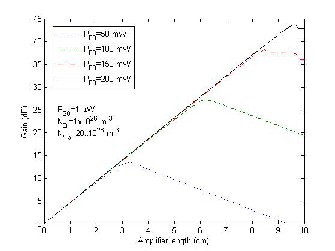
Figure 1 shows the relation between the gain of EYCDFA and the amplifier waveguide length for different value of pump powers 50, 100, 150, 200 mW at the pump wavelength of 980 nm , where we take the signal power Ps0
= 1µW, Er3+ ion concentration NEr = 1.0×1026 m–3, Yb3+ ion concentration NYb =20×1026 m–3. At the first there is a linear relation between the gain and the amplifier length then exponential decrease with further increases in the amplifier length, we can also see that as the input pump power increases the gain increases. The values of optimum amplifier length which gives the maximum gain at the condition listed in the figure are given in table 1.
Fig. 1 the gain as a function of the amplifier length at Ps0 =1 µW.
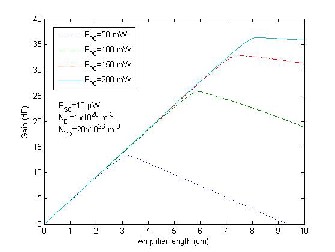
Fig. 2 the gain as a function of the amplifier length at Ps0 =10 µW.
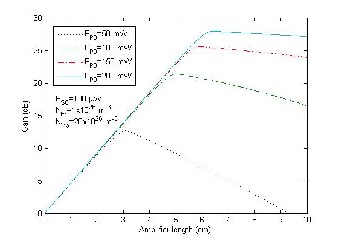
Fig. 3 the gain as a function of the amplifier length at Ps0= 100 µW
IJSER © 2015 http://www.ijser.org
International Journal of Scientific & Engineering Research, Volume 6, Issue 1, January-2015 1308
ISSN 2229-5518
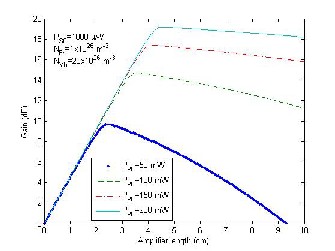
Fig. 4 the gain as a function of the amplifier length at Ps0= 1000 µW
Figures 2, 3 and 4 show the same relation between the gain of EYCDFA and the amplifier waveguide length for different value of pump powers 50, 100, 150, 200 mW at the pump wavelength of 980 nm , for another three values of the signal power Ps0 = 10, 100 and 1000µW for Er3+ ion concentration NEr = 1.0×1026 m–3, Yb3+ ion concentration NYb =2.0×1026 m–3. From the behavior of the gain we conclude that as the input signal power increase, the gain decreases for the optimum values of the amplifier length as in table 1.
TABLE 1 SHOW S THE RESULTS FROM THE CURVES IN FIGURES 1-3
Input signal power (PS0) | Input pump power PP0=50mW | Input pump power PP0=100mW | Input pump power PP0=150mW | Input pump power PP0=200mW |
Input signal power (PS0) | Gain (G) | Z | G | Z | G | Z | G | Z |
1 µW | 13.42 | 3.26 | 27.21 | 6.23 | 38.26 | 8.49 | 43.67 | 9.69 |
10 µW | 13.34 | 3.21 | 25.79 | 5.93 | 32.89 | 7.43 | 36.36 | 8.14 |
100 µW | 12.65 | 3.06 | 21.38 | 5.02 | 25.55 | 5.98 | 27.93 | 6.48 |
1000 µW | 9.70 | 2.46 | 14.71 | 3.56 | 17.41 | 4.17 | 19.17 | 4.67 |
From the table we can say that, the larger the pump power, the larger the optimum fiber length becomes and it is evident that the gain can be progressively increased by using higher pump powers. When increasing the signal powers from 1 to 1000 µW. It can be noticed that the decrease of the gain and the optimum fiber length with
increasing signal input power is simply due to saturation
effects in the amplifier (i.e. the signal power becomes comparable to the pump power and acts as a negative pump reducing population inversion).
There are two physical reasons in the variation of the gain with the fiber length. The first reason is that the gain increases linearly with the fiber length according to the linear gain regime. The second reason is that the gain decreases due to high absorption of pump power by Yb3+ ions.
If the fiber length is too large so as to the gain less than zero, in this case, the Er3+ ion population reversion cannot be realized in the amplifier, moreover, Er3+ ions absorb the signal energy, and then the gain turns to the absorption. The introduction of Yb3+ ions can shorten the optimum length greatly.
3.2 Effects of amplifier length on noise figure
Figure 5 shows the relation between the noise of EYCDFA and the amplifier waveguide length for different value of pump powers 50, 100, 150, 200 mW at the pump wavelength of 980 nm , where we take the signal power Ps0
= 1µW, Er3+ ion concentration NEr = 1.0×1026 m–3, Yb3+ ion
concentration NYb =20×1026 m–3. There is nearly a linear relation between the noise and the amplifier length, we can also see that as the input pump power increases the noise increases.

Fig. 5 the variation of noise figure with fiber length at PS0=1 µW
IJSER © 2015 http://www.ijser.org
International Journal of Scientific & Engineering Research, Volume 6, Issue 1, January-2015 1309
ISSN 2229-5518
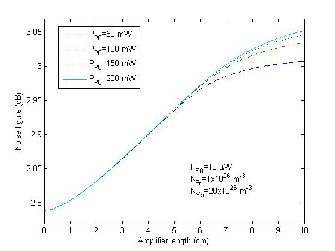
Fig. 6 the variation of noise figure with fiber length at PS0=10 µW
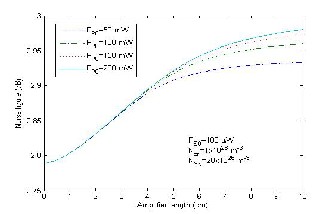
Fig. 7 the variation of noise figure with fiber length at PS0=100 µW
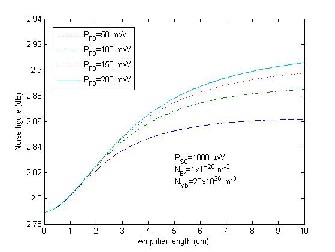
Fig. 8 the variation of noise figure with fiber length at PS0=1000 µW
Figures 6, 7 and 8 show the same relation between the noise of EYCDFA and the amplifier waveguide length for
different value of pump powers 50, 100, 150, 200 mW at the pump wavelength of 980 nm , for another three values of the signal power Ps0 = 10, 100 and 1000µW for Er3+ ion concentration NEr = 1.0×1026 m–3, Yb3+ ion concentration NYb =2.0×1026 m–3. It is clear that the increase in noise figure can be clearly noticed. The reason for this increase is the decreasing gain with sharp pump depletion. the noise figure increases up to 2.89 dB from 2.85 dB when the pump power is increased to 200 mW from 50 mW at L=6 cm. we can observe that the variation of noise figure at low pump power is smaller than that of high pump power.
As the input signal power increase From 1 to 1000
µW at pump power 200 mW and z=9 cm, The NF decrease to 3.088, 3.042, 2.975, 2.903 dB respectively, This indicate that as the signal power increase the noise figure decrease.
There are also two regimes of these variations. Inthe first regime, both terms in Equation [7] are responsible for the noise figure. In the second regime, ASE+ noise gradually decreases while the first term in Equation 30, (1/G), which corresponds to the shot noise [10], sharply increases leading to a high noise figure. The up-conversion is responsible for considerable reduction in gain and pump power efficiency [7, 10].
4- CONCLUSION
We have demonstrated a computational method for calculating the properties of phosphate glass Er3+-Yb3+-co- doped waveguide amplifiers (EYCDFA). Several parameters have important effects on gain and noise figure of EYCDFA, like the variations of amplifier waveguide length. The calculation performed using the rate equations and the light propagation equations under the uniform dopant and the steady-state condition. On the basis of preceding analysis and discussion for the gain and noise figure characteristics of the phosphate glass EYCDFA, some conclusions are reached as follows. The gain increases as the amplifier waveguide length increases then decreases for further increase in the length and noise figure increases as the amplifier waveguide length increases then saturated for further increase in the length for our case of calculations. In our analysis, the pump power variations make improvement for the gain and noise with the amplifier waveguide length variations; also we have neglected the amplified spontaneous emission (ASE) and have introduced the initial energy transfer efficiency.
The sensitization of Yb3+ ions can effectively restrain the Er3+ ion clusters, and reduce up-conversion nonlinear
IJSER © 2015 http://www.ijser.org
International Journal of Scientific & Engineering Research, Volume 6, Issue 1, January-2015 1310
ISSN 2229-5518
side effect. This can increase the total gain; therefore, the performance of the EYCDFA is better than that of the EDFA. Furthermore, the introduction of Yb3+ ions can shorten the length; this is propitious to the miniaturization and the integration of the EYCDFA device. In a comparison between a phosphate glass and a typical silicate glass amplifier, it was shown that the phosphate glass amplifiers exhibit higher gains than the silicate glass ones.
REFERENCES
[1] | J. Nilsson, J.K. Sahu, Y.J. Jeong, W.A. Clarkson, R. Selvas, A. Grudinin, S. Alam, High power fiber lasers: new developments, in: L.N. Durvasula(Ed.), Advances in Fiber Lasers, Proceedings of SPIE 4974, 2003, p. 50. |
[2] | LU ZG, LIU JR, SUN FG, XIAO GZ, LIN P. A hybrid fiber amplifier with 36.9-dBm output power and 70-dB gain. Optics Communications 2005;256(4–6):352–7. |
[3] | Strohhofer C, Polman A. Relationship between gain and Yb3+ concentration in Er3+–Yb3+ doped waveguide amplifiers. J Appl Phys 2001;90:4314–20. |
[4] | Jin GL, Shao GW, Mu H, Hu LL, Li Q. Gain and noise figure of a double-pass waveguide amplifier based on Er/Yb-doped phosphate glass. Chin Phys Lett 2005;22:2862–4. |
IJSER © 2015 http://www.ijser.org