International Journal of Scientific & Engineering Research, Volume 4, Issue 12, December-2013 2109
ISSN 2229-5518
The Effect of Accounting Standards on Management of Earnings: Evidens from Germany
Kawa Wali
Abstract— IFRS (International Financial Reporting Standards) is an accounting standard for annual reports of companies. Since January 1, 2005, all listed companies in the EU are required to report under the IFRS, that it means all companies from EU- countries from 1-1 -2005 had to switch from reporting under GAAP (Generally Accepted Accounting Principles). German listed companies were allowed to present consolidated accounts prepared under German GAAP, IAS. This paper investigates whether the amount of management of earnings differs between the standards. W hile the manipula- tion under German GAAP and IFRS is relatively difference. I find that adoption of IFRS for reporting by listed companies in 2005 has surely reduced the use of management of earnings compared to German companies earlier reporting under generally accepted accounting principles GAAP. This is con- sistent with an interpretation that different amount of accounting choices enclosed firmly in different accounting standards affected the magnitude of management of earnings. The results of this paper hold for various proxies of management of earnings and after controlling for factors effecting the adoption of the standards. This paper documented that discretionary accruals under local GAAP are more valued in German listed companies. Moreo- ver, the research finds that net income, accruals and discretionary accruals are more relevant than cash flow, non-discretionary accruals and non- discretionary income. The evidence shows that accruals improve the association of earnings with contemporaneous stock returns.
.
Keywords: Accruals, Management of Earnings, International Accounting Standards.
—————————— ——————————
1 INTRODUCTION
niform accounting standards attempt to reduce manag- ers’ ability to record similar economic transactions in dissimilar ways, either over time or across firms. The
legal environment in which accounting differences between managers, auditors, investors are arbitrated can also have a significant effect on the quality of reported numbers (Palepu et al, 2008).
When studying the financial statements a lot of value is given to the item 'earnings' since the value of the company depends on it. The value of the company is the present value of future earnings. An increase or decrease in ‘earnings’ can lead to respectively an increase or decrease in the value of the company.
Given the importance of earnings, it is obvious that managers are trying to report earnings as positively as possible. There- fore, managers try to manage earnings (Lev, 1989).
Research shows that also in Germany management of earn- ings happens much more than is often suggested. According to Schipper (Schipper, 1989) and later Healy and Wahlen, (1999) earnings management is “a deliberate intervention by management for personal interest.”
• Kawa Wali is currently a lecturer of Accounting at Salahaddin University – Hawler, PhD. student at Erasmus University Rotterdam, Burgemeester Oud- laan 50, 3062 PA Rotterdam Postbus 1738, 3000 DR Rotterdam. PH-
00964 - 7503803755, E- kawawali@gmail.com
Most of the prior studies on management of earnings have focused on why firms manage earnings. Several reasons have been identified that include; income smoothing (Yoon and Miller, 2002b), ownership control (DeAngelo, 1988), equity offerings (Rangan, 1998; Teoh et al., 1998; Yoon and Miller,
2002a) and political costs (Jones, 1991).
Healy and Wahlen (1999) define: “Earnings management occurs when managers use judgments in financial reporting and in struc- turing transactions to alter financial reports to either mislead some stakeholder about the underlying economic performance of the com- pany or to influence contractual outcomes that depend on reported accounting numbers”
A distinction must be made between efficient and opportun- istic earnings management. Utama and Siregar (2008) define both types. Efficient earnings management is to improve the information value of Earnings by communicating company- specific information to the external world. Management of earnings can thus lead to an appreciation of the accounting information (Healy and Wahlen, 1999). With opportunistic earnings management, management will manage the profits to maximize their utility. This can be a potential misallocation of resources and mislead stakeholders result (McNichols and Stubben, 2008).
Empirical Investigation in Germany
An empirical analysis of the development of earnings quality
in Germany is useful for the following reason: an empirical
IJSER © 2013 http://www.ijser.org
International Journal of Scientific & Engineering Research, Volume 4, Issue 12, December-2013
ISSN 2229-5518
2110
examination of earnings quality using a variety of measures for German listed companies has never been conducted with regard to the development over time. So far, analyses of earn- ings quality of the annual statements of German listed com- panies have solely been conducted as comparative studies, focusing on the comparison of the different accounting sys- tems provided by German-GAAP, IFRS and US-GAAP
Prior research has compared properties of accounting amounts using samples of German companies (e.g., Hung and Subramanyam 2007; Bartov and Kim 2005; Barth et al.
2008, Barth et al. 2006). This study differs from prior research on adopting of IAS and IFRS accounting measures in that research examines the change in adopting of accounting caused by the revisions made to IASs and the development of new IFRSs.
This study compares the characteristics of accounting amounts using a sample of German companies reporting un- der IAS during 2000-2003, and under IFRS during 2003-2004 and 2005-2008. Specifically, it investigates whether manage- ment of earnings is applied before this period and then dur- ing the three times that IASB revised the existing IAS rules and issued new IFRS regulations to formulate a set of high quality international accounting standards for global financial reporting purpose.
2 Prior literatures on Management of Earnings
DeFond and Subramanyam (1998), Bartov, Gul and Tsui (2001), Frankel, Johnson and Nelson (2002), Larcker and Rich- ardson (2004) have examined the relation between auditor independence and earnings management. They discovered that lack of audit independence is associated with earnings management. Balsam (1998) finds that cash compensation to CEO’s is associated with discretionary accruals. Baker, Baker, et al. (2003) found that managers opportunistically manage earnings relative to the award date when compensated with stock options. Gul, Chen and Tsui (2003) find higher manage- rial ownership reduces the positive association between dis- cretionary accruals and audit fees, thus indicating that it is used to communicate value relevant information.
Focusing specifically on the impact of board characteristics on the incentives to manage earnings, one finds that corporate governance codes around the world emphasize the fiduciary role of the board of directors in curbing opportunistic earn- ings manipulation and in ensuring that earnings figures con- vey true information about firm operations (Peasnell, et al.
2000). In this regard, the existing literature largely supports the contention that board structure matters in management of earnings independence of the board of directors as well as the
IJSER
One of the first studies of earnings quality in Germany is
conducted by Gassen/Sellhorn (2006). They compare the rela-
tive quality of IAS/IFRS and German GAAP earnings by a
sample of 354 German listed companies each, in the period
from 1998 to 2004. They show that the persistence of earnings
of those companies accounting by IAS/IFRS is significantly
higher than of those companies accounting by German
GAAP.
Similarly, the quality of accruals appears to be higher in IAS/IFRS accounting than in German GAAP. There is, how- ever, no statistically significant difference detectable in this measure. Gassen/Sellhorn (2006) also find that the predicta- bility of earnings for future earnings is significantly lower in IAS/IFRS reports than in German GAAP reports.
When research is done into management of earnings, I am however dealing with a process that is hard to predict. Hence, it is necessary for managers to make accruals. Accru- als are needed in order to do measurements, and to measure management of earnings, so-called ‘accruals’ – pre-bookings are needed (Rath & Sun, 2008). These accruals form the dif- ference between the reported profit on one side, and the cash flow on the other side. In other words, there exists a discrep- ancy between what is being reported and that, which is the true total amount of the net profit plus write-offs.
In general, accountants only look at the simple controls of the annual report, without questioning possible management of earnings (Richardson et al, 2003). The problem however lies more with the managers that use in their reporting the so- called accruals; the difference between cash flow and reported earnings, and thus give a representation that does not reflect the true earnings numbers.
independence of audit committees, which are created with a
subset of directors on the board with the primary responsibil-
ity of monitoring. The financial reporting process of a firm are
found to constrain earnings management.
As Healy and Wahlen (1999, p. 370) explain, “despite the
popular wisdom that earnings management exists, it has been
remarkably difficult for researchers to convincingly docu-
ment it. This problem arises primarily because in order to
identify whether earnings have been managed, researchers
first have to estimate earnings before the effects of earnings
management”.
In other words, researchers need to distinguish a portion of
the earnings from natural causes from the portion attributable
to management of earnings activities. Research designs in
prior literature on management of earnings more generally
can be summarized into three approaches: (a) time series (b)
cross-sectional (c) cross-country and mix of these two ap-
proaches (b and c).
Teoh et al, (1998), use in the time-series approach, the pre-
Initial Public Offering (IPO) financial statements included in
the prospectus as a benchmark to compare with IPO year
numbers. 1 (Ball and Shivakumer, 2005) use the cross-sectional
approach to compare the financial statements of private and
public companies in the United Kingdom (UK) The cross-
country approach is a variation of cross-sectional approach
that exploits international differences (Ball and Shavikumer,
2008).
Previous researchers categorize management of earnings into
two groups: real earnings management and accruals man-
agement. They suggest that managers are much more willing
to engage in real earnings management (i.e., affecting cash
1 Teoh et al, (1998) also provide cross-section evidence comparing IPO
firms with non-issuers
IJSER © 2013 http://www.ijser.org
International Journal of Scientific & Engineering Research, Volume 4, Issue 12, December-2013
ISSN 2229-5518
2111
flow) than accruals management through changes by man- agement in estimates and accounting policies (Graham et al.
2005). They suggest 80% would decrease discretionary spend- ing, 55% would delay a project, compared with only 28% who would draw down reserves and 8% who would change ac- counting assumptions. Consequently, survey evidence in Graham et al. (2005) appears inconsistent with the higher cost of real earnings management.
Estimates of managed (discretionary) and non-discretionary (unmanaged ) accruals are compared for the models to check for better fit and then their capacity to detect management of earnings is assessed with samples where management of earnings is expected (Garza-Gómez, 2006)
The fact that the evidence on the willingness of managers to engage in management of earnings is more difficult to detect further undermines the conclusions in Ball and Shavikumer (2008). For their sample of IPO firms, only accruals manage- ment can be identified, and any real earnings management is excluded from the analysis.
Bartov et al. (2005) also examine and compare the value rele-
vance of earnings based US GAAP, IAS and German GAAP.
They, on the other hand, find that IAS earnings are more val-
ue relevant than those based on German GAAP. The differ-
ence in the results of these two studies may be found in that
same under all sets of standards. Considering solely the re- sults of the qualitative studies that compared the number of accounting choices under certain accounting frameworks, one could assume that IFRS earnings should outperform both German GAAP earnings in terms of earnings quality. IFRS earnings should be less managed than German GAAP earn- ings. However, the choices provided under two accounting frameworks do not overlap completely: German GAAP, which provides the highest latitude, does not include for in- stance all the choices provided by IFRS. It is also difficult to assess the specific costs of using an earnings management instrument. Accounting choices unique to an accounting framework may, for example, be used to a high extent due to its comparatively low costs. This study contributes to current research in several ways:
It introduces discretionary accruals model, which captures the relation between cash flows, Net income and accruals better than previous models. It provides evidence that the Jones’ (1991) model considers accruals as discretionary. It provides international evidence on the relevance of accruals accounting in an important market such as German stock market, allowing comparison to previous reports in Europe. The importance of the study stems from being a serious at- tempt to find out the nature of the relationship between
IJSER
Bartov et al. (2005) exclude loss-firm observations in their
estimations while these are included in the Hung Subraman-
yam (2007) study.
Jermakowicz et al. (2007) examine German companies’ adop-
tion of IFRS and US GAAP over the period 1995 to 2004. Spe-
cifically, they investigate the usefulness, proxied as value
relevance, before and after the adoption of these GAAPs and
the perceived benefits and costs related to the process of im-
plementing IFRS among the DAX-30 companies. They find a
significant increase in the value relevance of earnings after
the adoption of these GAAPs. They also find that the key
challenges related to the adoption of IFRS are the complexity
of IFRS, the costs involved, and the lack of implementation
guidance.
The challenges related to the adoption of IFRS documented
by Jermakowicz et al. (2007). Christensen et al. (2007) investi-
gate the change in management of earnings and timely loss
recognition among German firms that voluntarily adopt IFRS
and those who wait until the adoption of IFRS is mandatory.
They find that companies that voluntarily adopt are less
prone to management of earnings and recognize losses more
timely compared to those that resist and wait until the adop-
tion of IFRS becomes mandatory. They interpret their find-
ings as a sign of how certain companies (i.e. insider-oriented
companies) have less incentive to adopt IFRS since they will
not benefit and the challenges involved are considerable.
Finally, Barth et al. (2008) also study IAS adopters from a
number of countries, where of Germany is one of the coun-
tries with greatest representation in the sample. They find
that firms that adopt IAS are less prone to engage in earnings
smoothing and recognize losses more timely.
I predict that earnings of German companies that report un-
der, IFRS or German GAAP do not have the same properties.
The magnitude of management of earnings will not be the
management of earnings and stock return in German listed
companies. What's more, this research provides evidence
that the transition to IFRS had an impact on the use of man-
agement of earnings.
3. DATA AND SOURCES
The full sample in this paper concerns a period of 16 years (1994-2010)2. The data spans the years 1992 to 2010 to cover the sample period of 1994-2008. This involves 1448 German annual reports. Of all these companies, the necessary data is available through the data stream of Thomson one banker. Companies listed in the above mentioned are very appealing for my research purposes as they are using different account- ing standards but still operating in the German capital mar- ket. The choice of this period is particular to the stages of transition in corporate financial reporting. Many German listed companies started to report consolidated earnings un- der established international rather than domestic rules to improve their appeal to international investors.
From this initial sample, I exclude all financial firms because
(a) their financial reporting environment differs from those of
2
Banks and other financial institutions are, however, often excluded from
management of earnings research since their characteristics differ fun- damentally from other firms (Peasnell, Pope and Young, 2000).
In accordance with other empirical research in this area, all companies with the SIC codes 6000 up to 6799 (i.e. banks, insurance companies and financial firms) are eliminated from the sample. This is due to the fact that the balance sheet structures of these firms are fundamentally differ- ent to those of non-financial firms and would not allow for comparison. Furthermore, all those firm years are eliminated, for which Worldscope does not provide data about net income and/or total-assets.
IJSER © 2013 http://www.ijser.org
International Journal of Scientific & Engineering Research, Volume 4, Issue 12, December-2013
ISSN 2229-5518
2112
industrial firms and (b) they have fundamentally different accrual processes that are not captured very well by our ex- pectations models of normal accrual activity.
The sample will be started covering the period before and after 2005 because a new regulation has come into force in
2005. It was decided that from 2005 onwards extra obligations have to be included in annual reports, which makes it impos- sible to manage earnings in a similar manner as before. The new regulation creates an increased transparency in annual reports. In view of this research, there is hence no use in us- ing a qualitative method. One way of looking at quantitative methods is as a collection of techniques for organising, pre- senting, summarising, communicating and drawing conclu- sions from data, so that becomes informative (Morris, 2008). The original sample consists of 1850 firm years during 1994-
2010. All the financial institutions and observations where one or more of the variables such as stock return, accruals and net income are missing, are deleted, which results in a loss of 637 listed companies. Cases with extreme outliers in cash flow operating (CFO), net income (NI), total accruals (ACCR) and stock returns are deleted (values above +1 and below –1). This results in a further loss of 219 listed compa- nies reducing the final sample to 1443 firm’s years. Data is collected from the DataStream. Accruals are computed as
4.1.1 THE JONES MODEL
Jones (1991) relaxes the previous assumptions that the differ- ence between current and prior year accruals is due solely to changes in discretionary accruals because non-discretionary accruals are assumed to be constant from period to period. She uses, therefore, the following expectations model for total accruals to control changes in the economic circumstances of the firm:
ACCR t = α1 (1/A t-1 ) + α2 (∆REV t ) + α3 (PPE t ) + ν t eq (1) Where:
∆REV t = revenue in year t less revenue in year t-1scaled by total asset at t-1
PPEtm = gross property plant and equipment in year scaled by total asst at t-1
A t-1 = total asset at t-1 and
α1, α2, α3 = firm-specific parameters
ν t = the error term
She estimates non-discretionary accruals from the above
model as:
NDA t =α1 (1/At-1 )+α2 (∆REVt )+α3 (PPEt ) eq(2)
Dechow, et al record that an implicit assumption in the Jones
model is that revenue is non-discretionary. If earnings are
managed through discretionary revenue, then the Jones mod-
IJSER
ACCR = (∆CA - ∆CL - ∆LIQ + ∆STD – DEPR) / lagged total
assets
Research findings suggest either that the choice of accrual
model should depend on the predicted form of management
of earnings activity (e.g., revenue-based or expense-based), or
that the use of several models in combination may offer the
best opportunity of detecting accrual management, the specif-
ic form of which is unpredictable.
4. EVIDENCE OF MANAGEMENT OF EARNINGS
4.1 MEASURING OF MANAGEMENT OF EARNINGS
Discretionary accruals are used as the proxy for earnings management (Jones, 1991). The discretionary portion of total accruals is used in this study to capture management of earn- ings rather than the discretionary portion of a single accrual because total accruals should capture a larger portion of managers' manipulation (Jones, 1991).
I relay on the estimates from Jones Model, Modified Jones Model, Modified Jones Cash Flow Model and Modified Jones net income model to obtain discretionary accruals for a given firm. I show the evolvement of different models and why the Modified Jones net income model is superior in con- trolling firm to separate accruals to discretionary and non- discretionary earnings components. Additionally I use all these combinations of accounting items to detect manage- ment of earnings. Therefore, I use the methodology based on aggregate accruals. This increases the change to find man- agement of earnings and secondly this increases the range in which I can make conclusions. All variables are defined in Figur 3.
el will remove part of the managed earnings from discretion- ary accrual proxy.
An OLS regression of total accruals is regressed on the change in sales and gross property, plant and equipment. Coeffi- cients α1, α2, α3 are industry-year specific parameters and discretionary accruals are estimated as the residual from the Jones model. All variables are deflated by beginning year to- tal assets to control for heteroscedasticity. Since all the varia- bles are deflated by lagged total assets, the magnitude of a firm’s discretionary accruals is indicated as a percentage of the total assets of a firm. There are two methods in computing total accruals, the balance sheet approach versus the cash flow statement approach. To analyse data prior to 1988, the balance sheet approach is necessary as cash flow information is not available (Sloan, 1996). From 1988, firms were required to report cash flow from operations. Hence, total accruals are avoids the substantial errors that the balance sheet approach has in accrual estimation. Therefore, this study computes to- tal accruals from cash flow statements as TAit =(Eit- CFit) / Ait where TAit is total accruals for firm i in year t; Eit is net in- come before extraordinary items for firm i in year t; CFit is cash flows from operating activities for firm i in year t and all variables are deflated by lagged total assets Ait-1. able to be calculated directly from cash flow statements, as the differ- ence between earnings and operating cash flows. Hribar and Collins (2002) suggested that the direct cash flow approach avoids the substantial errors that the balance sheet approach has in accrual estimation.
IJSER © 2013 http://www.ijser.org
International Journal of Scientific & Engineering Research, Volume 4, Issue 12, December-2013
ISSN 2229-5518
2113
4.1.2 THE MODIFIED JONES MODEL
The modification is designed to eliminate the assumption tendency of the Jones model to measure discretionary accru- als with error when discretion is used over revenues. The modified Jones model estimates non-discretionary accruals (NDAC) as:
NDAC t = α1 (1/A t-1 ) + α2 (∆REVt - ∆REC t ) + α3 (PPE t ) eq
(3) Where:
∆REC t = net receivables in year t less receivables in year t-1
scaled by total assets at year t 1.
The only difference with the original Jones model is that the
change in revenue is adjusted for the change in receivables in
the period where systematic management of earnings is hy-
pothesized. The modified Jones model implicitly assumes
that all changes in credit sales, in this period, result from
management of earnings. It is easier according to Dechow to
manage earnings by exercising discretion over the recognition
of revenue on credit sales than on cash sales.
4.1.3 CASH FLOW MODIFIED JONES MODEL
McNichols and Wilson (1988) found that discretionary accru- als are negatively associated with operating cash flows. In order to control the effect of operating cash flows, this study
Where: NI_LTA = Net Operating Income
4.2 ANALYSING MAGNITUDE OF MANAGEMENT OF EARNINGS
The role of accruals proposed in Dechow (1994), is working capital accruals, while the dependent variable in my regres- sions is total accruals. However, the Dechow and Dichev (2002) model was developed to explain working capital ac- cruals, and their empirical results are based on working capi- tal accruals. As McNichols (2002) points out, their model may offer a noisy specification for total accruals.
This section will first look at the mean, median, minimum, maximum, and standard deviation of the total accruals and its components and then to the earnings and its components.
Table 1 shows Skewness as indicator in distribution analysis as a sign of asymmetry and deviation from a normal distribu- tion. Normal distributions produce a Skewness statistic of about zero. So a Skewness statistic of 0.322 and 0.523 would be an acceptable Skewness value for a normally distributed set of test scores because it is very close to zero and is proba- bly just a chance fluctuation from zero. As the Skewness sta- tistic departs further from zero, a positive value indicates the possibility of a positively skewed distribution (that is, with
IJSER
then estimates discretionary accruals by using the following
variation of the Modified Jones model with an additional var-
iable, the change of operating cash flows, ΔCFit, which is con-
sistent with Kasznik (1999). ΔCFit is the change in operating
cash flows for firm i between year t-1 and t; other variables
are defined as the Modified Jones model.
Cash Flow Modified Jones model (Kasznik, 1999)
TA it / A it -1 = b1 ( 1/ Ait-1 ) +b2 (∆REVit / Ait -∆AR / Ait-1 )+ b3
(PPE it / Ait-1 )+ b4 (∆CFit ) + ε it eq (4)
4.1.4 NET OPERATING INCOME MODIFIED JONES MODEL
Cash Flow Modified Jones model is attempt to control cash flow performance, however, researcher also found that the measurement error in estimation of discretionary accruals is correlated with firm extreme earnings performances—firms with low (high) earnings tend to have negative (positive) dis- cretionary accruals (Dechow et al., 1995). In order to control the effect of net operating income, this study then estimates discretionary accruals by using the following variation of the Modified Jones model with an additional variable, the change of net operating income, NI_LTAit. In the spirit of Kasznik (1999), I also apply this technique to control the effect of earn- ings performance. NI_LTAit is the change in net operating income for firm i between year t-1 and t; other variables are defined as the Modified Jones model. NI_LTA is often viewed as a good measure of company performance. Some believe this figure is less susceptible than other figures to manipula- tion by management.
The following formula will be using to calculate the effect of net operating income on discretionary accruals
Net Operating Income Modified Jones Model:
TA it / A it -1 = b1 (1/ Ait-1 ) +b2 (∆REVit / Ait -∆AR / Ait-1 ) + b3 (PPE
it / Ait-1 ) + b4 (NI_LTA)+ ε it eq. (5)
scores bunched up on the low end of the score scale) or a
negative value indicates the possibility of a negatively
skewed distribution (that is, with scores bunched up on the
high end of the scale). Values of 2 standard errors of Skew-
ness (ses) or more (regardless of sign) are probably skewed to
a significant degree.
The ses can be estimated roughly using the following formula:
and calculate a Skewness statistic. An approximate estimate
of the ses for German companies test would be for:


= 1433 = 0.0647
From the above, twice the Std. Error of Skewness is 2 X 0.0647
= 0.1294. It knows look at the range from -0.1294 to + 0.1294
and check whether the value for Skewness falls within this
range. If it does it can consider the distribution to be approx-
imately normal. If it doesn't, it concludes that the distribution
is significantly non-normal and in this case is significantly
positively skewed. If the sign of the Skewness statistic is neg-
ative, it means that the distribution is negatively skewed. Al-
ternatively, if the Skewness statistic had been positive, it
means that the distribution was positively skewed. For our
data would be that the skew statistic might fall within the
range between, -0.1294 to + 0.1294 for German listed compa-
nies in which case, it means that the Skewness was within the
expected range of chance fluctuations in that statistic, which
would further indicate a distribution with no significant
Skewness problem.
Kurtosis: Another descriptive statistic that can be derived to
describe a distribution is called kurtosis. It refers to the rela-
tive concentration of scores in the center, the upper and lower
ends (tails), and the shoulders of a distribution (see Brown,
1996, pp. 138-142).
IJSER © 2013 http://www.ijser.org
International Journal of Scientific & Engineering Research, Volume 4, Issue 12, December-2013
ISSN 2229-5518
2114
A distribution is platykurtic if it is flatter than the correspond- ing normal curve and leptokurtic if it is more peaked than the normal curve.
The same numerical process can be used to check if the kurto- sis is significantly non normal. A normal distribution will have Kurtosis value of zero. So again it constructs a range of "normality" by multiplying the Std. Error of Kurtosis by 2 and going from minus that value to plus that value. Here 2 X
0.1294 =0.2588 for German listed companies and it can be con- sidering the range from -0.2588 to + 0.2588 and check if the value for Kurtosis falls within this range. The kurtosis, which would further indicate a distribution with no significant kur- tosis problem.
Further Explanation
Panel A, B and C of table 1 shows total accruals, its compo-
nents and independent variables in the regression model of
accruals respectively. Panel A of this table shows that total
accruals are negative on average (- 0. 0428 for listed compa-
nies). It means that operating cash flows are greater than net
income and an amount is subtracted from the cash flows to
get net income.
Panel B of these tables show components of accruals (working
capital). Looking at those tables it observes that current assets
(CA_LTA), current liabilities (CL_LTA) and depreciations
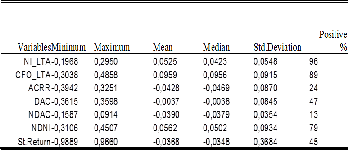
be observed that 4% of German listed companies are showing negative income, possibly upgrading earnings. These evi- dences are based on the fact that the variations in non- discretionary accruals are smaller than the variation in the discretionary accruals, which provides a reliable base to reach this conclusion. Therefore, the discretionary accrual is a sig- nificant variable in explaining the difference.
The descriptive statistics therefore, indicate that it is possible that earnings have been managed more or less in Germany.
It is observed that the degree of management of earnings higher in the German listed companies. It can be explained that Germany is one of the code law countries where the ac- counting standards give greater discretion to managers in deciding when economic gains and losses are incorporated in accounting income (Ball et al, 2000)
McNichols and Wilson (1988) found that discretionary accru- als are negatively associated with operating cash flows. In order to control the effect of operating cash flows, this study then estimates discretionary accruals by using the following variation of the Modified Jones model with an additional var- iable, the change of operating cash flows, ΔCFO, which is consistent with Kasznik (1999). ΔCFO is the change in operat- ing cash flows for firm i between year t-1 and t; other varia- bles are defined as the Modified Jones model.
IJSER
(DEP_LTA) are on average greater than the rest of the com-
ponents (0. 0611, 0. 0372 & 0. 0656 for listed companies). It is
observable that some variables have values larger than one.
This is possible as a result of the fact that the scaling is to
lagged total assets not to total assets of the current years.
Panel C of the tables display the independent variables used
to estimate non-discretionary accruals. The plant property
and equipment (PPE) is taken as net plant, property and
equipment. However, the gross amount of PPE explains bet-
ter the depreciation components of accruals, because it is a
better indicator of the level of expected depreciation. Unfor-
tunately the data on gross PPE was not available on the
DataStream and it was beyond the scope of this research to
manually gather this information from the firms’ annual re-
ports.
A Pearson correlation in Table 2 was run for listed companies
to determine the relationship between predicted variables.
The data showed no violation of normality, linearity or ho-
moscedasticity. There is a significant, positive correlation be-
tween accruals and its components, R2 =0.999 and Adjusted
R2=0.967, Std.Error =0.0033, Durbin-Watson= 1.722, which was
statistically significant at the 0.01 and 0.05 levels (2-talid).
Table 3 reports descriptive statistics on earnings and its com-
ponents in German listed companies. Net income is positive
in over 90% of the samples, and cash flows from operations
are positive in over 86% of the samples. Mean and median of
discretionary accruals are close to zero. It is observed that
discretionary accruals are more variable than the non-
discretionary accruals and both are less variable than the total
accruals.
Bases on the table it can be noted that cash flow from opera-
tion is negative by 11% of the sample in the listed companies.
However a lesser percentage of the sample firms display neg-
ative income of the sample in German listed companies. It can
Cash Flow Modified Jones model (Kasznik, 1999)
TA it / A it -1 = b1 ( 1/ Ait-1 )+b2 ( (∆REVit / Ait -∆AR / Ait-1 )+ b3
(PPE it / Ait-1 ) +b4 (∆CFO ) + ε it
After obtaining discretionary accruals from the Jones model,
the Modified Jones model and the Cash flow Modified Jones
model respectively, this study further examines whether
these discretionary accrual estimates are correlated with earn-
ings performance. This study then estimates discretionary
accruals by using an additional variable, the change in net
operating income NL-Lta, which is consistent with Kasznik
(1999). NL-Lta is the change in operating net income for firm i
between year t-1 and t, other variables are defined as the Modi-
fied Jones model. More details will be explained in table 4.
Net operating income Modified Jones Model
TA it / A it -1 = b1 (1/ Ait-1 ) +b2 ( (∆REVit / Ait -∆AR / Ait-1 ) + b3
(PPE it / Ait-1 ) + b4 (NI_LTA) + ε it
Where: NI_LTA = Net operating income
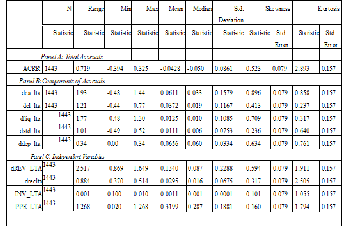
Table 4 reports summary statistics for German listed compa-
nies for cross-sectional ordinary least squares (OLS) regres-
sions based on the Jones model, the Modified Jones Model,
the Cash Flow Modified Jones Model, and the Net operating
income Modified Jones Model. Discretionary accruals are es-
timated as residuals from these four models. Each of the four
models is estimated cross sectionally from 1994 to 2003. So,
the mean (median) coefficient estimates are the average val-
ues for 1443 firm-year pairs, for German respectively. Mean
(median) coefficients are in the line with t-statistics (Wilcoxon
z-scores) and p-values. One sample t-test and Wilcoxon signed
rank test are applied to test whether mean and median coeffi-
cients are significantly different from zero. In concept, the
predicted sign of the change in sales (ΔREV) usually is am-
biguous. A given change in sales can associate with either
IJSER © 2013 http://www.ijser.org
International Journal of Scientific & Engineering Research, Volume 4, Issue 12, December-2013
ISSN 2229-5518
2115
income-increasing accruals or income-decreasing accruals, depending on the relative change of current assets and cur- rent liabilities associated with operations.
Property, plant, and equipment (PPE) should have a negative relationship with total accruals since the level of property, plant and equipment is linked to the income-decreasing ac- cruals such as depreciation, depletion and amortization (Jones, 1991).
For the Jones Model, both mean and median coefficient esti- mates on ∆REV are positive, and 64.68% of the coefficient es- timates are positive, respectively for listed companies. The Wilcoxon signed rank test shows that the median coefficient on ∆REV is significant different from zero at 5% level. The mean and median coefficients on PPE are significantly nega- tive at less than 1% level under both the t-test and the Wilcox- on signed rank test, further, 74.49% of the coefficient estimates are negative (which is equivalent to 25.06% positive). For the Modified Jones Model, the sign on (∆REV ∆AR) is unclear. Both mean and median coefficients are negative and insignif- icantly different from zero. Dechow et al. (1995) argued that it is easier for managers to exercise discretion over credit sales than cash sales. So, they modified the original Jones model by removing all the credit sales from revenue.
This result is consistent with the result which earlier has been achieved from the descriptive statistics, tables 3 which implic- itly showed that earnings have been managed in Germany. Discretionary accruals can be used to either increase or de- crease earnings. Positive discretionary accruals suggest in- come-increasing earnings management while negative discre- tionary accruals suggest income-decreasing earnings man- agement.
Table 5 reports the summery of regression analysis of inde- pendent variables and dependent variable. Table 5 indicates multi-regressions which are applied to test whether inde- pendents variables such as NI_LTA, PPE_, DREC, DREV, OCF_LTA, ACC, have relationship with or effect on depend- ent variable Stock return Sq-str. The analysis implies that the relationship between the two variables strong significant at less than 1%. It appears from the determination coefficient factor R-Square a strong relationship between these variables, where this factor showed that the independent variables can be explained 97.70% from changes in the dependent variable (stock returns) for listed companies. Therefore, it can be con- cluded that there is a significant relationship between earn- ings components (Management of earnings) and stock re- turns.
IJSER
This model implicitly assumes that all changes in credit sales
result from management of earnings, however, the uncertain
and insignificant coefficient sign indicates that in a German
context, management of earnings activities may be carried out
through accounts other than credit sales. For the Cash Flow
Modified Jones Model, Kasznik (1999) included the change in
operating cash flows in the Modified Jones Model to control
the effect of operating cash flows. This modification seems to
improve the accrual estimation. Both mean and median coef-
ficient estimates on (ΔREV−ΔAR) are positive; 64.76% of the
coefficient estimates being positive. Moreover, the t-test and
the Wilcoxon signed rank test show that both mean and medi-
an coefficients are significantly different from zero at less
than 1% level. The mean and median coefficients on PPE are
significantly negative at less than 1% level with 73.35 % of the
coefficient estimates being negative (which is equivalent to
26.65 % positive). The mean and median coefficients on ΔCFO
are significantly negative at less than 1% level, with 79.98% of
the coefficients being negative, which it means only 20.10% of
the coefficient estimates are positive for listed companies.
This is consistent with the estimation that a change in cash
flow from operations is negatively correlated with total ac-
cruals (Dechow et al., 1995, Kasznik, 1999 and Shuto, 2007).
Comparing these four models, the mean adjusted R-square
for the Jones Model and the Modified Jones Model are very
close, for 46.10 % and 56.90% respectively. While the mean
adjusted R-square for the Cash Flow Modified Jones Model
and Net operating income Modified Jones Model are 48.50%,
59.20% respectively, explaining more of the variation in total
accruals than the Jones and the Modified Jones Model. There-
fore, the Cash Flow Modified Jones from Kasznik (1999) and
estimated Net operating income Modified Jones from this
research are more reliable in estimating discretionary accruals
and with higher explanatory power.
4.3 DEMONSTRATION THE EFFECT OF ACCOUNTING STAND
ARDS ON MANAGEMENT OF EARNINGS
Demonstration effects are effects on the behaviour of deter- mined variables caused by observation of the actions of inde- pendent variables and their consequences.
Table 6 provides estimated magnitudes statistics of discre- tionary accruals that are estimated from Jones Model, Modi- fied Jones Model, Cash Flow Modified Jones Model and Net operating income Modified Jones Model. Both signed and absolute values of discretionary accruals are reported. All variables are defined in Figure1.
Table 6 presents the overall level of management of earnings before adoption of IFRS that estimated from Jones Model, Modified Jones Model, Cash Flow Modified Jones Model and Net income Modified Jones Model. For the Jones Model, the overall magnitude of management of earnings is measured by the absolute value of discretionary accruals as a percentage of beginning total assets, Abs DA_J. In general, the average level of management of earnings activity is 0.1508, indicating the average level of management of earnings that occurred among German companies is approximately around 16 % of total assets which is relatively significant. The Modified Jones Model displays very similar result as that of the Jones Model. The mean (median) total absolute value of discretionary ac- cruals, Abs DA _JM, shows the average level of management of earnings activity respectively to be 0.1615 (0.0830) which is around 16 % of total assets. For the Cash flow Modified Jones model, the mean (median) total absolute value of discretion- ary accruals, Abs_DACF, is 0.1623 (0.0797). The mean (medi- an) total absolute value of discretionary accruals of Net in- come Modified Jones model, Abs_DANIMJ, is 0.1531 (0.0707) for listed companies. This average level 15% of total asset is
IJSER © 2013 http://www.ijser.org
International Journal of Scientific & Engineering Research, Volume 4, Issue 12, December-2013
ISSN 2229-5518
2116
lower than the 16% of total assets from the Jones model, the Modified Jones model and Cash flow Modified Jones Model. These indicate that Net operating income Modified Jones Model results in a lower absolute measure of discretionary accruals. It shows that the level of management of earnings has further decreased with the performance adjusted model. This average level 15% of total assets, for listed companies, is lower than the results from all previous three models. The decline in level of management of earnings suggested the measurement error in the discretionary accruals correlated with earnings performance is largely removed.
Previous research has documented management of earnings evidences across companies. In this section, management of earnings behaviour is examined across German companies. Under the null hypothesis that German listed companies do not engage in management of earnings, one should expect to see the discretionary component of accruals to be zero. This proposition is tested by examining the mean, median and proportion of discretionary accruals through total absolute value of discretionary accruals. Therefore, it can be concluded that earnings have been managed in Germany. Thus, the null hypothesis is rejected and the alternative hypothesis has been accepted, figures 1 and 2.
Table 7 demonstrates the estimated levels of management of

tion to managers in deciding when economic gains and losses are incorporated in accounting income (Ball et al, 2000).
er a- li- se in
earnings for German listedIcompaJnies after adSoption of IFRS. ER
For Jones model, the overall level of management of earnings
is measured by the absolute value of discretionary accruals as
a percentage of beginning total assets. The modified Jones
model demonstrates very similar results as that of Jones
model.
The mean (median) total absolute value of discretionary ac-
cruals of Modified Jones model, Abs_DAMJ, demonstrates the
average level of management of earnings activity for listed
companies respectively to be 0.0678 (0.0056) which are
around 7% of total assets. For the Cash Flow Modified Jones
model, the mean (median) total absolute value of discretion-
ary accruals, Abs_DACFMJ, is 0.0660 (0.0058). The mean (me-
dian) total absolute value of discretionary accruals of Net
operating income Modified Jones model, Abs_DANIMJ, is
0.0543 (0.0048). This average level, 6% of total assets, is lower
than the 7% of total assets from the Jones model, Modified
Jones model and Cash flow Modified Jones model. This
demonstrates that the Net operating income Modified Jones
model results in a low absolute measure of discretionary ac-
cruals. It demonstrates the average level of management of
earnings activities have been supplementary decreased with
the adjusted model of Net operating income Modified Jones
model. This average level, 6%, of total assets, is lower than
the results which provided by all previous three models. The
drop in level of management of earnings suggested the
measurement error in the discretionary accruals correlated
with performance is largely removed.
To summaries, as expected that the stricter regulations of
IFRS will lead to less management of earnings. It is observed
that the degree of management of earnings is comparably
higher in the German listed companies before the adoption of
IFRS. It can be explained that Germany is one of the code law
countries where the accounting standards give greater discre-
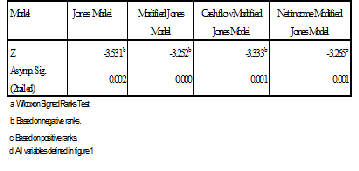
Fig. 1 Shows Ranks and significance levels of management
of earnings. Under the null hypothesis that German listed
companies do not engage in management of earnings, one
should expect to see the discretionary component of accruals
to be zero.

Fig. 2 Shows P-value which is generated from testing the null hypothesis of no management of earnings, mean DAC= zero, using a two tailed test.
IJSER © 2013 http://www.ijser.org
International Journal of Scientific & Engineering Research, Volume 4, Issue 12, December-2013
ISSN 2229-5518
2117
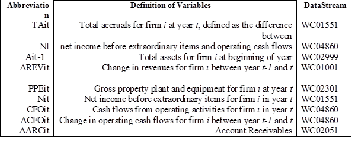
Fig. 3 presents the definition of variables
TABLE 1
TOTAL ACCRUALS AND COMPONENTS OF ACCRUALS IN ACCRUALS MODEL NORMAL DISTRIBUTION TEST & DESCRIPTIVE STATISTICS FOR GERMAN COMPANIES
TABLE 3
DESCRIPTIVE STATISTICS OF EARNINGS AND ITS COMPONENTS
The original sample consists of 1850 firm years during 1994-2010. All the financial institutions and observations where one or more of the variables such as stock return, accruals and net income are missing, are deleted, which results in a loss of 637 listed companies. Cases with extreme outli- ers in Operating cash flow (CFO), net income (NI), total accruals (ACCR) and stock returns are deleted (values above +1 and below –1). This re- sults in a further loss of 219 firm years reducing the final sample to 1443 firm’s years. Data is collected from the DataStream.
Net income (NI) is net income before extraordinary items and preferred
dividends (DataStream # W C01551). Total accruals (ACCR) are comput-
ed according to the Healy’s (1985) model as follows: ACCR = ∆ current assets (# W C02201) - ∆ current liabilities (# W C 03101) - ∆ cash & equivalent (# W C02001) + ∆ short term debt & current portion of long- term debt (# W C03051) - ∆ depreciations, depletion & amortization (# W C
01151). Cash flows operating (CFO) is computed as the difference be- tween net income (NI) and total accruals (ACCR). Discretionary accruals (DAC) are determined using the cross-sectional variation of the Jones (1991) model. Non-discretionary accruals are computed as the differ- ence between total accruals (ACCR) and discretionary accruals (DAC). Non-discretionary net income (NDNI) is the difference between net in- come (NI) and discretionary accruals (DAC). Stock return is referred to
the index of return on invested capital (ROI) as: St. Return = (ROI t – ROIt-
TABLE 2
A PEARSON CORRELATION AND A COEFFICIENT OF DETERMINATION OF W ORKING CAPITAL ACCRUALS FOR GERMAN LISTED COMPANIES

** Correlation is significant at the 0.01 level (2-tailed)
* Correlation is significant at the 0.05 level (2-tailed).
1 ) / ROIt-1. W here ROI is obtained from the Datastream item # WC08376.
TABLE 4
ESTIMATIONS OF ACCRUALS MODELS, GERMAN COMPANIES
Jones Model (Jones, 1991):
TA it / A it-1 = b1 (1/ Ait-1 ) + b 2 (∆REV it / Ait-1 ) + b3 (PPE it / A
it -1 ) + ε it
Modified Jones model (Dechow, 1995):
TA it / A it-1 = b1 (1/ A it-1 ) + b 2 (∆REV it / A it -1 - ∆AR it / A it -1 )
+ b3 (PPE it / A it-1 )+ ε it
Cash Flow Modified Jones model (Kasznik, 1999)
TA it / A it -1 = b1 ( 1/ Ait-1 ) +b 2 (∆REVit / Ait -∆AR / Ait-1 ) + b 3 (PPE it / Ait-1 ) + b4 (∆CF it ) + ε it
Net operating income Modified Jones Model
TA it / A it -1 = b1 (1/ Ait-1 ) +b2 ( (∆REVit / Ait -∆AR / Ait-1 ) + b3
(PPE it / Ait-1 ) + b4 (Nl_LTA)+ ε it
IJSER © 2013 http://www.ijser.org
International Journal of Scientific & Engineering Research, Volume 4, Issue 12, December-2013
ISSN 2229-5518
2118
To obtain meaningful estimates with the three models are estimated for German listed companies. N refers to 102 firm-year regressions associ- ated with the 1,443 firm-year observations. Mean (median) coefficients are reported with t-statistics (W ilcoxon z-scores) and p-values. Both par- ametric t test and non-parametric W ilcoxon signed rank test are applied to test whether mean and median coefficients are significantly different from zero. *, **, indicate statistical significance at the 5% and 1% respec- tively (two tailed). % Positive indicates the proportion with positive signs.
Adj-R2 is the average adjusted R-squares of 1443 industry-year pair's
regressions.
TABLE 5
MULTI-REGRESSION ANALYSIS- GERMAN LISTED COMPANIES
PANEL A
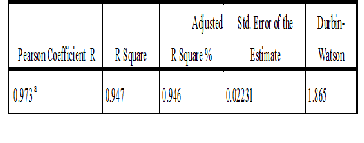
TABLE 4
ESTIMATION OF ACCRUALS MODEL
a. Predictors: (Constant), NI_LTA, PPE_, DREC, DREV, OCF_LTA, ACC
b. Dependent variable: Sq-str. Stock return
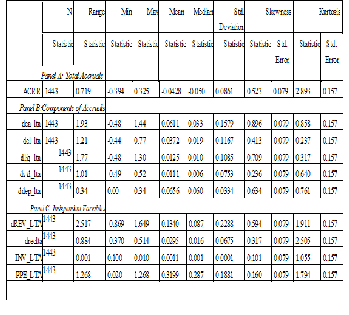
TABLE 6
ESTIMATED LEVELS OF MANAGEMENT OF EARNINGS FOR GERMAN

LISTED COMPANIES BEFORE ADOPTION OF IFRS
IJSER
TABLE 7
ESTIMATED LEVELS OF MANAGEMENT OF EARNINGS FOR GERMAN
LISTED COMPANIES AFTER ADOPTION OF IFRS
PANEL B

TABLE 4
WILCOXON SIGNED RANKS TEST STATISTICS A
5 CONCLUSION
This study detected that earnings are managed in Germany before and after adoption of IFRS. This paper examine the overall level of management of earnings before adoption of IFRS that estimated from Jones Model, Modified Jones Model, Cash Flow Modified Jones Model and Net operating income
IJSER © 2013 http://www.ijser.org
International Journal of Scientific & Engineering Research, Volume 4, Issue 12, December-2013
ISSN 2229-5518
2119
Modified Jones Model. Adjusted Net operating income Modi- fied Jones model demonstrate a low absolute measure of dis- cretionary accruals. It demonstrates the average levels of management of earnings activities have been supplementary decreased with the adjusted of Net income Modified Jones model. The drop in level of management of earnings suggest- ed the measurement error in the discretionary accruals corre- lated with performance is largely removed. I investigated the selection of listed companies of Germany, for estimating ac- cruals using both simulations and empirical tests.
In general, the average level of management of earnings be- fore the adoption of IFRS that occurred among German com- panies is approximately around 16 % of total assets which is relatively significant. And the average level of management of earnings after the adoption of IFRS that occurred among German companies is around 8% of total assets which is sig- nificant. This research detected that management of earnings has been managed is relatively stronger under German GAAP rather than IFRS. Between those two frameworks, the level of earnings management is roughly difference. These results hold for the tests using the concept of discretionary accruals and for the additional tests of earnings components. A lower level of management of earnings by adoption of IFRS indicates that IFRS relatively more effectively against man-
[7] Baker, T., D. Collins, and A. Reitenga. 2003. “Stock op tion compensation and earnings management incen tives.” Journal of accounting, auditing & finance, 557-582.
[8] Dechow and Dichev. 2002. The quality of accruals and earnings: the role of accrual estimation errors. The Ac counting Review 77 (Supplement): 35-59.
[9] Dechow, P. M., Hutton A. P., Kim J. H. 2011. “Detecting
Earnings Management: A New Approach”.
[10] Dechow, P.M. 1994. Accounting earnings and cash flows
as measures of firm performance: The rule of accounting
accruals, Journal of Accounting & economics 18, pp3-42.
[11] Dechow, P.M. and D.J. Skinner. 2000. Earnings man
agement: Reconciling the views of accounting academ
ics, practitioners and regulators, Accounting Horizon,
pp. 235-250
[12] Dechow, P.M., R. G. Sloan. 1995. Detecting earnings
management. The Accounting Review 70 (April): 193-
225.
[13] Dechow, P. M, Sloan, R. G., Sweeney, A P. 1996. Causes and consequences of earnings manipulation: an analysis of firms subject to enforcement actions by the SEC, Con temporary Accounting Research, 13,1-36.
[14] DeAngelo, L.E. 1988. Managerial competition, infor
IJSER
agement of earnings than German GAAP or IAS. Research
findings have two suggestions. First, IFRS seem to be better
performing than German GAAP when institutional factors
and economic incentives are the same. Second, supervisory
body and marketplaces may consider increasing IFRS report-
ing requirements by elements taken from IAS.
ACKNOWLEDGMENT
The author wishs to thank Latif Wahid, John Phelps, Bert de Groot, Harry Commandeur, Kees van Paridon, and Jan Hakoort for their helpful comments.
REFERENCES
[1] Barth, M.E., Landsman, W.R. and M.H. Lang. 2008. Inter- national Accounting Standards and Accounting Quality, Journal of Accounting Research, vol. 46, no.3, pp. 467-498.
[2] Ball R., Kothari, S.P. and Robin A. 2000. The effect of in ternational factors on properties of accounting earnings, Journal of Accounting and Economics, pp.1-51
[3] Bartov, E., F.A. Gul and J. Tsui, 2000. Discretionary- accruals models and audit qualifications. Journal of Ac counting and Economics, December: 421-452.
[4] Collins, D. W., and P. Hribar. 2002. “Errors in Estimating Accruals: Implications for Empirical Research.” Working Paper, University of Iowa.
[5] Morris C., .2008. Quantitative Approaches in Business Stud ies, (7th ed.). Pearson Education Limited, Edinburgh, Eng- land.
[6] Hribar, P. and D. Collins. 2002. Errors in estimating ac cruals: Implications for empirical research. Journal of Ac counti ng Research: 105-134.
mation costs, and corporate governance: The use of ac
counting performance measures in proxy contests,
Journal of Accounting and Economics 10, 3-36
[15] DeFond, M., and K. R. Subramanyam .1998. “Auditor
changes and discretionary accruals”. Journal of Account
ing & Economics 25 (1): 35-68
[16] Financial Accounting Standards Board (FASB). 1984.
Concepts Statement No. 5: Recognition and Measure
ment in Financial Statements of Business Enterprises.
Financial Accounting Standards Board, Norwalk, CT.
[17] Gassen, Joachim/Sellhorn, Thorsten .2006. Applying
IFRS in Germany – Determinants and Consequences, in:
Betriebswirtschaftliche Forschung und Praxis, Vol. 58,
Issue 4, pp. 365–386.
[18] Graham, J., Harvey, C., Rajgopal, S .2005.The economic
implications of corporate financial reporting. Journal of
Accounting and Economics 40, 3-73.
[19] Healy, P.M. .1985. The effect of bonus schemes on ac
counting choices, Journal of accounting and Econom
ics, 85-107
[20] Healey, P.M., and J.M. Wahlen.1999. Commentary: A
review of the earnings management literature and its
implications for standard setting, Accounting Horizon,
pp.365-383
[21] Hung, Mingyi/Subramanyan, K. R. 2007. Financial
Statement Effects of Adopting International Accounting
Standards: The Case of Germany, in: Review of Account
ing Studies, Vol. 12, Issue 4, pp. 623–657.
[22] Jermakowicz, Eva K./Prather-Kinsey, Jenice/Wulf, Inge
.2007. The Value
[23] Relevanc of Accounting Income Reported by DAX-30
German Companies, in: Journal of International Finan
cial Management and Accounting, Vol. 18, Issue 3,
pp. 151–191.
IJSER © 2013 http://www.ijser.org
International Journal of Scientific & Engineering Research, Volume 4, Issue 12, December-2013
ISSN 2229-5518
2120
[24] Jones, J. 1991. Earnings management during import re lief investigations, Journal of Accounting Research, pp.
193-228
[25] Kasznik, R. 1999. On the Association between Voluntary
Disclosure and Earnings Management. Journal of Ac
counting Research, 37(1), 57-81.
[26] Larcker D. F., and Richardson S. A. 2004. “Fees paid to
audit firms, accrual
[27] choices, and corporate governance”. Journal of Account
ing Research 42 (3): 625- 656
[28] McNichols, M., and P. Wilson. 1988. Evidence of earn
ings management from the provision for bad debts,
Journal of Accounting Research 26, Supplement: 1-31.
[29] McNichols and Stubben. 2008. Does Earnings Manage
ment Affect Firms’ Investment Decisions?. The Account
ing Review pp. 1571–1603
[30] McNichols. 2002. Discussion of the quality of accruals
and earnings: the role of accrual estimation errors. The
Accounting Review 77 (Supplement): 61-69.
[31] Nelson M. W., Elliott J. A., Tarpley R. L., 2003. “How are
Earnings Managed? Examples from the Auditors”. Ac
counting Horizons 17: 17-35
[32] Nelson, J.A. Elliott, and R. L. Trapley. 2002. Evidence
from auditors about managers' and auditors' earnings
management decision. The accounting review 77 (Supple
ment): 175-202
[33] Peasnell, K.V., P.F. Pope, and S. Young., 2000. ‘Detecting
earnings management using cross-sectional abnormal
accruals models’, Accounting and Business Research,
30(4): 313-326.
[34] Rangan, S. 1998. Earnings management and the perfor
mance of seasoned equity offerings. Journal of Financial
Economics, pp.101-122.
[35] Schipper, K. 1989. "Earnings management." Journal Ac
counting Horizons. 3: 91-102
[36] Shuto, A. 2007. Executive Compensation and Earnings
Management: Empirical Evidence from Japan. Journal of
International Account ing, Auditing & Taxation,
[37] Subramanyam, K.R.1996. The pricing of discretionary
accruals, Journal of Accounting and Economics, pp.
24916 (1), 1-26.-281.
[38] Teoh, S., Welch, I., Wong, T. 1998. Earnings management
and the post-issue underperformance of seasoned eq
uity offerings, Journal of Financial Economies, pp 63-100
[39] Teoh, S., Wong, T., Rao, G. 1998. Are accruals during
initial public offering opportunstic? Review of Account-
ing Studies 3, 175-208.
IJSER © 2013 http://www.ijser.org