International Journal of Scientific & Engineering Research, Volume 4, Issue 12, December-2013 1836
ISSN 2229-5518
Eboigbe, M. A. 1 Ugwuoti, A. I. 2 Dr. Uzodinma V. N.2
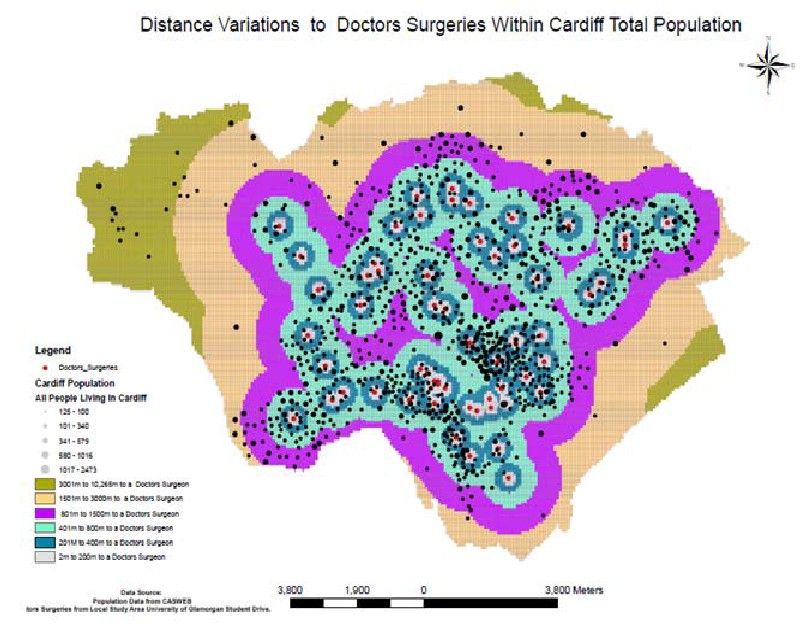
Abstract— several approaches have been used to examine the accessibility and Distance variation of health facilities in GIS. Very common is the Buffer and Kernel density. This study, gives a different approach as it used the near analysis and the Conversion toolset to evaluate the closeness of the Doctors Surgeries to all the people living in Cardiff. The “Near” analysis tool functions better on point to point feature data hence the population map is first converted from polygon to raster and to point feature using the conversion tool. This enhances Location accuracy as compared to other methods previously used for facility location. From the attribute table, the computed distances were re-categorized into six (6) groups and these groups were again converted from point to raster and back to polygons. The outcome of this study is a clear and correct presentation of how the Doctors Surgeries’ are available both in magnitude and in proximity to the total population in Cardiff. The new map is correct, simple and easily interpreted by any user. Numerical accuracy and pictorial differentiation is therefore achieved.
Cardiff is the capital city of Wales in the United Kingdom. Area is 2.568 sq miles (6.652 km²). The transportation sys- tem is quite effective with good road and rail network
grating group data in any defined range. A major ad- vantage of this analysis over the traditional multiple buff- ers is the fact that there is a well defined boundary between
IJSER
which includes the sub-urban. There are six main junctions
linking all the other roads. According to the 2001 CASWEB
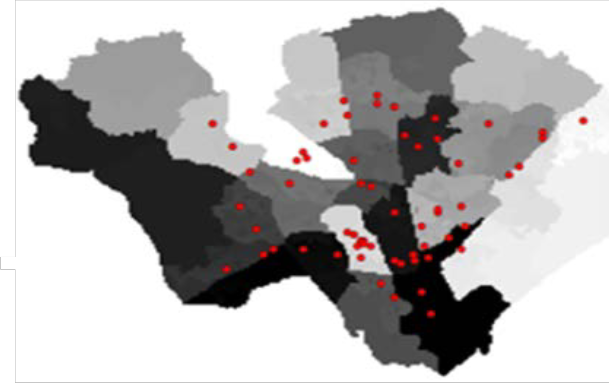
data there are about 305,353 people living in Cardiff. Of
this, only 65 Doctors Surgeries are available. Two questions
therefore arise: Are this Doctors Surgeries adequate for this
population? What is the closeness functionality in times of
emergency? Even with the effective transportation system
in the city, the availability of Doctors surgeries to the une-
venly distributed population matters so much especially
during emergencies. So many approaches have been used
to study facility location using the Arc Tool box in ArcGIS.
More importantly is the fact that many researchers have
used census data in examining the availability of health
care facilities but very little or no attention has been paid to
the “Near” analysis tool. Yang et al (2006) used the two –
step floating catchment area (2SFCA) method in integration
with the Kernel density to examine the closeness of Health
care facilities to a defined census tract boundary. The buff-
er and the kernel density were the main analysis tool
adopted. Brabyn and Skelly (2002) carried out spatial mod-
elling to estimate the time it takes for a certain geographical
location to access the nearest hospital. This study integrates
the census data but again attention was on the buffer tool
and the thiessen polygon. The Near analysis tool is an
analysis tool which has the analytical capabilities of inte-
1. Department of Surveying and Geoinformatics Edo State Institute of Technology and Management, Usen, Edo State.
2. Department of Geoinformatics and Surveying, University of Nige- ria, Enugu Campus.
Corresponding email: mitchayes@yahoo.com
classes of the variables been studied. A good GIS for public
health demand and supply must have an excellent correla-
tion between the resultant map been displayed and the in-
herent spatial attributes (Luis, 2004).
IJSER © 2013 http://www.ijser.org
International Journal of Scientific & Engineering Research, Volume 4, Issue 12, December-2013 1837
ISSN 2229-5518
differentiation.
facility in Honduras.
Most interestingly is the fact that more layers can be created using this method to show time travel to the nearest Doctor Surgery. Mere looking at the map and knowing any particular location inside it, one can easily tell the distance to the nearest Doctors Surgery and if there is a clear traffic, the travel time can also be determined as velocity = distance / time.
IJSER
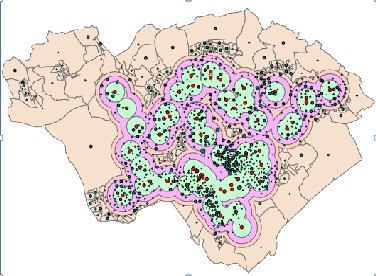
3 Discussion of Result
There are no sure limitations to this method of Facility Location. The only issue is the numerous conversions and computations involved. One other advantage of this method is a pictorial presentation of derived results. The Map is easy to interpret unlike using the multiple buffers. Apart from the fact that multiple buffers have the tendencies of shielding some details, it also has short comings in delineating between boundaries of feature classes Xiang (1993, p. 818). Black et al., (2004) also recognised the relevance of adopting methods which has both the visual and spatial capabilities of displaying multiple geographic layers. They also used population data as an input data in determining accessibility to Health care
IJSER © 2013 http://www.ijser.org
International Journal of Scientific & Engineering Research, Volume 4, Issue 12, December-2013 1838
ISSN 2229-5518
IJSER
IJSER © 2013 http://www.ijser.org
International Journal of Scientific & Engineering Research, Volume 4, Issue 12, December-2013 1839
ISSN 2229-5518
1. Black, M., Ebener, S., Aguilar, P., Vidaurre, M. and Morjani, Z. (2004) ‘Using GIS to Measure Physical Accessibility to Health Care’, World Health Organisation, pp. 1-22. Openurl.ac.uk [online]. Available at: http://www.who.int/kms/initiatives/Ebener_et_al_2004a.pdfn (Accessed: 2nd January, 2013).
2. Brabyn, L. and Skelly, C. (2002) ‘Modelling Population Access to New Zealand Public Hospitals’ ,International Journal of Health Geographic’s, 1(1) p. 3, Biomedical Central [online]. Available at: http://www.ij-healthgeographics.com/content/1/1/3 (Accessed: 25th December, 2012).
3. Luis, R. (2004) ‘Spatial access to health care in Costa Rica and its equity: a GIS-based study’, Social Science & Medicine 58, 1271-
1284 [online]. Available at: ccp.ucr.ac.cr/bvp/pdf/Salud/Rosero- SocSc58-7.pdf (Accessed: 10th October, 2013)
4. Xiang, W. (1993) ‘Application of a GIS – Based Stream Buffer Generation Model to Environmental Policy Evaluation’, Environmental Management, 17(6) pp. 817- 827. Springerlink [online]. Available at http://link.springer.com/article/10.1007%2FBF02393902?LI=true (Accessed: 5th January 2013).
5. Yang, D., Goerge,R. and Mullner, R. (2006) ‘Comparing GIS-Based
Methods of Measuring Spatial Accessibility to Health Services’,
In the Arc tool box are numerous analysis and statistical![]()
tool Sets. The results of which are often presented as maps![]()
and charts. A good map should therefore be simple enough
to depict the subject matter irrespective of the operators
employed. The obtained map of this study is an easily un-
derstood and at the same time a detailed presentation of
some complex operators used to explain how viable and
assessable the doctor’s Surgeries within the entire popula-
tion tract are in a developed society. The outcome of this
study as presented on the map is that the doctor’s surgeries
are actually relative to areas of high population but not
evenly distributed to the entire population tract. This might
not be too favourable especially during emergencies.
Journal of Medical Services, 30(1) pp. 23-32. Springerlink [online]. Available at: http://www.chapinhall.org/research/report/comparing- gis-based-methods-measuring-spatial-accessibility-health-services (Accessed: 30th December, 2012).
IJSER © 2013 http://www.ijser.org