The sensitive areas that are filled with the de n si t y of hotspot crime events in the study of the one year crime recorded data may revise significantly in the o n e month data o r o n d a y -to-day crime data.
International Journal of Scientific & Engineering Research Volume 4, Issue 1, January-2013 1
ISSN 2229-5518
The use of GIS to grasp spatial and temporal patterns of crime offenses has become additional prevalent in recent years;
GIS makes possible to optimize effectiveness within the reduction of crime and to extend the security of residents. Vital method offered through GIS is that the identification of crime hotspots, or crime locations with a high crime rate. The identification of crime hotspots in time might even time might even be awfully important; make possible in higher understanding of crime pattern build a criminal offence reduction display and conceding the strategic deployment of resources naturally and places after they will make the best distinction. Spatial-Temporal crime analysis plays a fundamental role in lots of security related crime forecasting applications. This research carried out to inquire into and c a l c u l a t e the efficiency of connecting spatial and temporal crime f a c t o r s for repeated events in particular high density crime area. To exhibit the application of crime forecasting, this approach can be a practical analysis alternative in forecasting security informatics. In this paper used Tamil Nadu areas in India as a case study.
1. Introduction
It is often supportive to look at how spatial patterns of crime events change over a particular Space - Time component. In Space-time interactions by considering how movement patterns were constrained by time in conjunction with spatial constraints. This point to geography approach, [1] has proposed “that temporal constraints, in conjunction with the locations of offending nodes, are a serious determinant in spatial-temporal patterns of property crime”. The outcomes of such research analyses will give helpful information to guide the criminal activities expected at preventing, identifying, and reacting to crime problems. Understandable high crime hotspot areas have long been acknowledged based on location, however with changes within the approach urban residents live and work; time related temporal part becomes more necessary.![]()
The sensitive areas that are filled with the de n si t y of hotspot crime events in the study of the one year crime recorded data may revise significantly in the o n e month data o r o n d a y -to-day crime data.
1 Assistant Professor (Sr)
K.S.R.College of Engineering, Tiruchengode, India. Vij370@gmail.com
2 DEAN
SNS College of Technology, Coimbatore, India.
3 Assistant Professor
K.S.R.College of Engineering, Tiruchengode, India.
The sensitive areas that are filled with the de n si t y of hotspot crime events in the study of the one year crime recorded data may revise significantly in the o n e month data o r o n d a y -to-day crime data. In recent times, GIS has been extensively used for sustaining dynamic geographic model building and analysis in many geographically connected fields, like ecology, urban designing, and hydrology addressed the role of GIS in exploring space-time processes as a platform, a controlled surroundings or laboratory that stressed its capability in visualizing and knowledge managing, [2] building crime analysis modeling into GIS directly , by showing GIS-based simulation as a sort of map dynamics that are formulated as a map equation.
This type of analysis will facilitate Police
department for higher ready to either cut back the intensity of the hotspot or be able to a lot of quickly mobilize officers to handle the increased crime rate. In this study, knowledge of the Tamil Nadu Police Department is used to demonstrate a process to identify high density crime hotspot, and apply the crime forecasting techniques to find the criminal behavior.
The objective of this research is to explore a combined approach of the spatial and temporal patterns of particular crimes and discuss the interpretation of the Spatial- temporal crime forecasting simulations, through analyzing data from the Chennai City Police, from January 2008 to
IJSER © 2013 http://www.ijser.org
International Journal of Scientific & Engineering Research Volume 4, Issue 1, January-2013 2
ISSN 2229-5518
December 2008.And to demonstrate the application of crime forecasting simulations in GIS to problems in criminology.
This research used G I S t o e x pl or e s p a t i a l
patterns of the particular crime event.
Explores a combined approach of the forecasting simulations and spatial-temporal patterns of particular crime event.
Discuss the explanation of the Spatial-
Temporal crime forecasting simulation results.
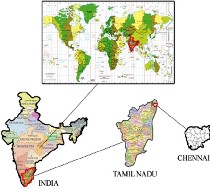
F i g : 1 . 1 T h e S t u d y R e g i o n
Crime data of year 2008 in the study area are used in the analysis which is illustrated in Figure 1.1. Spatial and temporal information related to these incidents were obtained from Chennai Police headquarters. Crime data were recorded by two police stations, in south Chennai and north Chennai. Data includes number, address, occurrence time, location and type. Five types of data are available, which are murder, burglary and auto related crimes and pick pocketing. However, in this study all types of crimes are aggregated to have a higher number of incidents for constructing reliable short and long term forecasting.
All crime related data employed in this research have been got from Chennai 100 Police station centers. The database records the data of case variety, occurring time, case type, occurring location and different transient description of the crime. In Chennai, there have been totally 3,706,34 crime records in 2008. Consistent with the police crime discrimination framework, these recorded crimes could be classified into 75 types. However, as several classes rarely happen here we just focus on those types that
frequently occur (e.g. murder, tried murder, wounding and assault, rape, indecent assault and theft of property, fraud burglary, pick-pocketing and stealing vehicles, electro-mobiles, motorcycles, or bikes). When eliminating unqualified information (repeating decision or incomplete and invalid records) and traffic accidents that is beyond the scope of this analysis, the full variety of remaining crime records were more than a hundred thousand.
Crimes are also known to vary with time and location. [3] They analyzed criminal behavior in space and time as spatial choice models and showed that they provided efficient and accurate predictions of future crime patterns.
Crime analysts and researchers are creating substantial progress in identifying high crime activity areas and predicting future target locations. [4] Has proposed the evident that descriptive and analytic mapping is going to be a very important part of strategic and tactical crime analysis efforts. The micro simulation model could be used to conduct policy simulations and forecasting. The simulation would entail conducting a baseline simulation using a given initial population sample and later changing either the sample characteristics or parameters within the model in order to gauge the effects of policy or structural changes.
The preliminary results of a crime forecasting model developed in collaboration with the police department of a United States city in the Northeast. At first discuss our approach to architecting datasets from original criminal records. [5] Have suggested the datasets contain aggregated counts of crime and crime- related events categorized by the police department. The location and time of these events are embedded in the data. Additional spatial and temporal features are harvested from the raw data set. Second, an ensemble of data mining classification techniques is employed to perform the crime forecasting. We analyze a variety of classification methods to determine which is best for predicting crime “hotspots”.
Exploratory knowledge Analysis lies at the core of Crime Forecasting System. [6] Has proposed the
Exploratory knowledge analysis (EDA) used to
IJSER © 2013 http://www.ijser.org
International Journal of Scientific & Engineering Research Volume 4, Issue 1, January-2013 3
ISSN 2229-5518
investigate knowledge for the aim of formulating hypotheses for value testing. The objectives of the EDA are: recommending hypotheses regarding the causes of observed phenomena and assess the assumptions made on the statistical inference on which these are mostly based. He prompts the longer term graphical analysis techniques.
In research, using simulation begins with the representation of a theory in the form of a model. To do this, [7] has proposed reality must be simplified and only the most important aspects represented in the model; all extraneous details are dropped In contrast to statistical models that are implemented as equations and solved within a software program, a simulation model is itself a software program.
As are often seen from the literature reviewed during this chapter, there is considerable proof that spatial, time characteristics are associated with crime, particularly the crime classification. Crime hotspot identification is that the major part during this analysis is reviewed during this chapter, spatial clustering in data mining give variety of techniques for identifying crime hotspots and cold spots. Arithmetic computer simulations are reviewed during this section; it gives evidence for executing a range of simulation tools for crime forecasting.
A large range of techniques is contributing for the mining of spatial databases. These techniques give results regarding spatial classification, spatial trend detection and spatial clustering. The aim of spatial data mining is to reveal unknown data. Two issues associated with clustering that have received attention in the past years include: 1. Generalization-based characterization applied to spatial information proposed in; 2. a cluster characterization primarily based on spatial options like lakes, resorts etc.
It is a rapidly evolving space of analysis that is standard in many disciplines as well as statistics (e.g., time series analysis), temporal pattern recognition, temporal databases, optimization, high-performance computing, and parallel computing. The temporal data mining element of the Knowledge Discovery in Temporal Databases method is bothered with the
algorithmic means that those temporal patterns are
extracted and counted from temporal knowledge. A comprehensive overview of the techniques is presented for the mining of temporal data. Main temporal data mining techniques that are commonly derived by either bottom-up or top-down induction are: temporal classification (basic goal is to predict temporally connected fields in an exceedingly temporal database primarily based on different fields); and temporal clustering. In temporal analysis, several temporal data mining applications create use of clustering. There are two basic approaches to temporal clustering and analyzing it. One is that the live temporal similarity approach and the other is a temporal optimal partition approach. If the amount of clusters is given, then clustering techniques will be divided into three classes: (i) Metric-distance primarily based technique, (ii) Model-based technique and (iii) Partition-based technique.
IJSER © 2013 http://www.ijser.org
International Journal of Scientific & Engineering Research Volume 4, Issue 1, January-2013 4
ISSN 2229-5518
the data preparation stage to clean the data before to be ready for the analysis.
3. The police records do not represent the accurate statistics for residential burglary.
The collected spatial crime data are used in MySQL database architecture which will have DBMiner structural design. DBMiner incorporating a number of data mining technologies arithmetic analysis and create multilevel mining rules for classifying the data attributes [8]. There are two strong reasons to select the DBMiner, JAVA and MySQL for implementing the crime forecasting.
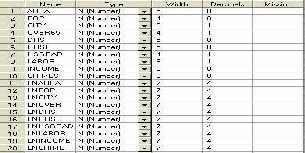
Figure 3.1 Attribute Name and Type
The data collects the spatial crime database from Table
3.1, applied the classification and set the attribute specification for all data. With the result, using the attribute type, it is going to be performed the crime forecasting operation based on computer simulations, which is used to record the week day’s crime within the hotspot maps. On a day-to-day basis, the density of present hotspot locations is compared with previous hotspot locations.
There are some problems for the crime data obtained from Chennai City Police, and this problem appeared during the data preparation stage:
1. Some fields are missing in the police records for the residential burglary data during the study period.
2. Duplication, this is other problems of residential burglary data quality that arise during the process of recording residential burglary. To
solve this problem need more efforts during
A literature study was achieved to make a decision what techniques to check for the DataDetective method. Many alternative methods were identified, each retrospective and prospective. In this retrospective method one is going to be selected as benchmark method. The foremost promising “prospective” technique is chosen as a comparison with the DataDetective method.
As benchmark a retrospective technique is going to be chosen. Together with a retrospective technique in the experiments have two advantages:
1. Retrospective techniques have easy model, which might easily be understood.
2. They are also commonly utilized by the police
and researchers, who are the target audience of this research.
3. In literature they are usually used as
benchmark further. Using a similar technique as in alternative research papers makes comparing the results of this thesis with the results of other papers easier.
Another benchmark model is that the kernel density estimation (KDE) was introduced by [9]. This model is extremely similar to the random walk, since it is also a retrospective method, which uses data from a particular time interval within the past. It is not clear what quantity of data and what time interval, is best to use. [10] Makes use of data of the last two months in their study. They used this time interval based on empirical studies.
The KDE is widely used in literature, [11] and it is additionally the standard technique used by several police forces, mainly in the Indian police force. However, during a meeting with the police, the KDE proved to be the technique mainly used by the police forces in the Tamil Nadu, which are the main users of
IJSER © 2013 http://www.ijser.org
International Journal of Scientific & Engineering Research Volume 4, Issue 1, January-2013 5
ISSN 2229-5518
the DataDetective product right now. Also it is already possible in DataDetective to execute this model, which makes making the benchmark prediction maps easier. As a result of these reasons, the KDE is chosen as benchmark technique.
Micro level simulation of crime forecasting analysis includes the common day-to-day analysis of crime by the police department: understanding police reports, identifying crime patterns in the recorded data, mapping crime hotspot points, identifying and analyzing crime hot spots, etc. The current research of crime hot spots would likely to remain police patrol targets and perchance some of the most important hot spots also require police patrolling. Also, the police department might concentrate on high crime density areas for leading indicator crimes.
F(C, R, S (z), T)
Where
C----- Crime Classes
R----- Region (or) Area
S(z)—Set of Attributes From the
Crime Objects
Ex: S(burglary, sex, Shop
Theft, Road Accidents…., Etc..) T------ Time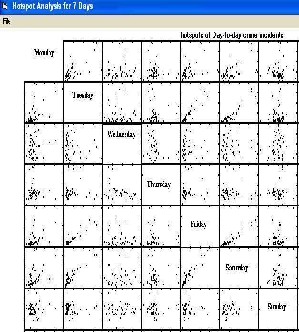
Figure 4.1: Day-to-Day Hotspot Analysis
In this study, computer simulation identifies the crime incidents and performs matrix operation. In the figure 4.1, it shows the 24X7 crime incidents are converted into 7 x 7 matrices and compares hotspot to the previous day(s) row wise or column wise.
The goal of this simulation is to find the best technique to create geographical crime forecasts and implement it in DataDetective. The KDE technique was selected as benchmark technique, because it was a very basic technique and it was used by the police to create forecasts. A computer simulation was selected as second technique. This technique works in a totally different way with selective parameters for forecasting.
[1]. Ratcliffe JH., (2006), “A temporal constraint theory to explain opportunity-based spatial offending patterns”, Journal of Research in Crime and Delinquency, Vol. 43, No. 3, pp. 261–
291.
[2]. Takeyama, M. and Couclelis, H. (1997), “Map dynamics: Integrating cellular automata and GIS through Geo- Algebra”, International Journal of Geographical Information Science, Vol. 11, Issue 1, pp. 73-91.
[3]. Richard Frank et al, (2010), “Power of Criminal Attractors: Modeling the Pull of Activity Nodes”, Journal of Artificial Societies and Social Simulation, Vol. 14, pp. 1-6.
[4]. Canter , D.V, Coffey, T., Hunt ley, M., and Missen, C. (2000), “Predicting serial killers’ home base using a decision support system”, Journal of Quantitative Criminology, Vol. 16, pp. 457-478.
[5]. Chung-Hsien Yu, Max W. Ward, Melissa Morabito,
Wei Ding, (2011), "Crime Forecasting Using Data Mining Techniques," ICDMW, pp.779-786, 2011 IEEE 11th International Conference, Vancouver, BC.
[6]. Berk, R. A., Bond, J., Lu, R., Turco, R., & Weiss, R. E., (2000), “Computer simulations as experiments: Using program evaluation tools to assess the validity of interventions in virtual worlds”, Donald Campbell’s legacy (Volume II): Contributions to research design. Newbury Park, CA: Sage
Publications.
[7]. Gilbert, N. (1999), “Multi-level simulation in Lisp- Stat”, Journal of Artificial Societies and Social Simulation, Vol.
2, NO. 1.
[8]. Hagan, F. (2000), “Research Methods in Criminal Justice and Criminology”. Boston, Allyn & Bacon Publishers, pp. 110-132.
[9]. Bailey, T. and A. Gutrell, (1995), “Interactive Spatial
Data Analysis”, New York, Wiley Publications. Reference, pp.
97-109.
[10]. Johnson, S.D., Bernasco, W., Bowers, K.J., Elffers, H., Ratcliffe, J., Rengert, G., & Townsley, M. (2008), “Space- time patterns of risk: A cross national assessment of residential burglary victimization”, Journal of Quantitative Criminology, Vol.23, pp. 201-219.
IJSER © 2013 http://www.ijser.org
International Journal of Scientific & Engineering Research Volume 4, Issue 1, January-2013 6
ISSN 2229-5518
[11]. Spencer Chainey, Lisa Thompson, Sebastian Uhlig, (2008), “The Utility of Hotspot Mapping for Predicting Spatial Patterns of Crime”, Security Journal, Palgrave Macmillan, pp. 4-28.
[12]. M.vijayakumar, Dr. C. Chandrasekar, (2011), “Spatial
Clustering Simulation on Analysis of Spatial-Temporal Crime Hotspot for Predicting Crime activities” International Journal of Computer Applications (IJCA), Vol.35, No.3, pp. 36-43.
[13]. S. Godoy‐Calderón, Hiram Calvo., The CR‐Ω+
Classification Algorithm for Spatio‐Temporal Prediction of
Criminal Activity, vol 8 No1 April 2010.
IJSER © 2013 http://www.ijser.org