stirrer at a constant speed.
Samples were taken after 5 hrs and were analysed by Total
Organic Carbon analyzer (TOC) (Phoenix 8000Laboratory ana-
=
International Journal of Scientific & Engineering Research, Volume 4, Issue 12, December-2013 274
ISSN 2229-5518
Synthesis, Characterization and Using of Nanosize Aanatase Phase TiO2 for Water Treatment
Ahmed A. Abd Elradya, Hassan M. A. Salmana and Ahmed M. Kamalb
Abstract— Nanosize anatase phase TiO 2 was prepared by the precipitation method through calcination of the resulting precipitate at 3 temperatures 450, 650 and 750 °C. The resulting TiO 2 samples characterized and used for the inactivation of fecal coliform bacteria and the removal of formic acid from water. UV-visible spectroscopy, XRD, EDX, TEM and FTIR analyses are used for the characterization of TiO 2 samples. Anatase phase was produced at all calcination temperatures. The band gab was calculated to be 3.3 eV for TiO 2 calcined
450°C and the average particle size was calculated to be 6 and 22 nm for TiO 2 calcined at 450°C and 750 °C, respectively. The prepared
TiO 2 showed high efficiency for the inactivation of fecal coliform bacteria and the removal of formic acid from water.
Index Terms— Nanosize TiO 2 , water treatment, fecal coliform bacteria, formic acid.
—————————— ——————————
IJSER
anosized TiO2 attracts attention of many researchers due to its distinct electronic and optical properties originat- ing from the quantum confinement (1, 2). This leads to
excellent features as a semiconductor and as a photocatalyst
(3, 4) and hence qualifies it to a wide range of applications (5-
7). Controlling of crystallite structure during preparation takes
a lot of attention. Antase phase TiO2 is thermodynamically metastable and can be easily transformed into the stable rutile
phase when heated to 500-600 oC resulting in the growing of crystals, decreasing of band gap, decreasing of photocatalytic activity (8) and shifting the absorption edge to longer wave lengths (red shift) (9). Band gap increase, as a result of de- creasing crystallite size, may favor redox processes because this phenomenon slows the recombination of the generated holes and electrons (8, 10). It is practically important to ex- plore methods to prepare thermally stable anatase TiO2 avoid- ing phase transformation by thermal treatment. Phase trans- formation may be governed by some factors as the particle size and shape and many methods were reported to avoid phase transformation as a result of the thermal treatment by doping TiO2 with cationic and/or anionic dopants (11, 12). However, the presence of significant amounts of doping im- purities in TiO2 may result in some changes in its properties and affecting its final applications. In this study, thermally
————————————————
• Ahmed A. Abd Elrady is Lecturer of Analytical Chemistry, Chemistry Department, Faculty of Science, South Valley University, Qena, Egypt PH-00201280823409.
• Hassan M. A. Salman is currently Professor of Inorganic Chemistry and
Vice Dean, Faculty of Science, South Valley University, Qena, Egypt PH-
00201119187839. E-mail: hsalman16@yahoo.com.
• Ahmed M. Kamal (corresponding author) is pursuing master degree pro-
gram in Chemistry in Faculty of Science, South Valley University, Qena,
Egypt PH-00201112363882. E-mail: ch_ahmedkamal@yahoo.com.
stable nanosized anatase TiO2 was prepared and used for treatment of water containing formic acid or coliform bacteria.
TiO2 nano particles were prepared by the following proce- dures: 2 ml of H2 O2 solution (a solution containing 30% wt/v) was added to 400 ml distilled water in a 500 ml Pyrex glass beaker. 5 ml of TiCl4 was added to this solution to form a yel- low color (HOO-Ti(OH)3 ) and then the solution was stirred. Mercaptoethanol was added to about 300 ml of the clear solu- tion till the disappearance of the yellow color. Ammonium hydroxide was added to this solution dropwisely for complete precipitation. The precipitate was collected by centrifugation and then was dried in an oven at 80 oC for 6 hrs. The dried precipitate was powdered in an agate mill and then was cal- cined at three different temperatures (450, 650 and 750 oC) in a muffle furnace, in air, for two hours.
2.1 Characterization
X-ray diffraction patterns were recorded at room temperature using a powder diffractometer (Bruker axs D8 Advance, Ger- many with Cu-Kα radiation source λ=1.5406Å and 2Ө in rang (10-80°). The average crystallite size of the particles was de- termined using the Scherrer equation.
EDX analysis was carried out with JSX-3222 element analyzer (include EDS detector with 149 eV) manufactured by JEOL LTD., Japan.
Particle size determination was carried out with a transmis- sion electron microscope (TEM), Jeol Jem-1230.
The Fourier Transform Infrared (FT-IR) was recorded on a
Jasco FT-IR-460 pluse, Japan.
•
IJSER © 2013 http://www.ijser.org
International Journal of Scientific & Engineering Research, Volume 4, Issue 12, December-2013 275
ISSN 2229-5518
Ultraviolet–Visible spectra were performed with a JASCO Corp., V-570 UV-Vis spectrophotometer.
The efficiency of the prepared catalysts was investigated through the removal of formic acid as a model organic pollu- tant from water. 0.4 mg of TiO2 was suspended in 400 ml of formic acid solution (~ 5 X 10⁻³ M) in a 500 ml Pyrex glass beaker. The previous solution was held under a UV lamp (VILBER-LOURMAT, λ= 360 nm) at a fixed position inside the
each one set of tests, a fraction of the test water sample was held at room temperature and the coliform bacteria were counted at the beginning and at the end of the experiment as a control test. This control test confirmed that at room tempera- ture, there is no significant change in bacterial count occurs. The results are expressed in colony-forming units (CFU) per
100 ml.
The bacteria removal percentage (disinfection or inactivation
percentage) was calculated from the following equation:
The bacteria removal percentage
Initial bact. count - Final bact. count
UV chamber and the solution was stirred using a magnetic
stirrer at a constant speed.
Samples were taken after 5 hrs and were analysed by Total
Organic Carbon analyzer (TOC) (Phoenix 8000Laboratory ana-![]()
=
Initial bact. count
×100
lyzer using sodium persulfate in combination with UV light to oxidize organic material) and then formic acid removal per- centage (degradation rate) was calculated from the following equation:
Formic acid removal percentage
The XRD patterns of dried precipitate before calcinations showed amorphous product. The XRD patterns of the samples![]()
IJSER
Initial TOC - Final TOC
=
Initial TOC
×100
calcined at different temperatures are shown in figure 1. It is
clear that all samples are composed of anatase phase only. This result indicates the high thermal stability of the anatase phase prepared by this method.
It is worth mentioning that calcination of the dried precipi- tate, resulting from the basic hydrolysis of TiCl4 in the pres-
Fresh water samples were taken from the Nile River at the inlet of Salhia conventional plant (which serves Qena city citi- zens). All samples (1000 ml) were treated simultaneously. Bacterial count of the samples was performed before treatment and after 30 and 60 minutes of treatment as follows:
Effect of UV alone on the inactivation of bacteria: one of the
Nile water samples was taken in a 1000 ml Pyrex glass beaker. The solution was held under the UV lamp at the same position inside the UV chamber and the solution was stirred using a magnetic stirrer (400 rpm).
ence of ammonium hydroxide at 750oC or calcination of the
yellow precipitate (resulting from aging the Ti4+-H2O2) at
650oC (4) result in the formation of a mixture of anatase and
rutile.
The crystal size of TiO2 calcined at 450, 650 and 750oC was calculated from XRD results using Scherrer equation to be 6,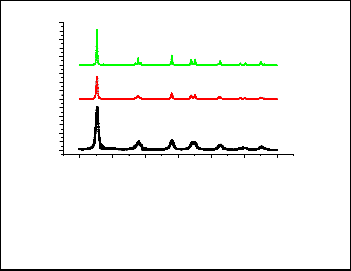
13 and 22 nm, respectively. This indicates that the crystal size increases with increasing calcination temperatures.
A
Effect of TiO2 /UV on the inactivation of bacteria: 0.25 mg of
TiO2 was suspended in1000 ml of the Nile water sample in a similar beaker. The solution was held under the UV lamp in- side the UV chamber and was stirred with the same stirring speed.
Effect of TiO2 alone (adsorption effect) on the inactivation of bacteria: 0.25 mg of TiO2 was suspended in 1000 ml of the Nile
A
A A A
A
A A A A
A
A A A
A
750 oC
650 oC
450 oC
water in a similar beaker and was held in dark under the same
conditions.
Membrane filter method was used to count bacteria according to the APHA Standard Methods (13) using acetate cellulose type filter with 0.45 mm pore size. Fecal coliform count was carried out using M-Fc agar media (Merk). Fecal coliform plats were incubated at 44.5±0.2 ◦C for 24 hrs. For
20 30 40 50 60 70 80
2 Theta scale
Fig. 1. XRD patterns of TiO2 nanoparticles obtained by calcination at different temperatures (450, 650 and
750°C), A= anatase
IJSER © 2013 http://www.ijser.org
International Journal of Scientific & Engineering Research, Volume 4, Issue 12, December-2013 276
ISSN 2229-5518
EDX analysis was carried out for the dried powder used for
TiO2 before calcination and TiO2 samples calcined at 450 and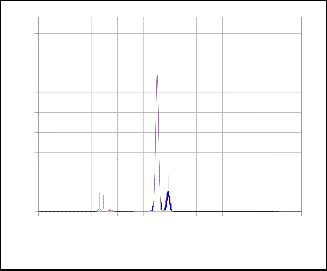
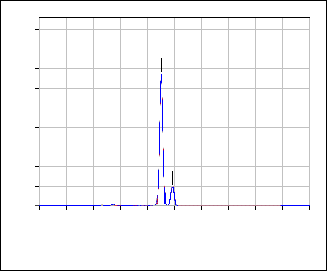
650 oC. Sulfur was detected in the dried powder and, also, in TiO2 (450) sample, figure 2. However, it was not detected in the sample calcined at 650ºC, figure 3.
45.0
40.0 Ti
35.0
30.0
25.0
20.0
15.0
10.0 Ti
S
5.0
0.0
0.00 1.00 2.00 3.00 4.00 5.00 6.00 7.00 8.00 9.00 10.00 keV
Fig.2: EDX pattern of TiO2(450)
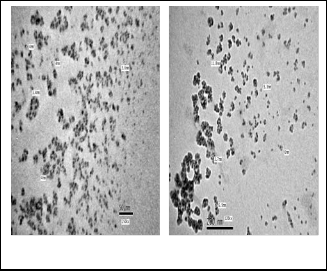
Fig. 4: TEM images of TiO2 (450)
The FT-IR spectrum of the TiO2 (450) sample exhibited characteristic band at 3430 cm-1 corresponding to structural
45.0
40.0
35.0
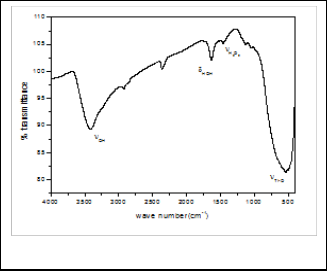
OH. The spectrum also exhibits a band at 1629 cm-1 corre- sponding to the bending vibration of H2 O while presence of H2 O2 was confirmed by its bending vibration at 1462 cm-1 as shown in figure 5. The FT-IR spectrum of TiO2 sample also exhibits characteristic band at 534 cm-1 corresponding to Ti-O stretching band (14, 15).
30.0
25.0
20.0
15.0
10.0 Ti
5.0
0.0
0.00 1.00 2.00 3.00 4.00 5.00 6.00 7.00 8.00 9.00 10.00 keV
Fig.3: EDX pattern of TiO2(650)
TEM was used to further examine the particle size and morphology of the sample calcined at 450 ºC. Figure 4 shows the TEM images of that sample. This figure indicates nearly spherical and uniform shape of particles with a very narrow distribution range and it also confirms the nano size of the prepared catalyst.
Fig. 5: FTIR spectrum of TiO2 (450)
The band gap value determines the optimum wave- length of photocatalytic reaction. The UV-visible absorption spectrum of TiO2 (450) sample is shown in figure 6. The onset wavelength (λ) of absorption was determined by extrapolation of the base line and the absorption edge to calculate the optical
IJSER © 2013 http://www.ijser.org
International Journal of Scientific & Engineering Research, Volume 4, Issue 12, December-2013 277
ISSN 2229-5518
band gap (16). The band gab was calculated by the following equation: Eg (eV) = 1239.8/λ.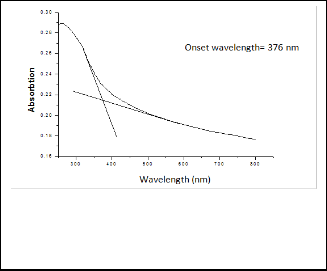
TiO2 (450) sample has a band gap of 3.24 eV corre- sponding to an onset wavelength of 382.7 nm. The calculated band gap energy is consistent with data reported in the litera- ture (17, 18).
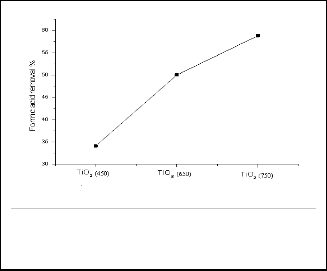
with increasing calcination temperatures. About 34.1, 50 and
58.8 % of the acid was removed after 5 hours of treatment us-
ing the samples calcined at 450, 650 and 750°C, respectively.
Fig. 6: UV-Vis absorption spectra of TiO2 (450).
Fig. 7: Effect of calcination temprature on the photocatalytic efficiency of TiO2 for formic acid removal.
It is known that the mechanism of photocatalysis involves the formation of a hole and electron pairs where the removal
Table 1 lists the values of the onset wave length of absorption and the corresponding band gab values for different samples. It is observed that there is a red shift in the onset wave length of ab- sorption from 376 nm for the TiO2 (450) to 393 for the TiO2 (750)
TABLE 1
THE PARTICLE SIZES, THE ONSET WAVELENGTHS AND BAND GAPS OF TIO2 SAMPLES AT DIFFERENT CALCINATION TEMPERATURES.
sample | Average crystallite size (nm) | Onset wave- length of ab- sorption (nm) | Band gap (eV) |
TiO2 (450) | 6 | 376 | 3.3 |
TiO2 (650) | 13 | 384 | 3.23 |
TiO2 (750) | 22 | 393 | 3.15 |
sample. This red shift can be attributed to the increasing of parti- cle size with increasing calcination temperature (19).
Figure 7 shows the removal of formic acid using TiO2 /UV. It can be concluded that the photocatalytic efficiency increases
of formic acid can be achieved through the direct electron transfer to the positive hole. Also, under the experimental conditions, hydroxyl radicals can be formed under the UV irradiation in the presence of oxygen. The removal of formic acid may be achieved through the hydroxyl radical pathway (16, 20).
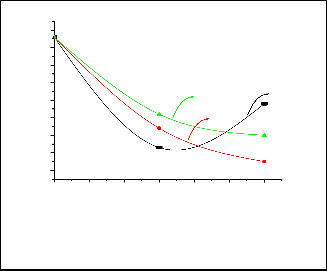
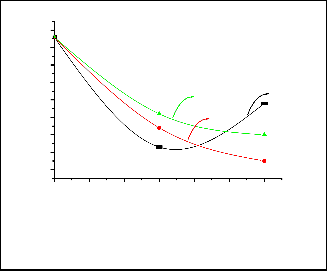
Natural decay of fecal coliform bacteria after 60 min (control test) showed that there is no significant change in the fecal coliform bacteria observed under the applied experi- mental conditions. Figure 8 shows the efficiency of the TiO2 , calcined at different temperature, for the removal of fecal coli- form bacteria by only adsorption. The sample calcined at
450°C exhibeted the highest efficiency for the adsorption of bacteria where the removal percentage exceeds 73% by this sample. However, it is clear that bacterial count during treat- ment with the sample calcined at 450 °C increases from 23
CFU/100 ml (after 30 min.) to 48 CFU/100 (after 60 min.). This may be attributed desorption of bacteria and their survival under the adsorption conditions (21). This behaviour was not observed with other samples.
It is well known that UV alone can inactivate bacteria (21). The effect of UV only and TiO2 /UV is given in Figure 9. It is clear from this figure that inactivation of fecal coliform by UV alone (photolysis) is significant. About 65 % of bacteria were inactivated after 30 minutes of treatment. However, the bacte- ria removal percentage is about the same after 60 min of treatment. The efficiency of TiO2 (calcined at different temper- atures) /UV for the disinfection of fecal coliform bacteria is presented in Figure 9. From this figure it is clear that the pho-
IJSER © 2013 http://www.ijser.org
International Journal of Scientific & Engineering Research, Volume 4, Issue 12, December-2013 278
ISSN 2229-5518
tocatalytic disinfection percentage slightly increases with in- creasing calcinations temperature.
was dried and then calcined at different temperatures (450,
650 and 750oC). Anatase phase TiO2 was formed as the only product. The prepared TiO2 oxide exhibited high efficiency for
the inactivation of fecal coliform bacteria and the removal of
formic acid from water.
90
80
70
60
750 oC
40 650 oC
30
20
10
0 10 20 30 40 50 60
Time (min.)
450 oC
[1] M. Addamo, V. Augugliaro, A. Di Paola, E. Garc´ıa-L´opez, V. Loddo, G.
Marci and L. Palmisano,. Colloids and Surfaces A: Physicochem. Eng. Aspects, vol. 265, pp. 23-31, 2005.
[2] A. J. Nozik, F. Williams, M. T. Nenadovi´c and T. Rajh, O. I. Mi´ci´c, J. Phys.
Chem., vol. 89, p. 397, 1985.
[3] A.L. Linsebigler, G.Q. Lu and J.T. Yates, Chem. Rev., vol. 95, p. 735, 1995.
[4] A. A. Abd Elrady, H. M. A. Salman, A. M. Kamal, Nanoscience and Nanotech- nology, vol. 3, pp. 90-95, 2013.
[5] B. O'Regan and M. Grätzel, Nature, vol. 353, p. 737, 1991.
Fig. 9: The fecal coliform count after treatment of raw water by UV alone and by TiO2 (calcined at different calcinations tempera- tures)/UV.
[6] L.D. Birkefeld, A. M. Azad and S. A. Akbar, J. Am. Ceram. Soc., vol. 75, p. 2964,
1992.
[7] C. G. Granqvist, A. Azens, J. Isidorsson, M. Kharrazi, L. Kullman, T.
Lindström, G.A. Niklasson, C. G. Ribbing, D. Rönnow, M. Strømme Mattsson and M. Veszelei, Solids, vol. 218, p. 273, 1997.
[8] D. He and F. Lin., Materials Letters, vol. 61, pp. 3385–3387, 2007.
90 [9] A. Henglein and Ber. Bunsenges, Phys. Chem., vol. 101, p. 1562, 1997.
80 [10] D. Beydoun, R. Amal, G. Low and S. McEvoy, J. Nanoparticles Res., vol. 1, p.
70 439, 1999.
60 [11] S. Vargas, R. Arroyo, E. Haro and R. Rodriguez, J. Mater. Res., vol. 14, p. 3932,
450 oC
750 oC
40 650 oC
30
20
10
0 10 20 30 40 50 60
Time (min.)
Fig. 8: The fecal coliform count after treatment of the Nile water
1999.
[12] M. Inagaki, Y. Nakazawa, M. Hirano, Y. Kobayashi and M. Toyoda, Int. J.
Inorg. Mater, vol. 3, p. 809, 2001.
[13] American Public Health Association/American Water Works Associa- tion/Water Environment Federation (APHA.), Standard Methods for the Exam- ination of Water and Wastewater, 21th ed., Washington DC, USA, 2003.
[14] H. Wang, B. Li, Z. Yan, Z. Lu, R. Cheng, and D. Qian, Rare Metals, vol. 27, no.
1, pp. 1– 4, 2008.
[15] Weijun Zheng, David Jewitt, and Ralf I. Kaiser," Formation of Hydrogen, Oxygen, and Hydrogen Peroxide in Electron Irradiated Crystalline Water Ice.
samples by TiO2
only calcined at different temperatures.
[16] G. A. Martínez-Castañón, M. G. Sánchez-Loredo, H. J. Dorantes, J. R. Mar-
tínez-Mendozab, G. Ortega-Zarzosab and F. Ruizb, Mater. Lett., vol. 59, pp.
In the absence of UV radiation the inactivation of bacteria occurs by adsorption of bacteria on the surface of TiO2 parti- cles (21, 22). In the presence of UV (TiO2 /UV) •OH can be formed under the experimental conditions. These •OH are highly active for both the oxidation of organic substances and the inactivation of bacteria and viruses through oxidation of the organic compound consisting the cell of bacteria, where the adsorption effect can enhance this reaction (21-23).
Nanosize anatase phase TiO2 was prepared by the precipitation method through calcinations at different temper- atures. Mercabto ethanol was added to (HOO-Ti(OH)3 ), re- sulting from the addition of TiCl4 to H2 O2 in water, till the disappearance of the yellow colour. The pH of the resulting solution was raised using NH4 OH. The precipitate formed
529-534, 2005.
[17] Soo-Jin Park, Y. C. Kang, J. Y. Park, Ed A. Evans, R. D. Ramsier and G. G.
Chase, J. Engineered Fibers and Fabrics, vol. 5, p. 54, 2010.
[18] K. Nagaveni, M. S. Hegde, N. Ravishankar, G. N. Subbanna, and Giridhar
Madras, Langmuir, vol. 20, pp. 2900-2907, 2004.
[19] H. Haug and S. W. Koch ," Quantum Theory of the Optical and Electronic
Properties of Semiconductors", world scientific publishing co. Ltd. 1990.
[20] J. Krýsa, G. Waldner, H. Měšťánková, J. Jirkovský and G. Grabner, App. Cat. B: Environ., vol. 64, pp. 290-301, 2006.
[21] Luigi Rizzo, Journal of Hazardous Materials, vol. 165, pp. 48–51, 2009.
[22] A. G. Rincón and C. Pulgarin, Applied Catalysis B: Environmental, vol. 51, pp.
283–302, 2004.
[23] D.M. Blake, P.C. Maness, Z. Huang, E. J. Wolfrum, J. Huang and W.A. Jacoby,
Sep. Purif. Methods, vol. 28, p. 1, 1999.
IJSER © 2013 http://www.ijser.org