International Journal of Scientific & Engineering Research, Volume 5, Issue 4, April-2014 1278
ISSN 2229-5518
Surface and dispersion properties of dodecanol and tetradecanol based glucoside surfactants Geetha D1, Rashmi Tyagi1
Abstract: The sugar based alkyl polyglucosides have been synthesized from fatty alcochols and dextrose on laboratory scale to find the optimum molar ratio of the paratoluene sulfonic acid catalyst for the synthesis in lower reaction temperature and pressure. The chemical structures and purity of the synthesized compounds were confirmed by using fourier transform infrared spectroscopy and nuclear magnetic resonance spectroscopy. The surface and interfacial properties like critical micelle concentration, free energy of micellization, surface excess concentration and surface area demand per molecule were determined. These sugar based surfactants have been found to exhibit good surface tension, emulsion stability, foaming and wetting power. A new approach through nephelometric measurements has been followed to measure the dispersion power and the synergy with sodium dodecylglucosides. A good amount of synergism was found between the alkyl polyglucosides and the anionic sodium dodecyl surfactant. Biodegradation studies showed that the primary biodegradability of the synthesized surfactants was above 80%.
Index terms: Dodecyl glucoside; Tetradecyl glucoside; Biodegradability; Synergism; Dispersion
---------------------------------------------****************---------------------------------------------
The concern about the environment for the sustainable
growth, enhance the development of biodegradable, non-
toxic and naturally derived surfactants. In this regard, sugar based alkyl polyglucosides have been growing as a new class of nonionic surfactant with their good environmental profile [1] mild character [2] dermatological
compatibility and novel surface active properties [3], [4], [5]. The naturally abundant, multifunctional sugar moiety constitute the hydrophilic part increase the chance for new derivatized APG surfactants with desired properties. The optimum molar ratio of the PTSA (Para toluene sulfonic acid) catalyst have been analyzed in the present study for the synthesis of alkyl polyglucosides by the condensation reaction of anhydrous glucose and fatty alcohols of different alkyl chain length (C12 & C14 ). The prepared compounds have been evaluated as potential
surfactants and to assess the improvement in the physicochemical properties of the APG surfactants and in turn to expand their potential applications.
2 Experimental techniques
All the chemicals used throughout this study were used as such without any further purification. D-Glucose, sodium dodecyl sulfate (SDS) and fatty alcohols were supplied by Merck, p- toluene sulfonic acid (PTSA) was supplied by Loba Chemical Company. Double distilled water was used for preparing solutions.
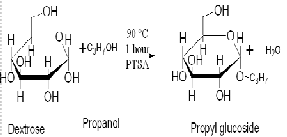
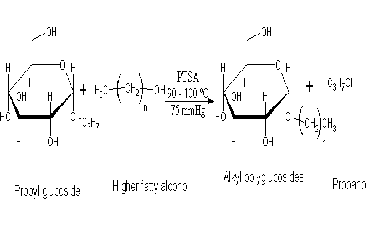
different alkyl chain length (C12 & C14) using varying molar ratio of acid catalyst PTSA [6]. It is a two step process as represented in Scheme – 1. In the initial step, a measure of 5.4g of anhydrous dextrose was dissolved in 18g of propanol in the presence of 0.4g PTSA with azeotropic removal of water at 90oC for 1 hr. Then 27.95g (dodecanol) and 32.15g (tetradecanol) of the higher alcohol and 0.06 –
0.095g of PTSA was added slowly with increasing temperature to 90oC - 100°C under vaccum (75 mm Hg), until completion of the reaction. The reaction was quenched by adding 1% alcoholic NaOH and the mixture was stirred for additional 30 min. The residual alcohol was removed by multistage vaccum distillation at 80oC.
Step- I Synthesis of propyl glucoside intermediate
Step-II Transacetalization by higher alcohols to alkyl polyglucosides.
Since the synthesis of APGs of varying chain length have been reported already, the present study deals with the role of PTSA catalyst in synthesis of APG12 and APG14 by the condensation reaction of glucose and fatty alcohol of
IJSER © 2014 http://www.ijser.org
International Journal of Scientific & Engineering Research, Volume 5, Issue 4, April-2014 1279
ISSN 2229-5518
where n = 11for Dodecyl glucoside, 13 for Tetradecyl glucoside. Scheme 1 Synthetic route of alkyl polyglucoside.
The structure of the final product was confirmed using, FTIR model Thermo Nicolet, Avatar 370, 1H-NMR model Bruker Avance III, 400 MHz, and 13C – NMR model Bruker Avance III, 100 MHz. All these spectral analysis were performed at Sophisticated Analytical Instrument Facility (SAIF), Cochin, Kerala, India.
The surface property of the synthesized APGs have been analyzed primarily by surface tension measurements using Du-Nouy ring tensiometer at different temperatures and concentrations. The surface tension of APG12 was determined at three different
Where, γ – surface tension (mNm-1), R- gas constant (8.314Jmol-1 K-1), T- Absolute temperature, C- Surfactant concentration, (d γ/dlnC) - Slope of surface tension plots, N
– Avagadro’s number (6.022×10²³), G – Free enenrgy
The value of i represent the number of species at the
interface for which the concentration changes with the
surfactant concentration. The co-efficient i = 1 for the dilute solution (10-2M or less) of synthesized alkyl polyglucosides [8].
The biodegradability of aqueous solutions of APGs was conducted according to the OECD 301 E test for ready biodegradability [9] and the APGs were quantified by a modification of the anthrone method proposed by Buschman and Wodarczak [10]. The biodegradation were tested by taking 1.2 litres (15mgL-1) of APGs aqueous solution with nutrients in a 2 litre Erlenmeyer flask and inoculated with active sludge of sewage treatment plant. The residual APG concentration over time was determined by mixing 2ml of degradation liquor with 5ml of solution of
0.8% (w/w) anthrone in conc. H2SO4. The mixture was hydrolysed for 5 min in boiling water and then quickly cooled in cold water for 10 minutes. The absorbance of this mixture was studied at 621nm by using single beam UV- visible spectrophotometer [11]. In order to know the biodegradability of APGs in an ordinary condition, the aqueous APG surfactant in the same concentration was made with sewage water. The residual surfactant concentration have been measured with anthrone reagent at different time intervals.
The dispersing power of the synthesized APGs for decanol have been analyzed by using digital nephelometry meter
temperatures viz. 25oC, 45oC and 55oC where as for APG
it was
(model No. CL 810). The synergism of the synthesized
determined only at 45oC and 55oC as APG
is not soluble at 25oC
APGs with the anionic SDS in term of turbidity have been
in water. The other surface properties were calculated from the following formulae [7].
Surface excess concentration:
Ґ= - (1/iRT) (dγ/dlnC) – (1)
Specific surface area:
ACMC = 1/N Ґ CMC - (2) Free energy of micellization:
ΔGCMC = 2.303RT logCCMC - (3)
analyzed by using nephelometer. The polar oily material decanol in different quantities have been mixed to the aqueous solution of 0.01M APGs (APG12 and APG14 respectively), 0.01M SDS and their mixtures of various molar ratios viz 4:1, 3:2, 2:3and 1:4. The dispersed decanol in the surfactant was allowed to attain equilibrium by stirring them in a thermostat for 5 hr at 30°C. The dispersion caused the turbidity. The turbidity of mixtures of aqueous surfactant solution and decanol was measured using digital nephelometry meter (model No. CL 810). This test was designed to be simple and to provide a relative comparision of the dispersion and solubilization of decanol in the mixtures of APG12 + SDS and APG14 + SDS to prove their synergistic nature.
The following performance properties were evaluated with the 0.1 % aqueous APGs surfactant solutions.
IJSER © 2014 http://www.ijser.org
International Journal of Scientific & Engineering Research, Volume 5, Issue 4, April-2014 1280
ISSN 2229-5518
The foaming power of 0.1 % (20ml) solution was determined by pouring the surfactants into 100 ml stoppered measuring cylinder and whipping with a perforated plunger, giving 30 constant vigorous strokes by hand. The volume of the foam produced was read
immediately and after 5 min [12].
Emulsion stability determination was done from 10 ml of
0.1% aqueous solution of the APGs with 10 ml of light
paraffin oil and shaken vigorously for 2 min at 25oC. The
emulsifying power was determined by the time it took for
the clear aqueous volume separating from the emulsion
layer to reach 9 ml, counting from the moment the shaking
was stopped [6],[13].
Wetting time was determined by immersing a sample of cotton fabric (4cm×4cm) in 20ml of 0.1% aqueous solution of APGs at 25oC. The time was recorded from the moment, the cotton fabric was put into the solution until the moment it started going down and settle down on bottom [14].
The yield of synthesized alkyl polyglucosides are reported in Table 1. On perusal of table 1, it can be revealed that catalyst PTSA is playing an important role on the final yield of APGs like controlling the polyglucoside side product formation, and improving quality of the final APG products. Three different batches have been carried out, viz
0.004 mole PTSA, 0.005, 0.006. When the amount of acid catalyst increased, the product yield have also been increased. Beyond the optimum molar ratio (0.005), the catalyst increased the unwanted polymerization of the polyglucose side product and there was a decrease in the formation of desired glucoside product. Maximum yield of APGs were observed when molar quantity of PTSA was
0.005. In the case of APG12 the yield was 38.0%, for APG14, it was 37%. When the molar ratio of PTSA was increased to
0.006 moles then, instead of rise of the yield, there was a decrease in the yield, for APG12, it was 36.5 and for APG14, it was 35.7%.
Table 1 Effect of varying molar ratios of PTSA on yield of APGs (C12 & C14).
A typical FTIR spectrum of APG12 displayed bands at 3100
– 3300 cm-1(O-H), 1050cm-1 (C-O),1726 cm-1 (CHO),1117
cm-1 (C-O-C), 2855 cm-1 (CH3-symmetric stretch), 2922 cm-
1 (CH3-asymmetric stretch), 1645 cm-1 (CH3- asymmetric
bending), 1371 cm-1 (CH3-symmetric bending), 1459 (CH2-
asymmetric bending), 720 cm-1 (multiple (CH2)n rock)
which are characteristic of the desired compound.
The Synthesized APG14 displayed bands at 718 cm-1
(multiple (CH2)n rock ), 1464 cm-1 (CH2 asymmetric bending), 2852 cm-1 (CH2 symmetric bending), 3200 – 3400 cm-1(O-H), 1057cm-1 (C-O), 1715 cm-1 (CHO), 1127 cm-1 (C-O-C), 2855 cm-1 (CH3-symmetric stretch), 2865 cm-1
(CH3-asymmetric stretch), 1463 cm-1 (CH3- asymmetric bending), 1376 cm-1 (CH3-symmetric bending) which are characteristic of the desired compound.
1H-NMR spectra: The synthesized APG surfactants were further supported by the 1H-NMR spectrum which exhibits signals for APG12. Δ 0.85 (t, 3H, CH3), 1.23 (20H, CH3 (CH2)10), 3.47 (2H, O-CH2 (CH2)10), 3.44-4.6 (m, glucoside protons).
APG14. Δ 0.86 (3H, CH3), 1.25 (26H, CH3 (CH2)13), 3.37 (2H, O-CH2(CH2)14), 3.04-4.26 (m, glucoside protons).
The 13C-NMR was performed to confirm the type and distribution of carbon atoms in the prepared surfactants.
The surface tension values were measured are depicted in Figure 1, 2. In the beginning, with the increase of surfactant concentration, the surface tension values got decreased up to the CMC; above the CMC, the surface tension values were not decreased.
The surface tension values decreased with the increase of temperature for the same concentration of APGs than that of the higher concentration due to the loss of heat energy happened when the hydrogen bond between the free hydroxyl groups of APGs with water get break down. The loss of heat energy was higher at higher concentration than that at the lower concentrations.
For the constant hydrophilic glucose moiety, the effect of length of hydrophobic group has been studied. The surface tension values decreased with increase of alkyl chain length. The solubility of the surfactant decreased on the increase in the alkyl chain length due to the increase of hydrophobic character which is attributed to its relatively
IJSER © 2014 http://www.ijser.org
International Journal of Scientific & Engineering Research, Volume 5, Issue 4, April-2014 1281
ISSN 2229-5518
low hydrophilic-lipophilic balance. The APG14 which is having longer hydrophobic chain length was not soluble at
25oC whereas APG12 can.
The CMC is the aqueous concentration of the surfactant at which the surfactant solution attain the smallest surface tension due to the micelle formation. Above the CMC, additional surfactants forms the aggregates in the bulk, whereas the concentration of the unassociated monomers remains constant. CMC values were determined from the break point between concentration and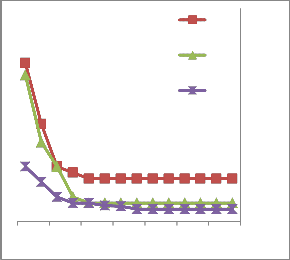
60
25°C 55
45°C 50
55°C 45
40
35
30
Table 2 surface active properties of APG12 &APG 14 .
0.10.20.50.8 1 2
25
5 8 11 14 31
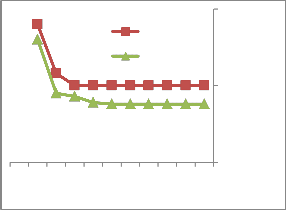
Fig - 1(a) Surface tension of APG12 at different temperatures.
35
45°C
55°C
30
0.1 0.2 0.5 0.8 1
2 5 8
25
11 14 31
Fig - 2 Surface tension of APG14 at different temperatures.
surface tension values. The hydrophobic moiety had a strong influence on CMC values. As seen in table 2 the CMC value decrease distinctly with increasing alkyl chain length. As a general approximation, the CMC value is lowered by a factor of 10 when the chain length is increased by two
The Gibbs equations have been used to calculate the area demand per molecule at the interface (A) from surface tension measurements. To calculate ҐCMC and ACMC it is usual to fit a polynomial (quadratic) to the pre-CMC data and calculate the derivative d γ /dlnC at the CMC. As can be seen in table 2, the excess concentration of surfactant increases as the length of the alkyl chain increases. These results indicate that the increasing of the length of the alkyl chain produces a higher surface activity through lower CMC. The surface area demand per molecule for the APGs gives some information on the packing degree of adsorbed molecules. In the present study, the ACMC value decreases
IJSER © 2014 http://www.ijser.org
International Journal of Scientific & Engineering Research, Volume 5, Issue 4, April-2014 1282
ISSN 2229-5518
with increasing chain length. This may indicate that the tight packing in the thickened adsorption layer, showed strong adhesion interaction.
Biodegradability testing plays an important role in the assessment of the environmental behavior of surfactants. The UV- VIS spectroscopic determination of APGs based on their reaction with the Anthrone reagent was used to determine the primary aerobic biodegradability [11]. It was observed that in the beginning the rate of degradation of APG14 was higher than that of the APG12, after 4day the initial degradation of both the APGs were more than 70%
concentration increased. The turbidity get decreased with the change of molar ratio of the binary mixtures from 1:4 to
4:1 (SDS : APGs respectively). The observed increase of turbidity is due to the dispersion of decanol. Also, when the molar ratio has been changed from 1:4 to 4:1, the dispersed decanol get solubilized in turn it decrease the turbidity and prove the synergistic ability of APGs with SDS.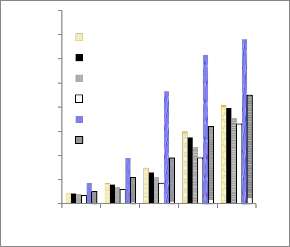
Table 3 Performance properties of APG12 and APG14 .
900

(73% for APG12 and 80% for APG14 ). Current legislation requires a minimum level of biodegradation of over 80% for surfactants to be considered biodegradable, when the OECD test is applied. The synthesized APGs may therefore be considered as readily biodegradable under actual environmental conditions. The rate of biodegradation of APG with sewage water under normal environmental condition is found similarity with the OECD result with slight changes. The trend of biodegradability for both APGs with time is given in Figure 2.
100
80
800
700
600
500
400
300
200
100
4:01
3:2
2:3
1:04
APG SDS
60
40
20
0
20 30 40 50 60 70
Biodegradabili
ty in % APG₁₂
Biodegradabili
ty in % APG₁₄
Fig - 4 Turbidity vs. concentration of decanol in SDS, APG12 and mixture of the two (APG : SDS = 4:1, 3:2, 2:3 and 1:4) in different mole ratios.
Fig - 3 Primary biodegradation of alkyl polyglucosides.
The dispersing power has been analyzed in terms of turbidity. The turbidity shown in the figure 3, 4 have been calculated by measuring the turbidity of decanol with APG12 , decanol with APG14 surfactant mixtures corrected by subtracting the background turbidity of the surfactant solution and the turbidity of decanol dispersion in water. The same method has been repeated for the decanol and SDS surfactant mixtures and decanol + APG12 : SDS binary mixtures, decanol + APG14 : SDS binary mixtures. The
900
700
500
300
100
4:1
3:02
2:03
1:04
APG
SDS
1 2 3 4 5
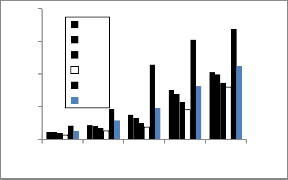
Fig - 5 Turbidity vs. concentration of decanol in SDS, APG14 and mixture of the two (APG : SDS = 4:1, 3:2, 2:3 and 1:4) in different mole ratios.
surfactant/decanol dispersion results show a general trend
of increasing turbidity to a maximum value as decanol
IJSER © 2014
International Journal of Scientific & Engineering Research, Volume 5, Issue 4, April-2014 1283
ISSN 2229-5518
The foaming ability of the synthesized natural surfactants is given in Table 3. The foam height decreases as the alkyl chain length increases. The APG12 surfactant showed better foam stability than the APG14 . The wetting time for APG12 was 55 sec. It indicated that the APG12 had better wetting ability than APG14 .
Table 3 Performance properties of APG12 and APG14 .
The data determined by standard methods [13] showed
that the increase of hydrophilic chain length resulted in an
increase in its emulsion stability. That may be due to the
efficiency of adsorption from aqueous solution and an
increase in its tendency to adsorb through its hydrophobic
group.
The optimum molar ratio of the PTSA catalyst for the synthesis of carbohydrate based APGs was concluded as
0.005 mole per mole of glucose. Further their surface active properties were determined by measuring equilibrium surface tension. The results showed that the synthesized APG surfactants provide an excellent surface activity such as lower CMC, lower surface tension and closer packing at the air/water interface than that of the other ionic surfactants. The synthesized surfactants showed a better biodegradability and the dispersion studies of APGs with SDS revealed very superior synergism in their performance.
The authors are grateful to sophisticated analytical instrument facility (SAIF), Cochin for them active support in the characterization of the synthesized product.
Daz Geetha and Rashmi Tyagi,” Alkylpoly Glucosides (APGs) surfactants and Their Properties,” Tenside Surfactants Detergents,Vol.49, No.5, pp. 417-427, 2012.
W.H. Matthies, H.U. Krachter, W. Steiling, M. Weuthen,”Proceedings of the 18th International Federation of Societies of Cosmetics Chemists, Venice, (Poster. 4 1994)
317.
J. Orlando Rojas, Cosima Stubenrauch, Judith Schulze-
Schlarmann and M. Per Claesson, Langmuir 21, 11836-
11843, 2005.
Z.Q. ZYuan, S.X. Tang, B. Zeng, M. Wang, Z.L.Tan, Z.H.
Sun, C. S. Zhou, X.F. Han and M.A. Bamikole, “ J.Animal
Science. 88, 3984-3991, 2010.
Poonam Sharma, Shweta Sachar, Gurpreet Kaur, Pankaj
Thakur, Mandeep Singh bakshi and Tarlok singh banipal,”
J. Surface Sci. Technol. 23, 131 (2007).
J. Gruetzke and S. Schmidt,” Ger Offen (1996) DE 4,431,853.
T. Yoshimura, T. Ichinokawa, M. Kaji and Esumi, K,”
Colloids Surf A 273 (2006) 208.
M. Rosen: Surfactants and interfacial phenomena. Wiley-
Interscience, New York, (1989) p. 61 and 174.
OECD Organization for Economic Cooperation and
Development. OECD Guidelines for the Testing of
Chemicals, Volume 1, Section 3: Degradation and
Accumulation, OECD, Paris. France. 1993.
N. Buschmann, S. Wodarczak,” Tenside Surf. Det.32 (1995)
336-339.
Jian Zhang, Ke-chang Xie, Xi-hai Dai. and Gao-yong
Zhang,” J. Surf Deterg. 6 (2003) 253.
D. Shulkla and V.K. Tyagi,” Euro. J.Lipid Sci. Technol. 110
(2008) 576-580.
W.I.A. Dougdouga, and E.H. El-Mossalamy,” Appl Surf Sci.
30 (2006) 2487 - 2498.
A.W. Cohen and M.J. Rosen,” J. Am. Oil. Chem Soc. (1981)
1062- 1066.
IJSER © 2014 http://www.ijser.org