Shepard and Clifton (2000) provides statistical evidence of the effects of overtime hours on worker productivity using aggre-
International Journal of Scientific & Engineering Research Volume 2, Issue 11, November-2011 1
ISSN 2229-5518
Study the Impact of Fatigue and Optimizing Productivity of an Assembly Line of Garment Industry
Mahmud, Mahbubur, Dr. Nafis
—————————— ——————————
HE apparel manufacturing industries are now shifting focus from low cost items to high quality and high value products. In addition to customer driven demands, com- panies are more concerned for good working conditions on the floor due to government regulations and tight labor mar- kets. Now garment manufacturers must explore different ways to meet quality standards while reducing costs through improving productivity, efficiency and safety work. Fatigue has severe affect on productivity and profitability. Fatigue can result mental mistakes, work inefficiently or work beyond their physical capabilities to the point of injury. Fatigue reduces work performance mainly by increasing the time needed to accomplish tasks. Reducing fatigue results concentrating and decreasing operation time means higher productivity. Apparel industries play an important role to the economy of developing countries like Bangladesh, Sri Lanka, Vietnam etc. and it deteriorates with low labor productivity, low efficiency of the workers, fatigue of the workers, lack of efficient infrastructure, low level of investment, lack of oppor- tunities on the job training, lack of knowledge and awareness of the tools for productivity improvement. So it is necessary for apparel industries to develop a framework for some func- tions of productivity to maintain international level of stan- dards to meet the changing needs of all the customers. Opti- mization of the assembly line is needed to improve productivi- ty. In this paper the framework is limited only on fatigue and
————————————————
Md. Mahmud Akhter is currently pursuing masters degree program in IPE in BUET, Bangladesh, PH-+8801735449485. E-mail: mah- mud.ipe@gmail.com
Md. Mahbubur Rahman, M.Engineering degree, IPE, BUET, Bangladesh, E-mail: mahbub.duet@yahool.com
Dr. Nafis Ahmad ,PhD,Tokyo Institute of Technology,Japan,Associate Professor, BUET, Bangladesh, PH-+880171252980. Web: http://ahmadn.info,E-mail: ahmadn.ipe.buet@gmail.com
optimization of a garment assembly line.
Many works have done on the effect of fatigue on productivity in the overtime hours. However no works is done on produc- tivity change due to fatigue in the normal working hours.
Savage and Pipkins (2006) worked to find the effect of rest period on hand fatigue and productivity. According to there study the experimental task consisted of collecting hand strength measurements and recording the number of drilled screws. Sixteen study volunteers were randomly assigned and divided into two groups. Half of participants are control group and another half are experimental group. Recovery time was used as the main treatment effect under the experimental condition. The control group worked without having recovery time versus the experimental group receiving recovery time. In 20 minutes the mean number of screws of control group is
157.5 and experimental group is 162.5. The mean hand strength of control group is 83.4 pounds and experimental is
89.4 pounds. Collected data shows a very significant impact of intermittent rest period on recovery.
Hanna, Chang, Sullivan and Lackney (2008) worked on the qualitative part details why and how shift work affects labor productivity, and then addresses the appropriate use of shift work considering labor fatigue. The quantitative component determines the relationship between the length of shift work and labor efficiency. The results of the research show that shift work has the potential to be both beneficial and detrimental to the productivity of manufacturing labor. Small amounts of well-organized shift work can reduce fatigue and a very effec-
IJSER © 2011
International Journal of Scientific & Engineering Research Volume 2, Issue 11, November-2011 2
ISSN 2229-5518
tive response to schedule compression and productivity. The
productivity loss, obtained from the quantification model de- veloped through this study, ranges from −11 to 17% depend- ing on the amount of shift work used and fatigue of the labor.
Allen, Slavin and Bunn (2007) worked on secondary analyses of a longitudinal employee panel. Average hours worked dur- ing spring 2001 were assessed relative to health, safety, and productivity outcomes. Those working 60+ hours were more likely to report new injuries and diagnoses, but these effects greatly negative affect on labor productivity. More than 60+
to concentrate or making more mistakes than usual, excessive
head nodding or yawning, increased absenteeism, repeatedly moving off track while driving vehicles and plant, near misses etc. In this study, loss due to fatigue has been calculated based on loss at the bottleneck point. Assume Pa is the units of work actually produced by worker; Pm is the units of works which could be produced at standard performance, PM is the maxi- mum production capacity considering no fatigue of worker at bottleneck point.
hours in a week, the significant impact of fatigue is clearly visible and results less injury with better performance.
Number of unit loss
Loss due to fatigue
PM Pa
…..……….…….……….. (3.1)
Shepard and Clifton (2000) provides statistical evidence of the effects of overtime hours on worker productivity using aggre-![]()
PM
Pa 100% ………………………………………... (3.2)
gate panel data for 18 manufacturing industries within the US economy. He suggest that use of overtime hours lowers aver- age productivity, measured as output per worker hour, for almost all of the industries included in the sample. Working long times results fatigue that affect badly on productivity.
Thomas and Raynar (1997) studied on 121 weeks of labor productivity data from four industrial projects. The objective is to quantify the effects of scheduled overtime. The results show losses of efficiency of 10-15% for 50-h and 60-h work weeks. Losses of efficiency are caused by the inability to pro- vide materials, tools, equipment, information and labor fati- gue at an accelerated rate.
In this work it is shown that productivity varies time to time in the normal working hours. And optimization of an assembly line, results efficiency increasing from 88.8% to 92.7%.
Fatigue is a physical or mental state caused by over exertion. It reduces a person's capabilities to an extent that may impair their strength, speed, reaction time, coordination, decision making, or balance. Normally, good quality sleep reverses the imbalance, allowing the body and the brain to recover. How- ever, working long hours, working with intense mental or physical effort, or working during some or all of the natural time for sleep can all cause excessive fatigue. Fatigue can also have longer-term effects on health. Fatigue is defined as a state of being tired. The signs, symptoms and affect fatigue has on workers varies from one person to the next, however fatigue may affect the individual worker’s ability to perform. Most frequent possible Indicators of Workplace Fatigue are feeling drowsy or relaxed, feeling tired or sleepy or not feeling re- freshed after sleep, blurred vision, increased irritability, find- ing it difficult to keep eyes open, taking more frequent naps during leisure hours or falling asleep at work, finding it hard
PM
Productivity may be defined as the ratio between output and input. Output means the amount produces or the number of items produced and inputs are the various resources em- ployed. There are many factors affecting productivity of as- sembly line such as product and system design, machine and equipments, skills and effectiveness of the workers, produc- tion volume. In true sense, the productivity can be said as in- creased if more products can be obtained from the same amount of resources. Indoor environmental quality may affect physiological and psychological processes that, in turn, may affect performance of tasks that may interact with other factors to affect overall productivity. To improve productivity, most efficient workers should be placed at the bottleneck points. It is necessary to improve the existing production capacity of assembly lines through proper optimization technique. Some applications can not be applied. Though the decision variable performance is known and the efficiency of the workers is dis- tinctive i.e. there is no way to use a portion of the efficiency of worker, linear programming optimization technique is not applicable. In network optimization model, there are many paths to follow and sometimes there has a provision to skip any path. But in the apparel assembly line there is no way to skip any operation as well as path, it is also not applicable. Transportation model is not applicable because in assembly line production system there is a distinctive path to follow and there is no provision of skipping any operation for the shack of completing a finish product and sequence of operations must have to be maintained. Assignment model is not suitable because production capacity of assembly line does not depend on several points but depends on the bottleneck points. Genet- ic algorithm is not applicable because in an assembly line there is no impact of one worker to other.
IJSER © 2011
International Journal of Scientific & Engineering Research Volume 2, Issue 11, November-2011 3
ISSN 2229-5518
Observed time is the time, receiving work from previous workstation to the delivery the work to the next workstation is the observed time for an operation. It defers from one opera- tion to another operation. A bottleneck is defined as any re- source whose capacity is less than the demand placed upon it. It is a constraint within the system that limits the throughput. In other word the point in the manufacturing process where the flow thins to a narrow stream. Production Capacity is the ratio of available time to cycle time. Available time means the time of the shift.
Maximum daily actual output-
T
![]()
P …………........…………………………….………... (3.3)
C
Where, T= Available time, second; C= Cycle time (second/unit)
Performance Rating or Efficiency is the ratio of units of work actually produced by worker and units of work which could be produced at standard performance.
Performance rating or efficiency-
Pa
Line and work cell balancing is an effective tool to improve the throughput of assembly line and work cells while reducing manpower requirements and costs. Assembly Line Balancing, or simply Line Balancing (LB), is the problem of assigning op- erations to workstations along an assembly line, in such a way that the assignment be optimal in some sense. LB has been an optimization problem of significant industrial importance.
It is developed based on the overall daily performance of each worker. Due to the physical fatigue of worker, performance of worker changes with time and the label of performance of each worker do not remain same. Assumptions are continuous flow of material through the assembly lines, efficient workers are placed at bottleneck points where bottleneck point’s work- ers are placed at less processing time taken operation’s and can do that operation at its own efficiency, replaced bottleneck point workers have the capability of reaching the line target at
100% efficiency or more, one workstation can be half, one or a![]()
K
100% .............................................................. (3.4)
Pm
group, there is no effect on performance due to change in
weather, variation in working environment, no effect of fati-
k Performance rating or efficiency of worker; K=A, B,
C……………L
Where A, B, C…L are the respective workers.
Utilization means the productive time on the available time of a cycle. At the non bottleneck point, the productive time is less than the cycle time and some portion of the cycle time is not used. Assuming number of workstation in the assembly line is
n, C is the cycle time (sec) and the productive time is T j (sec),
where j=1, 2, 3……………n
The relationship between productive time Tj and cycle time C
is given as follows T j C
Utilization-
n
T j
![]()
µ j 1 100% ............................................................... (3.5)
nC
nC = Total line capacity, second, n = Total number of
workstation.
Line Efficiency is how effectively the line is used in term of line capacity. In other words it is the ration of produce time to spend time. Line efficiency is expressed through the following equation:
Line efficiency-
n
T j
j 1
![]()
K n 100% .................................................................. (3.6)
C
gue of data collector in collecting whole day data.
At first by using stop watch, the observed processing time and average processing of each operation has been obtained. Stan- dard processing time of each operation is considered as facto- ry standard. Then using average processing time of each oper- ation of each time segment, the performance of individual worker has been found. Standard processing time of each op- eration is different. Then workers are assigned randomly at different workstations without considering their level of per- formances. Number of workers at each workstation depends on standard time of the corresponding operations. Then iden- tify bottleneck points based on more processing time taken operations. The efficient workers are placed at bottleneck point where less efficient worker occupied by less processing time took operation. Then again the new bottleneck points are identified and the process is repeated until decreases the as- sembly line efficiency as well as increase the processing time at bottleneck points. The production capacity of each worksta- tion of each time segment has been calculated based on processing time of bottleneck points. Then excess capacity has to remove by releasing inefficient worker or increasing capaci- ty or distribute works as well as balancing assembly line. Un- necessary workers increase the production cost and the work- ers have no contributions in improving production capacity. Finally the optimum production capacity, loss due to fatigue, line utilization and line efficiencies are calculated. In the fol- lowing figure 1, shows the steps necessary for optimizing productivity.
IJSER © 2011
International Journal of Scientific & Engineering Research Volume 2, Issue 11, November-2011 4
ISSN 2229-5518
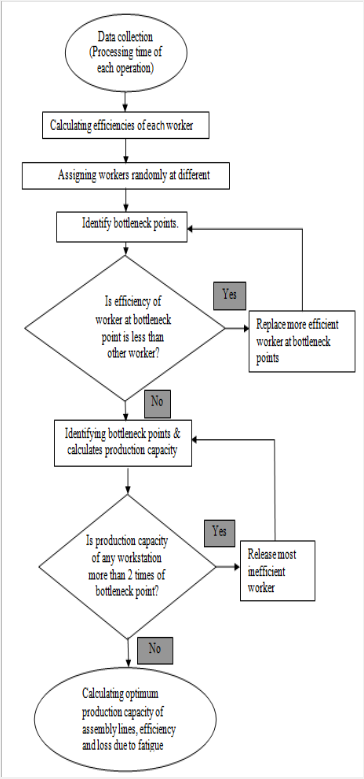
Figure 1: Steps for optimizing assembly line productivity.
In this study a woven shirt manufacturing industry is selected to optimize the assembly line and observe the impact of fati- gue on productivity. First operation bulletin of boy’s short sleeve shirt is made. Sections, operations, machine, factory standard of each operation’s cycle time and target based on it are exist. Line target at 100% efficiency and theoretical workstation exists. Operation bulletin is shown in table 1.
Table 1: Operation bulletin of boy’s short sleeve shirt
IJSER © 2011
International Journal of Scientific & Engineering Research Volume 2, Issue 11, November-2011 5
ISSN 2229-5518
At 100% efficiency line target is 280 pieces of garments per hour. After that lay-out is done by sequencing the operations, randomly place worker at the workstations. Assembly line target is given at 100% efficiency which depends on efficiency, manpower, working hour and operation cycle times. Based on this CT(cycle time) theoretical total number of W/S (worksta- tion) is calculated. Workers are assigned randomly in those workstations. Average cycle time and capacity of each opera- tion are calculated. Efficiency of workers depends on FS (Fac- tory standard) operation cycle time and average cycle time of the respective operations. Workers are ranked according to there efficiencies which is shown in table 1.
From table1 most efficient workers are found according to their rank which depends on their efficiencies. Bottle neck points are found based on more processing time taken opera- tions. Most efficient workers placed at the bottle neck points whether his/her place occupied by less processing time taken worker. Then again identify the bottleneck points and contin- ue until line efficiency decrease. Actual workstation is kept half or whole number based on theoretical workstation. From table 1 line standard minute value 12.87 minute and workplace 60 are found. In this study only 5 ranks are consi- dered where higher the rank higher the efficient worker and it limits only on sewing operators. In figure 2 shows the bottle- neck points with other sewing operations.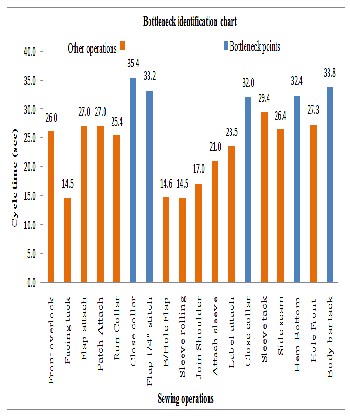
Figure 2: Identification of bottleneck poins![]()
Table 2: Ranks, efficiencies and new bottleneck points with operation CT in various iterations (Iteration 1 to 3)
IJSER © 2011
International Journal of Scientific & Engineering Research Volume 2, Issue 11, November-2011 6
ISSN 2229-5518
Table 2: Ranks, efficiencies and new bottleneck points with operation CT in various iterations (Iteration 4 to 6)![]()
Table 3: Efficient workers are replaced by bottleneck points in various iterations.
Rank | Efficient worker position | ||||||
Rank | Ini- tial | Itera- tion- 1 | Itera- tion 2 | Itera- tion 3 | Itera- tion 4 | Itera- tion 5 | Itera- tion 6 |
Efficient 01 | 1 | 14 | 14 | 14 | 38 | 38 | 14/35 |
Efficient 02 | 35 | 38 | 17/35 /38 | 35/38 | 14 | 35 | 38 |
Efficient 03 | 12 | 35 | 29 | 17 | 35 | 14 | 17 |
Efficient 04 | 33 | 17 | 30 | 29 | 17 | 17 | 29 |
Efficient 05 | 29 | 29 | 36 | 9/11/3 0/36 | 29 | 29 | 11/30 /36 |
From table 3 in iteration 2 efficient worker 2 can be replaced by positions 17, 35, 38 and randomly we choose position 17. In iteration 3, efficient worker 2 and 5 replaced by 35 and 9 and in iteration 6 efficient worker 1 and 5 replaced by 14 and 11. From table 1 assembly line efficiencies are calculated. Efficient workers are interchanged and new bottleneck points are iden- tified which we get from table 2. Line efficiencies are calcu- lated through FS and cycle times collected from assembly line. In this study initially line efficiency is 88.8%, in iteration 1 effi- ciency is 90.2%, in iteration 2 efficiency is 90.8%, in iteration 3 efficiency is 91.5%, in iteration 4 efficiency is 92.2%, in itera- tion 5 efficiency is 92.7% and in iteration 6 efficiency is 91.8%. Through iterations initial to iteration 5 assembly line efficiency increases but in iteration 6 it decreases. Due to decreasing effi- ciency in iteration 6, the optimization process is stopped. In figure 3 efficiencies are shown in different iterations.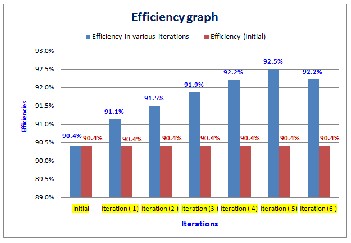
IJSER © 2011
International Journal of Scientific & Engineering Research Volume 2, Issue 11, November-2011 7
ISSN 2229-5518
Table 4: Productivity loss, utilization (In percentage)
Worker number | Operation description | FS CT (sec) | Productive time (sec) | Theoretical w/s | Initial w/s | Balanced w/s | Maximum production capacity | Initial line target | Balanced line target | Average Output | Loss (pieces) | Loss (%) | Utilization (%) |
1 | Front & pocket o/l | 24.1 | 21.2 | 1.8 | 2.0 | 2 | 339 | 299 | 299 | 233 | 66 | 22 | 69 |
2 | Facing tack | 12.6 | 11.3 | 1.0 | 1.0 | 1 | 317 | 286 | 286 | 228 | 57 | 20 | 72 |
9 | Flap attach | 24 | 21.6 | 1.9 | 1.5 | 2 | 333 | 225 | 300 | 245 | 55 | 19 | 73 |
11 | Patch Attach | 24 | 21.6 | 1.9 | 2.0 | 2 | 333 | 300 | 300 | 249 | 51 | 17 | 75 |
12 | Run Collar | 23.2 | 20.4 | 1.7 | 1.0 | 2 | 353 | 155 | 310 | 267 | 44 | 14 | 76 |
14 | Topstitch Collar | 30 | 27.0 | 2.5 | 2.5 | 2 | 267 | 300 | 240 | 224 | 16 | 6.8 | 84 |
17 | Flap Top stitch | 30 | 27.0 | 2.3 | 2.0 | 2 | 267 | 240 | 240 | 231 | 9 | 3.9 | 86 |
18 | B/Hole Flap | 12 | 10.2 | 1.0 | 1.0 | 1 | 353 | 300 | 300 | 259 | 41 | 14 | 73 |
19 | Sleeve rolling | 13 | 11.7 | 1.0 | 1.0 | 1 | 308 | 277 | 277 | 247 | 30 | 11 | 80 |
23 | Join Shoulder | 15 | 13.2 | 1.2 | 1.0 | 1 | 273 | 240 | 240 | 213 | 27 | 11 | 78 |
25 | Attach sleeve | 19 | 16.7 | 1.5 | 1.5 | 1.5 | 323 | 284 | 284 | 253 | 31 | 11 | 78 |
26 | Label attach | 21 | 18.9 | 1.7 | 2.0 | 1.5 | 286 | 343 | 257 | 232 | 25 | 9.8 | 81 |
29 | Close collar | 29 | 26.1 | 2.3 | 2.0 | 2 | 276 | 248 | 248 | 245 | 3 | 1.2 | 89 |
30 | Sleeve tack | 24 | 21.6 | 2.1 | 2.0 | 1.7 | 278 | 300 | 251 | 243 | 7 | 2.9 | 87 |
33 | Side seam | 24 | 21.1 | 1.9 | 2.0 | 1.7 | 285 | 300 | 251 | 240 | 10 | 4.2 | 84 |
35 | Hem Bottom | 30 | 27.0 | 2.3 | 2.5 | 2 | 267 | 300 | 240 | 240 | 0 | 0.0 | 90 |
36 | Button hole Front | 24 | 20.4 | 2.0 | 2.0 | 1.7 | 295 | 300 | 251 | 245 | 5 | 2.1 | 83 |
38 | Body bar tack | 30 | 26.1 | 2.4 | 2.0 | 2 | 276 | 240 | 240 | 240 | 0 | 0.0 | 87 |
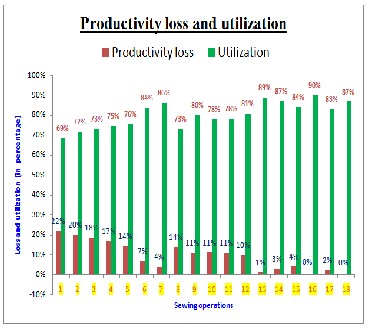
Figure 4: productivity loss and utilization (In percentage)
Table 5: Productivity variation and fluctuation with time
(Before lunch hour)
Worker number | Target | 8:00- 8:30 | 8:30- 9:00 | 9:00- 9:30 | 9:30- 10:0 | 10:0- 10:3 | 10:3- 11:0 | 11:0- 11:3 | 11:3- 12:0 | 12:0- 12:3 | 12:3- 01:0 |
1 | 299 | 90 | 100 | 100 | 110 | 120 | 120 | 115 | 120 | 110 | 100 |
2 | 286 | 88 | 98 | 98 | 108 | 118 | 118 | 113 | 118 | 108 | 98 |
9 | 300 | 95 | 105 | 105 | 116 | 126 | 126 | 121 | 126 | 116 | 105 |
11 | 300 | 96 | 107 | 107 | 118 | 128 | 128 | 123 | 128 | 118 | 107 |
12 | 310 | 103 | 114 | 114 | 126 | 137 | 137 | 132 | 137 | 126 | 114 |
14 | 240 | 86 | 96 | 96 | 106 | 115 | 115 | 110 | 115 | 106 | 96 |
17 | 240 | 89 | 99 | 99 | 109 | 119 | 119 | 114 | 119 | 109 | 99 |
18 | 300 | 100 | 111 | 111 | 122 | 133 | 133 | 128 | 133 | 122 | 111 |
19 | 277 | 95 | 106 | 106 | 117 | 127 | 127 | 122 | 127 | 117 | 106 |
23 | 240 | 82 | 92 | 92 | 101 | 110 | 110 | 105 | 110 | 101 | 92 |
25 | 284 | 98 | 109 | 109 | 120 | 130 | 130 | 125 | 130 | 120 | 109 |
26 | 257 | 90 | 100 | 100 | 109 | 119 | 119 | 114 | 119 | 109 | 100 |
29 | 248 | 95 | 105 | 105 | 116 | 126 | 126 | 121 | 126 | 116 | 105 |
30 | 251 | 94 | 104 | 104 | 115 | 125 | 125 | 120 | 125 | 115 | 104 |
33 | 251 | 93 | 103 | 103 | 113 | 124 | 124 | 118 | 124 | 113 | 103 |
35 | 240 | 93 | 103 | 103 | 113 | 124 | 124 | 118 | 124 | 113 | 103 |
36 | 251 | 90 | 105 | 105 | 116 | 127 | 127 | 121 | 127 | 116 | 105 |
38 | 240 | 94 | 103 | 103 | 113 | 124 | 124 | 118 | 124 | 113 | 103 |
Table 5: Productivity variation and fluctua- tion with time (After lunch hour)
IJSER © 2011
International Journal of Scientific & Engineering Research Volume 2, Issue 11, November-2011 8
ISSN 2229-5518

Figure 5: Fluctuation of productivity with time
In table 5, it is clear shown that for the same sewing operation productivity varies time to time due to fatigue and other re- sons. Data are collected for each operation in half hourly basis from start at 8:00 am and finished at 5:00 pm with one hour lunch break from 01:00 pm to 02:00 pm in a normal working hour.
In figure 5, three operations are selected to show the fluctua- tion of productivity with time to time. The operations are front and pocket overlock, facing tack and flap attach.The same col- or bar chart indicates variability of productivity in the normal working hour with half an hour time interval.
Because of increasing competition in apparel products in the global market, it is very important for apparel manufacturing industries to maintain the demand and deadline of shipments. In most of the assembly lines in the apparel industries, work- ers are not placed based on their skill which reduces produc- tivity and deteriorates deadline of shipments with increasing costs. This work is carried out for the purpose of analysis and development a frame work for improving productivity based on the performance of the workers. To develop the framework time study, fatigue study, worker performance has been stu- died. Bottleneck point’s time can be reduced by placing effi- cient workers at the bottleneck points. Number of total work- ers required in the assembly lines can be reduced by placing efficient workers at the bottleneck points. Productivity loss due to fatigue only depends on the nature of performance of workers assigned at the bottleneck points and it can not be reduced after a certain limit. Maximum production capacity can be found with lowest loss in the bottleneck points. It is
clear that worker’s physical fatigue can be reducing to an ex- tent by improving source of physical fatigue such as lighting, ventilation, sufficient space allocation, keeping lower label of noise etc. It incurs some additional cost to the product and the main goal of any apparel industries are not only to provide service but also profit. If the additional cost is very high com- pare to the improvement of productivity, it is not wise to ex- pense to develop the environment of workplace. It is neces- sary to examine the relationship between improvements of productivity and increase in the costs. To compensate for the fewer workers, overtime hours worked by industrial hourly workers have been on a steady increase for years which in- creases in physical fatigue can lead to a decrease in the quality of the produced goods. A future study can be carried out to find the profitability comparing the productivity, additional costs and quality.
I would like thank to Noman Fashion Fabrics Limited apparel industry, under Noman Group, Pagar, Tongi, Gazipur-1710, Bangladesh to there good support to collect data and coopera- tion of the management. (Web address of Noman Group is http://www.nomangroup.com)
[1] Shepard.E and Clifton.T, “Are longer hours reducing productivity in manu-
facturing?”, International Journal of manpower, Vol.21, pp.540-533
[2] Savage. M and Pipkins. D,”The effect of Rest Periods on Hand Fatigue and
Productivity”Journal of Industrial Technology, Vol. 22, pp.1-6
[3] Fallentin. N, Viikari-Juntura. E, Waerested. M and kilborn. A,”Evaluation of physical workload standards and guide lines from a Noradic perspec- tive”Scand J work eviron health, Vol 2, pp.3-53
[4] Tanabe. S, Nishihara. N and Heneda. M,”Indoor temperature, productivity
and fatigue in office task” HVAC & R Research, Vol 10, pp.120-135
[5] Leilanie. J,”Perceived Job Stress of women workers in Diverse Manufacturing Industries”, Wiley Periodicals. Inc, Human Factors and Ergonomics in Manu- facturing, Vol.15(3), pp.257-291
[6] Dragcevic. Z, Zavec. D, Rogale. D and Gersak. J,”Workloads and standard time
Norms in Garment Engineering”, Journal of Textile and Apparel, Technology
and Management, Vol 2(2), pp.1-8
[7] Hanna. A, Chang. C, Sullivan. K and Lackney. J,”Impact of Shift Work on labor
Productivity for Labor Intensive Contractor”, J. Constr. Engrg. And Mgmt. 134,
197; doi:10.1061/(ASCE)0733-9364;134:3(197)
[8] Harris. A, Thomas. S and William. B,”Do Long Workhours Impact health, Safety and Productivity at a Heavy Manufacturer”, Journal of Occupational and Environmental Medicine, Vol 49, No. 2.
[9] Thomas. R and raynar. K,”Quantitave analysis on scheduled overtime and
lobor productivity”, Journal of construction Engineering and Management, vol.
123, No.2. Allen, Harris M. Jr Ph D; Slavin, Thomas MS, MBA; Bunn, William B. III MD, JD, MPH
IJSER © 2011