characterizes luminous ambience as “the result of an interac- tion between a light, a space, and a use”. This interaction influences the perception and the feel of the illuminated space. [1].
International Journal of Scientific & Engineering Research, Volume 4, Issue 4, April‐2013 1211
ISSN 2229‐5518
Study of the effect of Luminous Ambience in an
IT Company at Nagpur, India.
Ar. Medha Pophale, Dr. Alpana Dongre
Abstract— Architecture is experienced with all our senses including vision. We adapt our vision to available light. The ability of users to adapt to changing dynamic conditions of the environment around them is very important. Other than lending visual capabilities, lighting has other quality – aesthetic and emotional. Light is an extremely efficient way of altering perception. Daylight and controlled artificial lighting are not only able to affect physical attributes of design but also provoke different visual and emotional experiences. Light constitutes an element of fundamental relevance for the design of spaces and therefore it plays a significant role in architecture. It has been researched upon extensively that lighting levels have significant effect on human performance. We can think that human performance varies in different luminous ambiences. Thus we can understand that light, space and function has effect on the human mind. Luminous ambience is defined as the part played by light in the way an environment influences a subject. The paper discusses the effect of luminous ambience through a study at an IT company at Nagpur.
Keywords— lighting, lighting standards, lighting levels, luminous ambience, visual performance, workspace illumination, visual quality.
—————————— ——————————
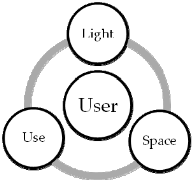
uminous ambience is defined as the part played by light in the way an environment influences a subject. Defini- tion of luminous ambience, made by Narboni who
characterizes luminous ambience as “the result of an interac- tion between a light, a space, and a use”. This interaction influences the perception and the feel of the illuminated space. [1].
Light levels thus can have an effect on the user’s mood, health and well being, performance and how he perceives the space.
A study was done to know the effect of existing light levels in a workspace on employees of an IT (Information Technology) company. The office is located at the city of Nagpur, Maha-
————————————————
Dr. Alpana Dongre is currently Head of Department of Architecture & Planning at Visvesvaraya National Institute of Technology, India.
rashtra state in India. The geographic coordinates of Nagpur are Latitude: 21.155760, Longitude: 79.089111. The city of Nagpur lies in the time zone of India Standard Time (IST), offset UTC/GMT +5:30 hours. There is no daylight savings iime in 2012.
The selected IT office works in the field of software develop- ment, testing and maintenance on computers. Working pat- tern of the employees is of 45 hrs for working days in a week. The age group of the studied sample is 54% of 20- 25yrs; and
87% of 20- 30 yrs. So the user group studied is young. The ra-
tio of male to female users is 2.5:1 i.e. there is twice the num-
ber of male to female users.
The selected workspace is a multiple floors space having a standard layout on all the floors with an open plan office con- sisting of cubicles with partition of 1.35 meter height. Quanti- tavive data comprising of ambient light levels, desktop light levels and the same along the walls and partitions was meas- ured with the help of lightmeter Lutron LX- 101 A. Qualita- tive data pertaining to the subjective opinions of the users was collected through a questionnaire survey of 140 employees on a five point likert scale. Quantitative and qualitative analysis has been performed.
The paper focuses on various factors as mentioned below:
Comparison between luminance levels recommended
by Standards, literature reviewed papers and their
comparison with measured lighting levels
Study of lighting for visual performance
Study of the quantitative parameter (light levels) and
qualitative parameters like glare, work efficiency,
mood, health (with the focus on fatigue and eye
strain) & well- being
Office employees’ preference of lighting and aesthetic
judgements (assessments of the appearance of the
IJSER © 2013 http://www.ijser.org
International Journal of Scientific & Engineering Research, Volume 4, Issue 4, April‐2013 1212
ISSN 2229‐5518
space or the lighting).
Visual quality is one of the important judging criteria for any space. It varies with various factors such as the illuminance levels on the surface of objects and walls, their colour, texture and reflectance factors. It is a subjective quality and hence ex- perimentation and surveys help to prove it. Visual quality of a space is closely connected to visual performance which differs according to subjects; their age, gender, eye efficiency etc. Vis- ual performance is defined in terms of the speed and accuracy of processing visual information [2]. Level of illumination is important while calculating visual performance.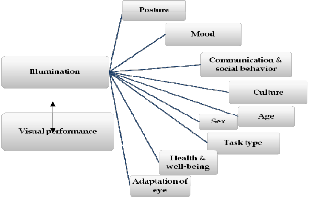
Lighting quality is much more than just providing an appro-
priate quantity of light. Veitch and Newsham (1998) gave the
other factors that are potential contributors to lighting quality
include e.g. illuminance uniformity, luminance distributions,
light color characteristics and glare. Lighting quality is defined
as the degree to which the luminous environment supports
the following requirements of the people who will use the
space:
• Visual performance
• Post- visual performance (task performance and be-
havioural effects other than vision);
• Social interaction and communication;
• Mood state (happiness, alertness, satisfaction, prefer-
ence);
• Health and safety;
• Aesthetic judgements (assessments of the appearance
of the space or the lighting) [3].
Blackwell 1959, Boyce 1973, Rea & Quellette 1991 gave 4 vari-
ables- luminance, task/ background contrast, task size, age of
observer; for the visual performance model. Here the Rela-
tionship between luminance and visual performance was test-
ed. Visibility refers to these variables. Colombo, Kushbaun,
Raitelli 1987 suggested the 5th variable- blur. Guth 1970, Steln,
Reynolds & McGuinness 1986 differentiated the issues of
lighting quantity and quality. Though there is a broad range of
acceptable light levels (illuminance) that provide adequate
quantity of illumination; quality of it has an effect on visual performance. However the study of Rea, Ouellette, and Ken- nedy (1985) gives that posture is related to visual performance and hence is important for offices/ workplaces. Aesthetic im- pressions or appearance of various luminous conditions of a space affect visual performance. This study is done by Flynn, Hendrick, Spencer, & Martyniuk, 1973 &1979 by using Multi- dimensional scaling to identify three dimensions (“lighting modes”) that accounted for the judgements of similarity or difference: uniformity, brightness, and overhead/ peripheral [4].
‘Acceptable Illumination Levels for Office occupants’ [5] examined the acceptable horizontal illumination levels in an office envi- ronment by interviewing occupants about the visual environ- ment perceived in all classes of office buildings in Hong Kong. The subjective evaluation of the office visual environment was correlated to the measured horizontal illumination level and mathematical expressions were proposed for the overall ac- ceptability of the illumination level. The acceptable illumina- tion level Φ as determined from equation was 518 lux.
The study of ‘The Effect of Adaptation Levels and Daylight Glare
on Office Workers' Perception of Lighting Quality in Open Plan Offices’ [6] stressed on the adaptation levels to isolate causes of dissatisfaction within the large open plan office environment. It was hypothesized that the adaptation level would be a sig- nificant influence on peoples' perceptions of their visual envi- ronment. Field study was done for offices in Sydney. Mean adaptation luminance was found to be of 131 lux.
Boyce (1973) carried out a study in to the effect of age on visu- al performance and showed that significant improvement in performance is seen to perform a visual task, when luminance is raised from 500lux to 700lux for subjects in the age of 46 to
60 years.
As per Indian Standards; IS 3646 (Part I): 1992, code of practice for interior illumination, given by BIS Bureau of Indian Stand- ards; the range of service illuminance in lux for type of interior or activity of computer work stations is 300-500-750 lux [7]. IES (Illuminating Engineering Society of North America) has recommended illumination level of 500 lux [8] for computer rooms of offices and shops whereas the MS 1525 recommenda- tion for the same is 300- 400 lux. As per BEE (Bureau of Energy Efficiency), the minimum service illuminance on the task of general lighting for interiors should be 200 lux [9]. Uniformity of luminance (minimum/average) over any task area and im- mediate surrounding should not be less than 0.8.
Illumination levels (in lux) were measured at different time of day on walls, worksurface and general illumination at differ-
IJSER © 2013 http://www.ijser.org
International Journal of Scientific & Engineering Research, Volume 4, Issue 4, April‐2013 1213
ISSN 2229‐5518
ent floors. Two sets of readings at 1100 hrs and 1730 hrs were taken for accuracy and to notice any difference in indoor light- ing levels. Measurements on first and fourth floor were taken to explore the impact on illumination of different levels and evaluate the association. Correlation is eatabished between light levels of first and fourth floors at 5% level of significance. Measured light levels of the office:
Average of general illumination of first floor at 11 am =
132.5 lux
Average of general illumination of first floor at 5:30 pm =
117.6 lux
Average of general illumination of fourth floor at 11 am =
143.7 lux
Average of general illumination of fourth floor at 5:30 pm =
134.4 lux
Mean illumination levels found from the study is 132 lux.
A questionnaire was given to 140 office employees. 80% of the
users spend an average of 8 hours in front of computer screen
daily. From the study it is found that
1. 73% of the users judged that having control of light-
ing for brightness adjustment can affect their work ef-
ficiency, mood or both (Fig. 3).
2. Almost 50% of the users experience fatigue due to less
light (Fig. 4).
3. 23% of the users have experienced increase in their
spectacle power while working in this office.
4. 29% experience glare spots in their work area. 21%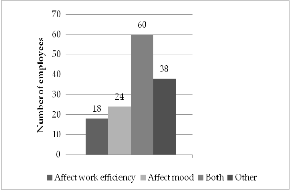
users work in cubicles near window.
1. 71% of the users find the space ‘sufficiently bright’.
17% find it ‘less bright’ while 10% think that the space
is ‘excessively bright’ (Fig. 5).
2. 87% users replied that they work in the same lighting
conditions from morning to evening. 13% replied that
the lighting conditions change through the day. 21%
users sit near window/ opening. This difference of
8% in the replies indicate that there is no effect of
window/opening on light levels or the users do not
realize the effect of window/ opening on their seating
location.
3. 56% of users would like change in lighting conditions
through the day.
4. 79% of the users do not sit near window/ openings.
But 67% wish to sit near window. The reason given
by max users (77%) being the availability of more
light near window. 52% would like to see outside.
They may need to break from the monotony of the of-
fice setting. Some of the office employees feel very en-
thusiastic and good while working near window.
Some like to connect visually with the outside world.
Constant monitor use causes fatigue. It provides good
change to the eyes. The space feels big psychological-
ly. There is sufficient light near window; saves elec-
tricity.
5. Light plays an important factor with respect to the
users’ comfort/ discomfort as 57% of the users have
rated it above 4 and 97% above 3 on a likert scale of 1-
5; 5 being most important (Fig. 6).
IJSER © 2013
International Journal of Scientific & Engineering Research, Volume 4, Issue 4, April‐2013 1214
ISSN 2229‐5518
Statistical analysis on the qualitative data was performed for fatigue, spectacle power, work efficiency, mood, hours of work and years of service. It was found from chi square test for independence of attributes that, fatigue caused is depend- ent on light levels at 5% level of significance, df (degrees of freedom)= 2 and so is hours of work; df= 8.
The paper has investigated the subjective and objective pa- rameters through a questionnaire, supported by actual physi- cal measurements which have shown considerable correlation in the ratings given by the occupants. On the basis of the liter- ature study done, the paper has tried to establish a correlation between workspace lighting and its impact on the user wheth- er positive or negative. It has dealt a quantitative (objective) and qualitative (subjective) analysis systematically and effi- ciently. The linking of parameters as work efficiency, mood, fatigue and health through lighting conditions does help in giving concrete outline measures such as improvement in task performance and general well being of the individual.
The factor of illumination creates a direct impact on the health and well-being of the occupant. Overall the mean lux levels show a range between 130 to 160 lux, which is less as per the standards given in BEE for task lighting in a workspace as 400 to 450 lux.
The results confirmed that the occupants' acceptability and adaptability was significantly influenced by the office illumi- nation level. Luminous ambience has effect on an individual which results in change of the user’s mood, health and well being, performance and how he perceives the space.
The authors wish to thank the IT company at Nagpur for its consent to carry out the survey and take readings on site.
[1] Narboni, R. (2006). Lumière et ambiances: concevoir des éclairages pour l'architecture et la ville. Le Moniteur, Paris.
[2] Mark S. Rea, M. A. (n.d.). Relative visual performance: A basis for application. SAGE Journal.
[3] Veitch, J. A., & Newsham, G. R. Determinants of lighting quality II: Research and recommendations. American Psychological Associa- tion. Toronto.
[4] Veitch, J. A., & Newsham, G. R. (1996). Determinants of Lighting Quality I: State of the Science. The 1996 Annual Conference of the Il- luminating Engineering Society of North America. Cleveland, OH.
[5] Mui, K. W., & Wong, L. T. (2005). Acceptable Illumination Levels for
Office occupants. Architectural science Review, 49.2, 116-119.
[6] Speed, R. (2005). The Effect of Adaptation Levels and Daylight Glare on Office Workers' Perception of Lighting Quality in Open Plan Of- fices. Architectural Science Review Vol 48, 48, 229-238.
[7] (n.d.). Retrieved from www.scribd.com:
http://www.scribd.com/doc/92187095/IS-3646-1 [8] (n.d.). Retrieved from www.iesna.org.
[9] BEE. (2006). Best practice manual of lighting.
IJSER © 2013 http://www.ijser.org