International Journal of Scientific & Engineering Research Volume 4, Issue 1, January-2013 1
ISSN 2229-5518
Study of IQS & Improvement in Harvester Combine IQS Score by TQM Approach: A Case Study of Harvester Combine SWARAJ – 8100
Model
Harish C. Tiwari, Sarabjot S. Mann
Abstract— IQS stands for Initial Quality Study. It is the evaluation of the product by customer’s point of view when final product comes af- ter manufacturing & is ready for dispatch. In IQS, all defects are recorded aggregate wise & overall IQS Score is generated. This is called Demerit score whenever it is discussed about improvement in IQS. TQM approach is followed for IQS score improvement in Harvester combine. Swaraj Division, Plant -2, Mahindra & Mahindra Limited manufactures Tractors, Harvester combine & Forklift. This plant has a capacity to produce 500 Harvester Combines per year. IQS is done on tractor & Harvester combine. Forklift excludes from IQS. Tractor & Harvester combine have IQS score if 106 & 3406 respectively. So, harvester combine was selected for improvement as it has high score as compared to tractor. In this work, using TQM methodology, data was collected from IQS. Major defects were identified by Pareto analy- sis in three aggregates i.e. HPU, Supplies & Design. Cause & Effect analysis was done for major defects to find out probable causes. Pos- sible causes were identified from probable causes using technical skills, knowledge and experience. Possible causes were tested hypo- thetically by actual measurements and analysis. Corrective action plans were made for the valid causes. After observing and analyzing re- sults, correction procedures were standardized and implemented. Overall IQS score of HC from major 14 defects of three aggregates were identified from Pareto analysis, reduced from 2119 to 1109, having 48% improvement. HPU score of major 5 defects identified from Pareto analysis, reduced from 1016 to 700, having 31% improvement. Similarly, Supplies and Design score reduced from 753 to 409 having 46% improvement and from 350 to 0, by eliminating all 4 defects respectively.
Index Terms— Applying TQM Methodology for Improvement in IQS Score, Demerit Score of a Product for Defects, Initial Quality Study
(IQS), Pareto Analysis, Root Cause Analysis, Testing Hypothesis & Implementation of Corrective Action Plan.Testing Results.
—————————— ——————————
1. INTRODCUTION
QS stands for Initial Quality Study. It is the evaluation of the product by customer’s point of view, taking performance as well as appearance into consideration. Let us take an exam- ple of a car, which is bought by the customer, if its perfor- mance like mileage, acceleration & power etc. will not be up to the desired level, customer will not be satisfied even if it has an excellent appearance. Similarly, if the car has an excellent performance, but its appearance is not up to the desired level, than also customer will not be satisfied. Both factors play im- portant role for customer satisfaction & increased sale of the
product.
IQS score is also called demerit score as it is evaluated by the sum up of individual score of all defects. Auditor random- ly selects product from stock yard which is complete in all aspects and is ready to dispatch to the dealer. He notes down
all defects one by one, keeping in view component, category, aggregate, grade and score on an IQS summary sheet. In IQS, there are four steps Selection, Evaluation, Projection & Con- tinuous Improvement.
————————————————
Harish C. Tiwari is currently pursuing M. Tech. program in Production
Engineering Punjab Technical University, Jalandhar, India, PH-
9872045819. E-mail: harishsma@yahoo.com
Sarabjot Singh Mann is currently working as Asstt. Professor in Sri Su-
khmani Institute of Engineering & Technology, Punjab, India, PH-
8427948915.
TQM stands for Total Quality management. TQM is de- fined as a continuous effort by the management as well as employees of a particular organization to ensure long term customer loyalty and customer satisfaction. In last step in IQS i.e. continuous improvement, TQM approach is followed. Pa- reto graphs, Cause & Effect diagram, testing hypothesis, Cor- rective action plan’s implementation & measuring results are the steps used in this methodology.
In this research, in first phase, it is necessary to study the IQS methodology so that we can understand how IQS score is evaluated. In second phase, TQM methodology is used to im- prove the IQS score. These two phases are explained below.
2. STUDY OF IQS
There are two types of audit done in IQS to identify de- fects i.e. Dynamic audit & Static audit. In dynamic audit, those parameters are tested in which Harvester combine has to run like in actual field performance. Dynamic audit includes Roll- er testing which consists of leakage, noise, vibration & system malfunctioning detection & Road testing which consists of checking functions of brakes, clutch, gear box, steering, engine and sub assemblies etc. Static audit includes shower testing, sheet metal, paint, toe-in & hydraulic checking etc. in which Harvester combine is stationary. While performing these two audits, all defect observed are noted in IQS summary sheet. These defects are further summarized component wise, cate-
IJSER © 2013 http://www.ijser.org
International Journal of Scientific & Engineering Research Volume 4, Issue 1, January-2013 3
ISSN 2229-5518


gory wise, aggregate wise, cases wise, grading wise & scoring wise. In IQS of Harvester combine, all defects were divided into three aggregates i.e. HPU (Harvester production unit, Supplies & Design) depending on the source of defect genera- tion. The sum of defects score of a particular aggregate is the sum of that aggregate. The sum of all three aggregates score is the overall IQS score of Harvester combine. To understand IQS procedure, Flow diagrams are shown below

Dynamic audit Static audit
Vehicle selection
Vehicle preparation
Shower testing for water ingress


Sheet metal body
Roller testing
Paint DFT
Fig. 2 IQS Grade Evaluation Criteria
Road testing
Engine & Hydraulics
Defect recording & rat- ing, Score evaluation
Selection of major de- fects, if any
Audit report preparation
Root cause analysis
Preparation of IQS show presentation
HC returned back to
Dispatch Store
Continuous improve- ment
Fig. 3 IQS Scoring Criteria
The score developed through this procedure represents the overall quality of Harvester combine. This demerit score has to be reduced to show improvement.
3. IMPROVEMENT IN IQS SCORE BY TQM METHODOLOGY
As already mentioned, TQM – Total Quality Management approach is very effective in overall quality improvement of a
Fig. 1 Flow Diagram for IQS
IQS has standard criteria for grading & scoring of defects as shown in Fig. 2 & Fig. 3 respectively. Each defect is graded as per its criticality, location and weightage. Grading is helpful in scoring a defect. There are 10 grades i.e. G1 to G10. G1 has highest whereas G10 has minimum scoring. Monitoring range of Harvester combine was G5 to G6.
product or service. Initially, it was implemented in manufac- turing sector but later, it was also implemented on service sec- tor. In this research, various TQM tools have been applied to improve quality of Harvester combine by reducing IQS score through focusing on major identified defects.
At the start of this research, when data was collected, over- all IQS score of Harvester combine observed was 3406. It is shown by Fig. 4. This score was sum of the score of three ag- gregates i.e. HPU, Supplies & Design having 1684, 1057 & 665 score respectively. It is shown by Pie chart in Fig. 5
IJSER © 2013 http://www.ijser.org
International Journal of Scientific & Engineering Research Volume 4, Issue 1, January-2013 4

ISSN 2229-5518
IQS SCORE - HARVESTER COMBINE
5000
(Score – 100, 6%). These five defects cover 60% score of total

HPU defects and selected for further analysis.
4000
3000
2000
1000
3406
0
OCT. 2011
MONTH
Fig. 4 IQS Score – Overall
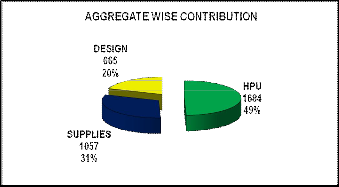
Fig. 5 IQS Aggregate wise Score
Further, Pareto graph was made from individual score of each aggregate. Major defects were identified from these ag- gregates.
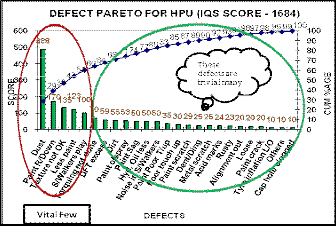
Fig. 6 Defect Pareto for HPU
Inference: Top five HPU defects were Dust (Score-488, 29%), Paint rundown (Score -147, 10%), Texture not ok (Score – 135,
8%), Less paint (Score – 123, 7%) and Straw walkers play
Fig. 7 Defect Pareto for Supplies
Inference: Top four Supplies defects were Excessive buff marks (Score – 242, 23%), welding spatters (Score – 211, 20%), dents/ding (Score – 166, 16%) and welding spots (Score – 134,
12%), These five defects cover 71% score of total Supplies de- fects and selected for further analysis.
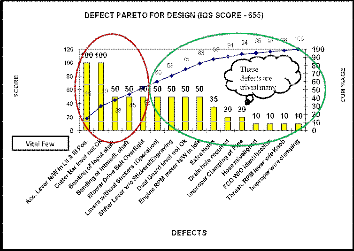
Fig. 8 Defect Pareto for Design
Inference: Top five Design defects were Accelerator lever not working in I, II & III position (Score – 100, 15%), cutter bar level not ok (Score – 100, 15%), bending of input shaft (Score –
50, 8%), bending of intermediate shaft (Score – 50, 7%) and blower shaft over tight (Score – 50, 7%).
Cause & Effect diagrams of major identified defects were made for Root cause analysis.Each C & E diagrams has been divided into four factors i.e. Man, Machine, Method & Materi- al. Every suggested cause of defect has been put to a particular factor from above mentioned. These causes are called probable causes suggested during brainstorming session between the team members. Revised C & E diagrams were made after de- leting invalid possible causes after discussion between tech- nical, skilled & experienced members of the team. Some of C & E diagrams of selected 14 defects are shown below:
IJSER © 2013 http://www.ijser.org
International Journal of Scientific & Engineering Research Volume 4, Issue 1, January-2013 5
ISSN 2229-5518

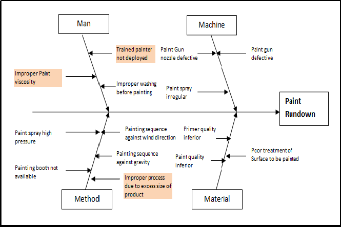
Fig. 9 Cause & Effect diagram – Dust (HPU) Inference: Paint gun mixes dust, improper enclosure of paint area, exhaust fans for ventilation not working, window glasses broken through which dust entered into paint area & cleaning schedule of paint equipments not implemented & followed were valid causes for Dust in paint.
Fig. 10 Cause & Effect diagram – Paint rundown (HPU) Inference: Improper paint viscosity, trained painters not de- ployed & improper process of painting due to excess size of product were valid causes for paint rundown.
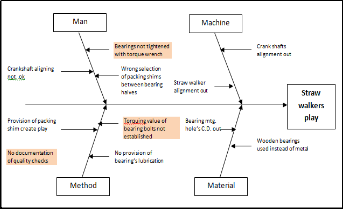
Fig. 11 Cause & Effect diagram – Straw walker’s play (HPU) Inference: Straw walker’s bearings not tightened with torque wrench due to non establishment of torque value & no quality check reports were valid causes for straw walker’s play.
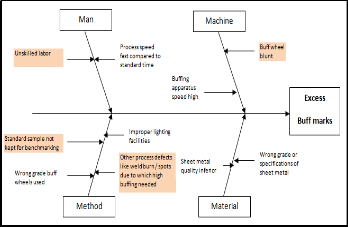
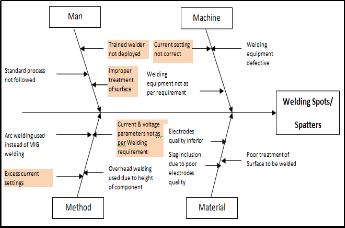
Fig. 12 Cause & Effect diagram–Excess buff marks (Supplies) Inference: Unskilled labor, buff wheel blunt, standard sample for benchmarking at supplier end & excess welding bead were valid causes for excess buff marks.
Fig. 13 Cause & Effect diagram – Welding spots/spatters
(Supplies)
Inference: Trained welder not deployed, Improper dressing of surface & current setting not correct were valid causes for welding spots/spatters.
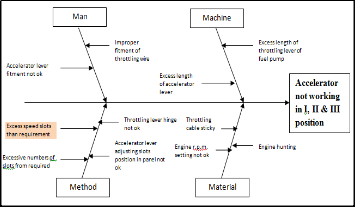
Fig. 14 Cause & Effect diagram – Accelerator not working in
I, II & III position (Design)
Inference: Excess slots than requirement i.e. only three slots were sufficient for speed variation Harvester combine as it is operated in fields or on roads. Moreover, it has hi-lo gear also
IJSER © 2013 http://www.ijser.org
International Journal of Scientific & Engineering Research Volume 4, Issue 1, January-2013 6
ISSN 2229-5518
by which three speeds can be operated in six speeds by engag- ing hi-lo gear.
fects were looked after by Buy, Vendor Development Cell & Quality. Design defects have to be solved by R&D, Quality & Buy.
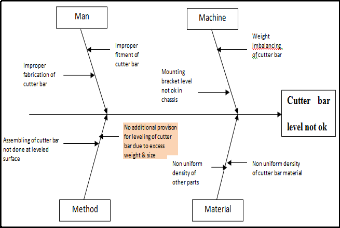
Table 2: Supplies – Improvement action plan
Fig. 15 Cause & Effect diagram – Cutter bar level not ok (De- sign)
Inference: Due to excess width i.e. 4.2 meters & heavy weight i.e. 1000 kg; it was difficult for alignment of LHS & RHS of cutter bar between 20 mm.
After root cause analysis of 14 defects, it was observed that most of the defects were due to improper procedures or meth- ods. It can also be verified by C & E diagrams of defects, in which most of the valid causes are lying on method factor. Corrective action plans were developed for three aggregates. These corrected procedures and method were implemented.
Table 1: HPU – Improvement action plan
Inference: In table 1, action plan is shown & it becomes clear- er that what were the valid causes, old methods, corrective methods, implemented by which team & the results of these methods after implementation, of a particular defect. Here only 3 defects were shown as it was difficult to show all five defects in this research paper. Similarly, Supplies & Design action plans are also shown in table 2 & 3 respectively.
In HPU defects, there were mainly three departments’ in- volvement i.e. Production, Quality & Ind. Engg. Supplies de-
Table 3: Design – Improvement action plan
4. RESULTS
In TQM methodology, improvements are proved with re-
sults, which should be measurable. In this research, IQS score
is measurable to show improvements. Here, various graphs
show the results which are discussed one by one.
First of all 14 major defects of three aggregates are shown
graphically. IQS score is a demerit score thus Improvement
trend will be there, if score line will decline or slopes down-
wards in the graph.
IJSER © 2013 http://www.ijser.org
International Journal of Scientific & Engineering Research Volume 4, Issue 1, January-2013 7
ISSN 2229-5518

Inference: All design defects were eliminated showing drastic improvement. It was due to the acceptability of need for product development by company.
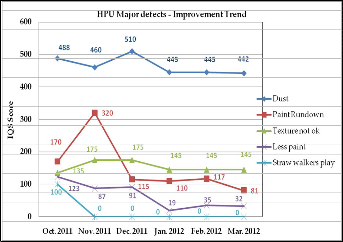
Fig. 16 HPU Defects – Improvement trend Inference: Paint rundown, less paint & Straw walker’s play defects have downward trend proving improvement, while Dust & Texture not ok didn’t improved significantly due to traditional paint facility and scarcity of trained painter.
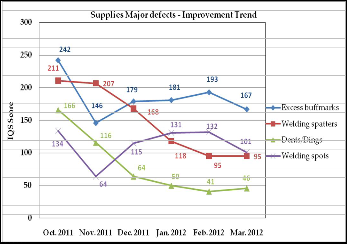
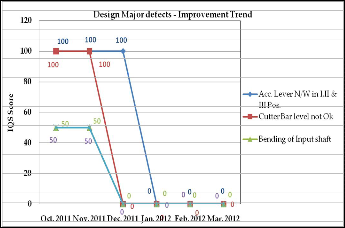
Fig. 17 Supplies Defects – Improvement trend Inference: Excess buff marks, welding spatters & dents/dings defects have downward trend proving improvement, while welding spots didn’t improved significantly due to improper welding practices & lack of trained labor at supplier end.
Fig. 18 Design Defects – Improvement trend
Fig. 19 HPU IQS Score – Improvement trend Inference: IQS score of 5 HPU major defects was reduced from 1016 to 700, securing 31% improvement.
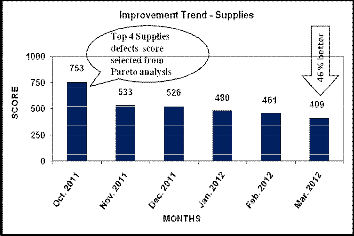
Fig. 20 Supplies IQS Score – Improvement trend Inference: IQS score of 4 Supplies major defects was reduced from 753 to 409, securing 46% improvement.
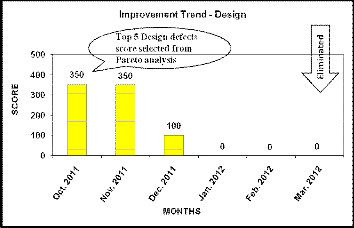
Fig. 21 Design IQS Score – Improvement trend
Inference: IQS score of 5 Design major defects was reduced
IJSER © 2013 http://www.ijser.org
International Journal of Scientific & Engineering Research Volume 4, Issue 1, January-2013 8
ISSN 2229-5518
from 350 to 0, eliminating all 5 defects.
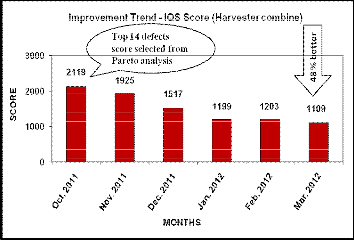
Fig. 22 Overall IQS Score – Improvement trend Inference: Overall IQS score of 14 major defects was reduced from 2119 to 1109, securing 48% improvement.
5. DISCUSSION
I. Dust defect reduced from 488 to 442 score having 9.5% improvement. Dust defect didn’t improve much, in spite of all possible solutions due to incomplete enclosure of paint area. Dust was entering above the fiber partition where as in a paint booth, if provided, there is a controlled atmosphere.
II. Paint rundown defect reduced from 170 to 81 score hav- ing 52% improvement. It was due to the training provided to the new/semi skilled painter, paint viscosity control and in- troduction of elevator for painting at elevated position of HC.
III. Texture not ok defect increased from 135 to 145 score having - 7.5% improvement. All solutions implemented except required paint drying time. It was due to high dispatch pres- sure and lack of open space for paint drying. HC was stored under shed area where sunlight couldn’t come and moisture disturbs the texture of paint.
IV. Less paint defect reduced from 123 to 32 score having
74% improvement. Due to identical color of paint and primer
i.e. cream, the painter had difficulty to identify paint layer on
primer, improper masking system caused area left unpainted
and unskilled manpower were major issues for this defect
V. Straw walkers play defect reduced from 100 to 0 score
having 100% improvements. In assembly during analysis, it
was observed that there was no documentation of critical
quality checks due to which workmen don’t have fear for pen-
alties against loose work. Travel History card was developed
and implemented on each HC so that workman can be traced
out due to which problems appear at any stage or in field.
VI. Excess buff marks defect reduced from 242 to 167 score
having 31% improvements. High current settings during
welding lead to thick bead weld. It was dressed by blunt buff-
ing wheel which was not replaced after its standard time. Due
to this, buff marks appear on welding portion. Standard sam-
ple for reference also kept at supplier end. Training of man-
power, supplier visit and technical supervisor ensured at sup-
plier end.
VII. Welding spatters defect reduced from 211 to score 95
having 55% improvement. Excess are length during welding by untrained welder, poor surface preparation before welding and dress up after welding and improper current settings were major causes of this defect.
VIII. Dents/Dings defect reduced from 166 to 46 score hav- ing 72% improvements. Poor handling, improper bins, no capping provisions for aesthetic area of components and poor transportation were the major causes of this defect. Safety caps and cover of thermocol implemented on sheet metal compo- nents.
IX. Welding spots defect reduced from 134 to 101 score hav- ing 25% improvements. This defect has same reasons as of welding spatters in addition, sheet metal having less thickness used by supplier than required.
X. Accelerator not working in I, II & III position defect re- duced from 100 to 0 score having 100% improvement. There were five slots in panel for various speeds of HC. Engine sup- plied by Ashok Leyland which is supplied to various HC manufacturers, having limited throttling as specific require- ment of HC. It runs in fields with low speed and on road with full speed. So, two slots were deleted in panel. Now, only three slots provided for speed adjustment
XI. Cutter bar level not ok defect reduced from 100 to 0 score having 100% improvement. Cutter bar having 4.2 meters length and 1000 kg weight is being fitted on HC at two brack- ets. Due to this, it was very difficult to level it within required limits i.e. L.H.S should be only 20 mm up from R.H.S. Packing shims implemented between cutter bar and its mounting brackets of various thickness to level it.
XII. Bending of Input shaft defect reduced from 50 to 0 score having 100% improvement. Due to overhang of input shaft from chassis and heavy pulley mounting on it, during high speed, shaft bend up to 6 to 10 mm. various field failure re- ported of input shaft due to this reason. Foot step bearing im- plemented at end on input shaft to restrict the bending.
XIII. Bending of intermediate shaft defect reduced from 50 to
0 score having 100% improvement. This defect was linked with bending of input shaft as same belt rotates the both shafts.
XIV. Blower shaft over tight defect reduced from 50 to 0 score having 100% improvement. C-60 belt implemented which is exactly fit on this pulley instead of C-61. Previous belt was over tight even after disengaging tension pulley from it.
6. CONCLUSION
In this research, it has been observed that the overall quality of a product can be improved by TQM approach. This work con- cludes following outcomes.
I. Overall IQS score of HC from top fourteen defects of three aggregates, identified by Pareto analysis, reduced from 2119 to
1109 score having 48% improvement.
II. HPU score of top five defects identified by Pareto analy-
sis, reduced from 1016 to 700 score having 31% improvement.
Similarly, Supplies and Design score reduced from 753 to 409
score having 46% improvement and from 350 to 0 score elimi-
nating all 4 defects respectively.
III. Conventional & manual paint process for HC and its size
were main factors for HPU defects in IQS.
IJSER © 2013 http://www.ijser.org
International Journal of Scientific & Engineering Research Volume 4, Issue 1, January-2013 9
ISSN 2229-5518
IV. Inadequate infrastructure, equipments, unskilled man- power and lack of managerial expertise at supplier end were the main factors for Supplies defects in IQS.
V. It has been observed from cause & effect diagrams that most of the causes lie in man and method categories. This veri- fies the requirement of improvements in these categories as explained in above two points.
VII. All defects, except dust & texture not ok in HPU and excess buff marks & welding spots have positive improvement trend.
IX. By using TQM methodology, focusing on few large con- tributing defects was done to gain major improvements. This way major part of a problem was eliminated by minimum efforts.
REFERENCES
[1] Anderson, J.C., Rungtusanatham, M., & Schroeder, R.G. (1994), “A theory of quality management underlying the Deming management method”, Academy of Management Review, Vol. 19, 3, 1994, pp. 472–509.
[2] Dean, J.W., & Bowen, D.E. (1994), “Management theory and total quality: Improving research and practice through theory development”, Academy of Management Review, vol. 19, 3, 1994, pp. 392–418.
[3] Dow, D., Swanson, D., & Ford, S. (1999), “Exploding the myth: Do all quality management practices contribute to superior quality performance?”, Production and Opera- tions Management, vol. 8, 1, 1999, pp. 1–27.
[4] Feng, J., Prajogo, D.I., Tan, K.C., & Sohal, A.S. (2006), “The impact of TQM practices on performance: A comparative study between Australian and Singaporean organiza- tions”, European Journal of Innovation Management, vol.
9, 3, 2006, pp. 269–278.
[5] Haar, J.M., & Spell, C.S. (2008), “Predicting total quality
management adoption in New Zealand: The moderating
effect of organizational size”, Journal of Enterprise Infor-
mation Management, vol. 21, 2, 2008, pp. 162–178.
[6] IQS Harvester Combine - Work instructions, Swaraj Divi-
sion (Plant-2), Mahindra & Mahindra Limited, Mohali,
Punjab.
[7] Joseph, I.N., Rajendran, C., & Kamalanabhan, T.J. (1999),
“An instrument for measuring total quality management implementation in manufacturing-based business units in India”, Internal Journal of Production Research, vol. 37,
1999, pp. 2201–2215.
[8] Kruger, V. (1996), “How can a company achieve improved
levels of quality performance: Technology versus employ-
ees?”, The TQM Magazine, vol. 8, 3, 1996, pp.11–20.
[9] Majeske Karl D. (2003), “A mixture model
for automobile warranty data”, Reliability Engineering &
System Safety, Vol. 81, 1, 2003, pp. 71-77.
[10] McAdam, R., Armstrong, G., & Kelly, B. (1998), “Investi-
gation of the relationship between total quality and inno-
vation: A research study involving small organizations”, European Journal of Innovation Management, vol. 1, 3,
1998, pp. 139–147.
[11] Motwani, J. (2001), “Critical factors and performance measures of TQM”, The TQM Magazine, vol. 13, 4, 2001, pp. 292–300.
[12] Prajogo, D.I., & Sohal, A.S. (2003)’ “The multidimensional- ity of TQM practices in determining quality and innova- tion performance – an empirical examination. Technova- tion”, vol. 24, 2003, pp. 443–453.
[13] Prajogo, D.I., & Sohal, A.S. (2006), “The integration of TQM and technology /R&D management in determining quality and innovation performance”, The International Journal of Management Science, Omega, vol. 34, 2006, pp.
296–312.
[14] Pun, K.F. (2001), “Cultural influences of TQM adoption in Chinese enterprises: An empirical study. Total Quality Management”, vol. 12, 3, 2001, pp. 323–342.
[15] Rahman, S., & Bullock, P. (2005), “Soft TQM, hard TQM, and organisational performance relationship: An empiri- cal investigation”, Omega, vol. 33, 2005, pp. 73–83.
[16] Reed, R., Lemark, D.J., & Mero, N.P. (2000), “Total quality management and sustainable competitive advantage”, Journal of Quality Management, vol. 5, 2000, pp. 5–26.
[17] Samson, D., & Terziovski, M. (1999), “The relationship between total quality management practices and opera- tional performance”, Journal of Operations Management, vol. 17, 1999, pp. 393–409.
[18] Sila, I., & Ebrahimpour, M. (2002), “An investigation of
the total quality management survey based research pub-
lished between 1989 and 2000 – a literature review”, In-
ternational Journal of Quality & Reliability Management,
vol. 19, 7, 2002, pp. 902–970. 950 D.T. Hoang et al.
[19] Steingrad, D.S., & Fitzgibbons, D.E. (1993), “A postmod-
ern deconstruction of total quality management”, Journal
of Organization Change Management, vol. 6, 5, 1993, pp.
27–42.
[20] Terziovski, M., & Samson, D. (1999), “The link between
total quality management practice and organizational per-
formance”, International Journal of Quality & Reliability
Management, vol. 16, 3, 1999, pp. 226–237.
[21] Vuppalapati, K., Ahire, S.L., & Gupta, T. (1995), “JIT and
TQM: A case for joint implementation”, International
Journal of Operations & Production Management, vol. 15,
5, 1995, pp. 84–94.
[22] Wagner, Stephan M. (2011), “Supplier development and
the relationship life-cycle” International Journal of Pro-
duction Economics, Vol. 129, 2, 2011, pp. 277-283.
[23] www.Jdpower.com
[24] www.mahindraswaraj.com
[25] www.sciencedirect.com
[26] www.toyota.com
IJSER © 2013 http://www.ijser.org