International Journal of Scientific & Engineering Research Volume 2, Issue 8, Auguest-2011 1
ISSN 2229-5518
Studies on Preparation and Characterization of Na2O-CaO-P2O5-ZrO2 Bioglass-ceramics
M.R. Majhi, Ram Pyare and S.P.Singh
Abstract – Bioglass ceramics of compositions 45P2O5-24CaO- (31-X) Na2O-XZrO2, where(X= 0-3 mole %) were prepared. The DTA analysis results showed the nucleation and crystallization temperature, which increases with increasing ZrO2 in the place of Na2O in the glass composition. The identification of crystalline phases in Na2O-CaO-P2O5 - ZrO2 bioglass–ceramics were detected as calcium phosphate (ß-Ca (PO3)2 ), sodium pyrophosphate (Na4P2O7), calcium pyrophosphate (ß-Ca2P2O7 ), Sodium meta phosphate (NaPO3 ) , Sodium calcium metaphosphate (Na4Ca(PO4)6 ) and sodium zirconium phosphate (Na5Zr(PO4)3) by X-ray diffraction analysis. The main phase was identifying as calcium pyrophosphate (ß -Ca2P2O7 ), which is known for its bioactivity. The bioactivity of the prepared glass and their ceramic derivatives were done by measurement of the reflection spectra for the samples after immersing in the simulated body fluid (SBF) for different period at
37.8OC .The result revealed that no apatite layer was formed on the surface of the samples and the predominant phase remained on the surface was ß-Ca2P2O7 which is well known for its bioactivity. pH measurement of SBF for different periods was showed that chemical durability of glasses and their glass ceramic derivative increases with increasing ZrO2 content. The dimension of the crystal sizes decreases gradually with increasing the ZrO2 content after SEM analysis.
Keywords: Corrosion, Glass, Bioactive glasses, Calcium pyrophosphate, Compressive strength
—————————— ——————————
io glasses and glass–ceramics were used for medical applications due to their superior physico-chemical properties. Different types of bioactive glass and glass- ceramics materials have been developed over the last three to four decades[1-2]. The main bioactive glasses, glass–ceramics and ceramics used clinically are bio glass in the system Na2O–CaO–SiO2– P2O5,hydroxyapatite (Ca10(PO4)6(OH)2), tricalcium Phosphate Ca3(PO4)2, HA/TCP of different phases, ceramics and glass–ceramics, A/W containing crystalline oxyfluoroapatite [(Ca10(PO4)6O, F) and wollastonite (CaSiO3) in MgO–CaO–SiO2 glassy matrix[3-7].The production of composite materials has proven to be suitable solutions for improving the mechanical properties of weaker materials. Ceramic matrix biocomposites were reinforced by introducing another tough phase, Al2O3 and ZrO2 [8-9].On the other hand, zirconia ceramic, which is bioinert, is highly biocompatible and shows higher strength. Most of the published works on bioactive glasses and glass– ceramics are concentrated on SiO2-based materials. However, there is uncertainty about the long-term
effect of silicon in vivo. The use of
crystalline phosphate ceramics has attracted much
interest recently to the development of phosphate glasses and glass–ceramics for use in orthopedic implants because of their chemical and physical
----------------------------------------------------------------------------------------
Ram Pyare is a Professor, Dept. of Ceramic Engg,
IT.BHU -Varanasi (India) email:pyare_ram55@yahoo.co.in
S.P.Singh is a Professor, Dept. of Ceramic Engg,
IT.BHU -Varanasi (India) email:spsinghceram@gmail.com
properties which makes them suitable for use as bone- bonding materials [10-12]. An addition of oxides like magnesium oxide, aluminum oxide or
zirconia may be used to control some physical and chemical properties [13]. Prepared resorbable bioglass– ceramics from the system, Na2O–CaO–P2O5 containing Al2O3 to control the dissolution rate. After special thermal treatment, some crystalline phases were separated and implantation experiments demonstrated that the bone substance had grown into the phosphate glass–ceramics without the formation of connective tissues. In this present investigation, bioglasses having molar composition 45P2O5-24CaO- (31-X)Na2O-XZrO2 (Where X=0 to 3 mole %) were prepared and converted into their bioactive glass ceramics by thermal heat treatment. The bio glass and their ceramic derivatives were characterized for their physico-chemical properties such as nucleation temperature, crystallization temperature, different crystalline phases present, density, compressive strength, bioactivity, chemical durability.
For preparation of 45P2O5-24CaO-(31-X) Na2O- XZrO2(where X=0 to 3 mole%)glasses, the required amount of batch materials were weighed and mixed thoroughly in a agate mortar and pestle. The phosphate glasses of different compositions were prepared by melting the mixed batch materials in globar furnace at
1200± 5OC in 100 ml alumina crucibles in air atmosphere. Chemicals used for glass batches were of analytical reagent grade ammonium dihydrogen orthophosphate, calcium carbonate, sodium carbonate and zirconia. After 3 hrs of melting the glass were taken out from the furnace and poured on an aluminum sheet and then cooled to room temperature .After crushing the glass, it was again remelted in the furnace for another two hours to ensure homogeneity. After homogenization and remelting, it was taken out from the furnace and poured in a hot rectangular mould kept on aluminum sheet and annealed at 480 oC . The
IJSER © 2011
International Journal of Scientific & Engineering Research Volume 2, Issue 8, Auguest-2011 2
ISSN 2229-5518
annealed glass samples were preserved for their
Physico-chemical properties.
The densities were determined by the Arcmedic’s principle method and compressive strength of the sintered bioglass ceramic pellets were subjected to compression test. The test was performed using Instron Universal Testing Machine at room temperature (cross speed of 0.05 cm/min and full scale of 5000 kgf))
Differential Thermal Analysis measurement was carried out on powdered bio glass samples which were examined up to 1000 OC using a powdered alumina as a reference material (SETARAM Instrumentation, France) and the heating rate was 10oC min−1. The DTA data were used to obtain the proper heat treatment temperatures to obtain the corresponding glass–ceramic derivatives with high crystallinity. Briefly, these results showed that the values obtained were for glass nucleation temperature and the crystallization temperatures.
SAMPLES (HEAT TREATMENT PROCESS
The bio glass samples were thermally heated in two- step regime, at the deduced temperatures shown in Table II. Each bio glass sample was heated slowly to the first nucleation temperature for the formation of sufficient nuclei sites and after holding up to 4 hrs, it was then further heated to reach the second chosen crystal growth temperature for performing the perfect crystal growth. After a second hold for 6 hr. the specimen was left to cool inside the muffle furnace to room temperature at a rate of 20oC per hour
The crystalline phase was identified by using X-ray diffraction analysis, The heat-treated bio glass ceramic samples were ground to 75 microns and the fine powder was subjected to XRD test using Cu-Kα radiation (λ = 1.5405A° ) in a 2θ range between 20o and
80o. Step size and measuring speed were set to 0.02◦
and 10 /min; respectively, with a tube voltage of 40 kV and current of 35mA. The JCPDS-International Centre for diffraction Data Cards were used as a reference.
SPECTRA
In order to investigate the formation of calcium phosphate layer on the surface of the samples after immersing in SBF solution. The sample was immersed in 40 ml of SBF solution in a small plastic container at
37.8 oC and pH 7.4 in an incubator at static condition
for 1 to 30 days. The SBF solution was prepared as described by Kokubo et al[14]. The samples were removed, dried and stored in desiccators. The Infrared reflectance spectra of the bioglasses and their ceramics derivatives were measured at room temperature in the frequency range of 4000–400 cm−1. (Using a Fourier transform infrared spectrometer, Is10 Nicolet, USA) since bioactivity is determined by the formation of calcium phosphate layer on the surface of the samples.
PERIODS FOR DETERMINE THE CHEMICAL DURABILITY OF GLASSES AND THEIR GLASS CERAMIC DERIVATIVES
The glass and glass-ceramic samples in the form of
palate in the size range 1cm diameter, were subjected to the action of simulated body fluid , prepared by Kokubo et al[14] at 37.8 oC and pH 7.4 for different time periods (1 to 30 days). The pH of solution were measurement at different time periods by the help of pH meter to find out their chemical durability.
MICROSCOPE
The bioglass-ceramic samples surface was analysed before and after SBF treatment. To find out the surface microstructure by using a scanning electron microscope (SEM) (Supra -40 200, Fei, CZ). The samples were coated with plasma gold plated before testing with SEM.
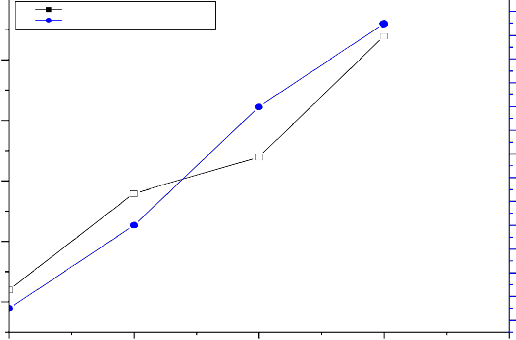
Results presented in Table 1 and Figure 1 shows that the density and the compressive strength increase with increasing ZrO2 in the glass. This is due to presence of ZrO2 the provide more density and more strength than Na2O. This indicates that replacement of Na+ ion by Zr5+ ion increase the density as well as compressive strength of the of glass which is earlier reported by Jarcho et al.[25]
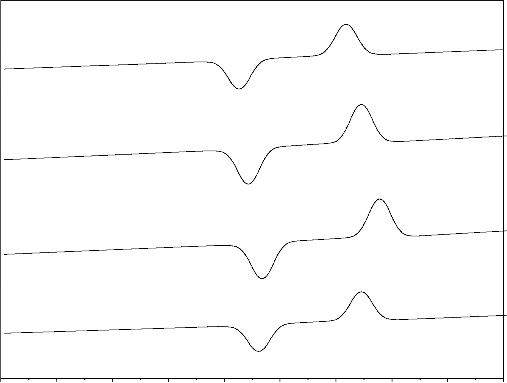
Differential thermal analysis results are shown in Fig. 2 and Table 2 for different bio glasses samples. The results revealed that the nucleation and crystallization temperatures increased with increasing ZrO2 content [21].When zirconium ion substituted for sodium ions the bonds are formed
Table1: Variation of density and compressive strength with increasing of ZrO2 content of bioglass from
S.No(1-4)
IJSER © 2011
International Journal of Scientific & Engineering Research Volume 2, Issue 8, Auguest-2011 3
ISSN 2229-5518
Sr. No | Glass Compositions (Mole %) | Density(gm/cc) | Compressive Strength(MPa) |
1 | 45P2O5-24CaO-31 Na2O | 2.61 | 135 |
2 | 45 P2O5-24CaO-30Na2O-1ZrO2 | 2.69 | 142 |
3 | 45 P2O5-24CaO-29-Na2O-2ZrO2 | 2.72 | 152 |
4 | 45 P2O5-24CaO-28Na2O-3ZrO2 | 2.82 | 159 |
2.85
2.80
2.75
2.70
2.65
2.60
Density(gm/cc)
Compressive strength(MPa)
160
158
156
154
152
150
148
146
144
142
140
138
136
134
0 1 2 3 4
ZrO2 Content
Fig.1: Variation of density and compressive strength with increase of ZrO2 content of bioglass samples from
S.No .(1-4)
IJSER © 2011
International Journal of Scientific & Engineering Research Volume 2, Issue 8, Auguest-2011 4
ISSN 2229-5518
Table 2. Variation of nucleation and crystallization temperature with increase of ZrO2 content of bioglass
Samples from S.No.(1-4)
Sr. No | Glass Compositions (Mole %) | (Tg )Nucleation Temperature(0C) | Tc crystallization temperature(0C) |
1 | 45P2O5. 24CaO. 31Na2O .0ZrO2 | 521 | 721 |
2 | 45P2O5 24CaO 30.0Na2O.1ZrO2 | 539 | 732 |
3 | 45P2O5 24CaO .29Na2O.2ZrO2 | 545 | 735 |
4 | 45P2O5 24CaO .28Na2O.3ZrO2 | 548 | 738 |
T = 7210C
c
1
T = 5210C
g
![]()
2
T = 7320C
c
T =5390C
g
3
T =7350C
c
545T
4 g
T = 7380C
c
T = 5480C
g
100 200 300 400 500 600 700 800 900 1000
Temperature (0C)
Fig.2. Variation of nucleation and crystallization temperature with increase of ZrO2 content of bioglass samples from
S.No. (1-4)
IJSER © 2011
International Journal of Scientific & Engineering Research Volume 2, Issue 8, Auguest-2011 5
ISSN 2229-5518
with the strong covalent Zr-O bond than Na-O because of the electronegativity of sodium is lesser than zirconium .The increasing of nucleation and crystallization temperature with increasing of ZrO2 content related due to the stronger bonding in to the glass structure.
CERAMICS
The XRD pattern of the reference sample (1) Fig.3 indicate the calcium pyrophosphate (ß-Ca2P2O7) is the predominant phase in the present phosphate glass ceramics. It reported by many investigations that the (ß- Ca2P2O7) phase is formed in glass ceramics derived from the phosphate invert glass systems with P2O5 content less than 50 mole % . The glasses of the present system have both Q2(PO2) and Q1 (PO3) phosphate groups. The fraction of Q1 groups increases proportionally to the content of the network modifying oxides where as the fraction of Q2 groups decrease
.The amount of the network modifying oxides in the
present work is 55 mole% which indicates the fraction of pyrophosphate groups Q1 is high. The result show that both pyrophosphate and metaphosphate crystalline phases are present after crystallization of the system. It has been reported that sodium metaphosphate (NaPO3) and sodium calcium metaphosphate ( Na4Ca(PO4)6 ) phases are formed in Na2O-CaO-P2O5 system with P2O5 content of 45mole%. If the CaO content is high ( Na4Ca(PO4)6 ) phase is predominant phase and if the Na2O content is high NaPO3 phase is the predominant phase and at the intermediate composition region both phases are precipitated but not as the major phases, however the sodium metaphosphate phase is formed relative high amount after major phase of ß -Ca2P2O7
,Sodium calcium metaphosphate Na4Ca(PO4)6 phase
seams to formed with little amount .The effect of ZrO2
addition on the crystallization process is quietly observed ,the peaks of the Na4Ca(PO4)6 phase are seen to be disappeared, The peaks of NaPO3 phase become lowered and new peaks of Na5Zr(PO4)3) phases are distinguished ,This effect may be controlled with assumption of the depolymerization effect on the metaphosphate network.
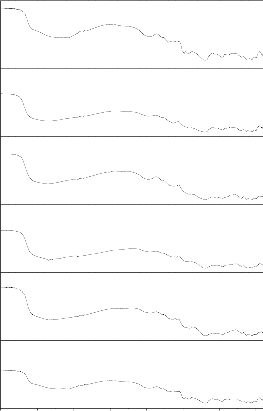
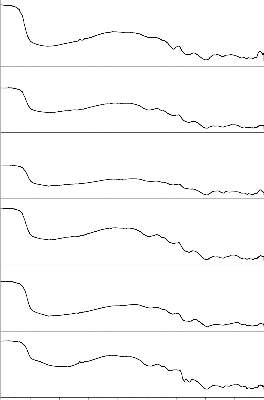
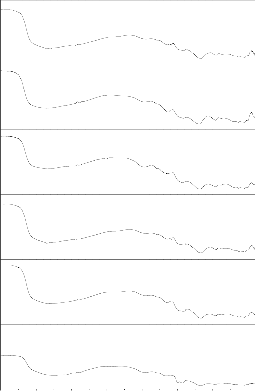
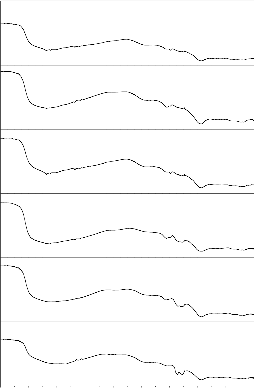
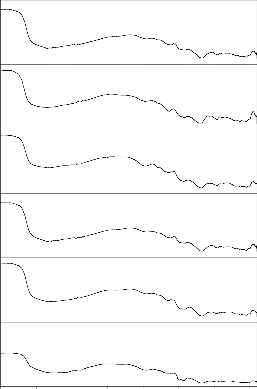
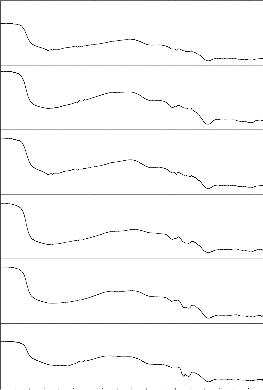
From the table 3 and figs.( 4-11) shown FTIR spectra of bio glass and their ceramic derivative before and after immersion in SBF solution for 1 to 30 days . In bioglass
1 the peaks at 1160 cm-1 and 1610 cm-1 has been vanished and other peaks are similar (there is slight change in peaks position). In bioglass 2 after 15 days the peaks at 1360cm-1 has been vanished and other peaks
are more or less similar .In bio glass 3 the peaks at 460,
515 and 1648 cm-1 has been vanished and new peaks at
815 cm -1 has been produced .In bioglass 4 the peaks at
510 and 1642 cm-1 has been vanished other peaks remains as it is earlier. Bioglass ceramics before immersion in SBF solution all bio glass ceramic have similar peaks except in bioglass ceramics 1 has extra peak at 1125 cm-1. After immersion in SBF solution from 1 to 30 days all samples has common peaks at
560,815 and 1350cm-1 . The P-O stretching peak at 1000-
1220 cm-1 indicating the formation of amorphous
CaO.P2O5 rich layer. The P-O bending (crystalline) peak at 550-620 cm-1 is the characteristics peaks of calcium pyrophosphate which indicate the bioactivity of the bioglass ceramics.
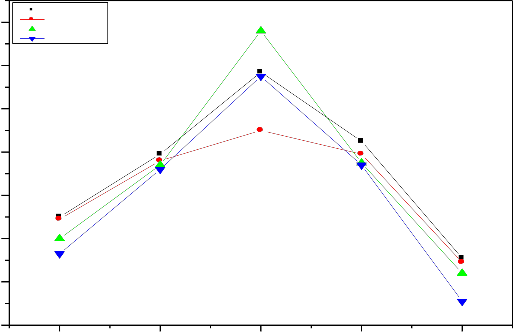
The chemical durability of bioglass and bioglass ceramic samples were immersed in SBF solution for different periods haS been determined by pH. From fig
12 and 13 shows that the leaching/dissolution behavior of both bio glasses and ceramic derivatives of bio glasses. The changes in pH after various time periods of in vitro dissolution. It can be clearly noticed that pH, in all cases increases initially within first upto 7 days, when compared to the pH of the initial solution. Subsequently, pH of solution decreases after 15 and
30days finally. The changes in pH are due to ion
leaching i.e. chemical changes of material surfaces at different time periods. The increase in pH shows that the reduction in the concentration of H+ ion due to the replacement of cation ions in the glass and subsequent production of OH- ions. It is also observed that the decrease in pH of the solution after 15days due to breaking of glass network. The reason may be considerable leaching of the glassy matrix from the surface. It can be understood that after 15 days the leached layer is removed and fresh layer is exposed, and therefore, demand for hydrogen ions is comparatively less. Similar change in pH, i.e. with decrease in pH to acidic region after 15 and 30 days respectively.
Phosphate glasses dissolve in aqueous media in the the
following two independent steps.
(i)Hydration reaction ; There is an interchange of H+ ion in the solution with Na+ ions from the glass forming a hydrated surface layer on the glass surfaces at the glass –water interface.
(ii)Network breakage; the release of different
constituents from phosphate glasses in aqueous solution is due to the hydrolysis reactions given as below;
O O O O
IJSER © 2011
International Journal of Scientific & Engineering Research Volume 2, Issue 8, Auguest-2011 6
ISSN 2229-5518
II II II II
˜ O- P-O- P-OH + H2O→ ˜ O-P-OH + HO- P-OH
In the hydrolysis of phosphate glass the P-O-P bonds broke which may lead ultimate destruction of the polymeric phosphate network and may produce orthophosphate. The glass –ceramics samples are
 X
X


20 | 30 | 40 | 50 60 | 70 | 80 |
Two | Theta |
Fig.3:X-ray diffraction pattern of bio-glass ceramics samples from S.No. (1-4)
1- NaPO3 (Sodium meta phosphate) PDF#19-200
2- ß -Ca (PO3)2(Calcium Phosphate) PDF#: 35-327
3- Na4P2O7(Sodium pyrophosphate) PDF#: 19-159
4-Na4Ca(PO4)6 ( Sodium calcium metaphosphate )PDF#22-170
5-ß-Ca2P2O7(Calcium pyrophosphate) PDF#: 22-145
6- Na5Zr(PO4)3) (Sodium zirconium phosphate) PDF#: 42-180
IJSER © 2011
International Journal of Scientific & Engineering Research Volume 2, Issue 8, Auguest-2011 7
ISSN 2229-5518
###
10
30 days
8
![]()
6
4
2
X Axis Title
###
10
0 2 4
X Ax6is T
15days
8
![]()
6
4
2
X Axis Title
X Axis Title
###
10
0 2 4
X Ax6is T
7 days
![]()
8
6
4
2
X Axis Title
%Refle

X Axis Title
###
10
0 2 4
X Ax6is T
3 days
8
6
4
2
X Axis Title
![]()
X Axis Title
###
10
10 day
8
6
4
2
2 4
X Axis Title
X Ax6is T

X Axis Title
###
10
Be0 fore
8
6
4
2
2 4
X Axis Title
X Ax6is T
4000 3500 3000 2500 2000 1500 1000 500
0
4000 3500 3000X Ax2is T5itle00 2000 1500 10000
500 2 4
X Ax6is T
Wavenumber(cm-1)
wavenumber(cm-1)
X Axis Title
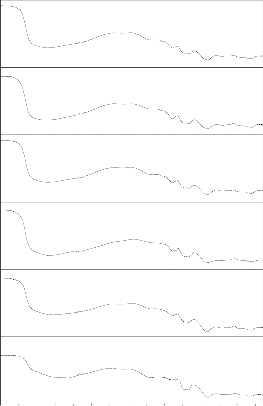
Fig. 4: FTIR reflection spectra of Bio glass Fig.5: FTIR reflection Spectra of Bio glass ceramics before and after SBF treatment (G-1) before and after SBF treatment (GC-1)
30 days
###
10
30 days
8
6
4
2
X Axis Title
###
10
0 2 4 6
15 days
15days
8
X Axis Title
6
4
2
X Axis Title
###
10
0 2 4 6
7 days
7 days
8
X Axis Title
6
4
2
3 days
X Axis Title
###
10
0 3 days
8
2 4 6
6
4
2
1 day
X Axis Title
###
10
0 1 day
8
2 4 6
X Axis Title
6
4
2
Before
X Axis Title
###
10
0 Before
8
2 4 6
6
4
2
4000 3600 3200 2800 2400 2000 1600 12000 800 400
4000 3500 3000 2500 2000 1500 1000 500
X Axis Title
0 2 4 6
-1 X Axis Title
Wavenumber(cm-1)
Wavenumber(cm )
IJSER © 2011
International Journal of Scientific & Engineering Research Volume 2, Issue 8, Auguest-2011 8
ISSN 2229-5518
Fig.6: FTIR reflection spectra of Bio glass Fig.7: FTIR reflection Spectra of Bio glass ceramics before and after SBF treatment (G-2) before and after SBF treatment (GC-2)
30 days
###
10
30 days
8
6
4
2
15 days
X Axis Title
###
10
105 days
8
2 4 6X Axis Title
X Axis Title
6
4
2
X Axis Title
###
10
0 2 4 6X Axis Title
7 days
7 days
8
X Axis Title
6
4
2
X Axis Title
###
10
0 2 4 6X Axis Title
3 days
3 days
X Axis Title
6
4
2
X Axis Title
###
10
0 2 4 6X Axis Title
1 day
1 days
8
X Axis Title
6
4
2
X Axis Title
###
10
0 2 4 6X Axis Title
Before
Before
X Axis Title
6
4
2
4000 3600 3200 2800 2400 2000 1600 1200 800 400
Wavenumber(cm-1)
0
4000 3500 300X0Axis T2itle500 2000 1500 1000 0 500
Wavenumber(cm-1)
2 4 6X Axis Title
X Axis Title
Fig. 8: FTIR reflection spectra of Bio glass Fig.9: FTIR reflection Spectra of Bio glass ceramics before and after SBF treatment (G-3) before and after SBF treatment (GC-3)
IJSER © 2011
International Journal of Scientific & Engineering Research Volume 2, Issue 8, Auguest-2011 9
ISSN 2229-5518
30 days
###
10
308 days
6
4
2
X Axis Title
###
10
0 2 4
X Ax6is Title
15 days
15 days
X Axis Title
6
4
2
X Axis Title
###
10
0 2 4
X Ax6is Title
7 days
78 days
X Axis Title
6
4
2
3 days
X Axis Title
###
10
0 2 4
38 days
X Axis Title
X Ax6is Title
6
4
2
X Axis Title
###
10
0 2 4
X Ax6is Title
1 day
1 days
8
X Axis Title
6
4
2
X Axis Title
###
10
0 2 4
X Ax6is Title
Before
B8efore
X Axis Title
6
4
2
4000 3600 3200 2800 2400 2000 1600 1200 800 400
Wavenumber(cm-1)
0
4000 3500 3000X Axis2T5itle00 2000 1500 10000
Wavenumber(cm-1)
500
2 4
X Axis Title
X Ax6is Title
Fig. 10: FTIR reflection spectra of Bio glass Fig.11: FTIR reflection Spectra of Bio glass ceramic s before and after SBF treatment (G-4) before and after SBF treatment (GC-4)
Table.3. FTIR reflection spectra of bio glass (BG) and bio glass ceramics (BGC) samples after immersed in SBF solution
Sl.No. | FTIR reflection spectra before immersed in SBF(cm-1) | FTIR reflection spectra of bio glass(BG) and bio glass ceramics(BGC) samples after immersed in SBF solution(cm-1) | ||||
Sl.No. | FTIR reflection spectra before immersed in SBF(cm-1) | 1 day | 3 days | 7 days | 15 days | 30 days |
BG-1 | 455,830,1160,1340 ,1610 | 460,810, 815,1352 | 460,810, 1352 | 460,810,1452 | 460,810,1352 | 460,815,1340,13 52 |
BGC-1 | 450,560,1125,1372 ,1615 | 555,815, 1130,115 | 555,815, 1330,1615 | 450,560,1125 | 450,810,815, | 555,560,810,815, 1352 |
BG-2 | 514,876,1329,1645 | 509,815, 819,1362 | 508,819, 1363,1814 | 509,815,1363, | 509,811,815, | 515,815,819,136 4 |
BGC-2 | 455,550,1342,1612 | 558,814, 816,1362 | 559,817, 1363 | 558,815,1363 | 557,814,819, 1362 | 558,814,819,136 4 |
BG-3 | 460,518,1327,1648 | 816,818, 1354 | 817,1352 | 816,1354 | 815,1353 | 518,1355 |
IJSER © 2011
International Journal of Scientific & Engineering Research Volume 2, Issue 8, Auguest-2011 10
ISSN 2229-5518
BGC-3 | 450,560,1372,1610 | 555,810, 1352 | 554,818, 1354 | 555,815,1351 | 553,810,1352 | 552,810,1353 |
BG-4 | 511,877,1323,1642 | 814,819, 1351 | 815,819, 1350 | 816,819,1349 | 814,819,1350 | 814,819,1352 |
BGC-4 | 450,560,1372,1610 | 555,810,815,1 352 | 556,810,816,135 4 | 555,810,815, 1351 | 555,810,817, 1354 | 555,811,815,135 5 |
Sample No.1
9.0 Sample No.2
Sample No.3
Sample No.4
8.8
8.6
8.4
8.2
8.0
7.8
7.6
1 day 3 days 7 days 15 days 30 days
Immwersion Time in SBF solution
Fig. 12.Variation in pH with time periods (1 to 30 days) of bio glass samples after SBF treatment at initial pH 7.4
IJSER © 2011
International Journal of Scientific & Engineering Research Volume 2, Issue 8, Auguest-2011 11
ISSN 2229-5518
8.8
8.7
Sample No.1
Sample NO.2
Sample No.3
Sample No.4
8.5
8.4
8.3
8.2
8.1
8.0
7.9
7.8
7.7
7.6
7.5
1 day 3 days 7 days 15days 30 days
Immersion time(days) in SBF solution
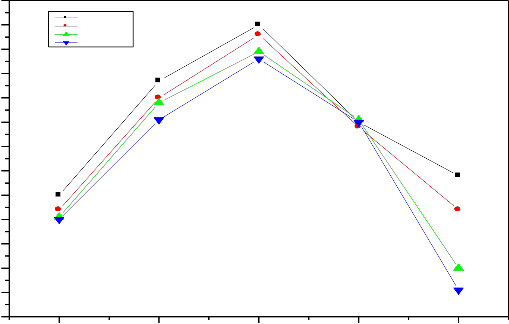
Fig. 13.Variation of pH with time periods (1 to 30 days) of bio glass ceramic samples after SBF
treatment at initial pH 7.4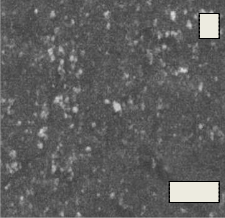
A B
10µm
10µm
D
C
10µm
10µm
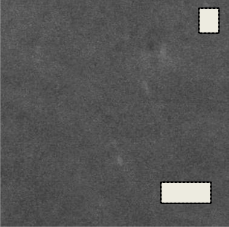
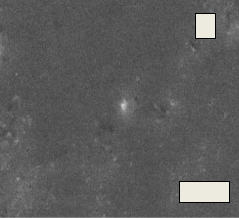
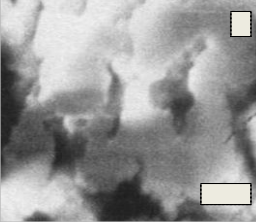
Fig.14. (A, B, C, D) SEM micrograph of the bioglass–ceramic sample No.(1-4) before the immersion in the SBF solution
IJSER © 2011
International Journal of Scientific & Engineering Research Volume 2, Issue 8, Auguest-2011 12
ISSN 2229-5518

A B
10µm 10µm

C D
10µm
10µm
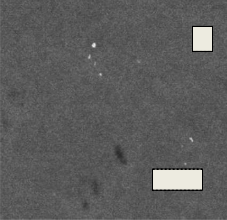
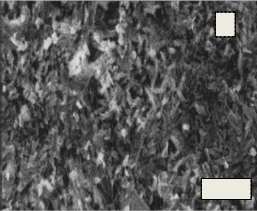
Fig.15. (A, B, C, D) SEM micrograph of the bio glass–ceramic sample No.(1-4) after immersion in the SBF solution
known to consist of both the residual glassy phase and crystallization phases. The corrosion of such glass and glass-ceramics can be explained by considering both phases. The degradation of (ß-Ca2P2O7) in distilled water has been studied by Lin et al. and reported that calcium metaphosphate is extremely insoluble in aqueous solvent, even in acidified aqueous media. On the other hand NaPO3 and ( Na4Ca(PO4)6 ) were reported to dissolve easily in aqueous media.
→P-O-P←
→P--O— -Na+
→P-O—Ca++-O—P←
From the above structure it can be seen that the divalent
cation formed ionic cross link between the non bridging oxygen of two different chains .The formation of such cross-links explain the quite high durability of calcium compound than sodium compound .similarly tetravalent cations found crosslink between the non- bridging oxygen of four different chains, the formation of such cross link explain the quite high durability of tetravalent cations. Thus with increasing of zirconium ions pH of the solution decreases as shown in fig 12 and
13 .Thus decreasing the pH of the solution indicates that chemical durability of glasses and their ceramic
derivative increases with increasing concentration of
ZrO2 content.
Fig. 14(A, B, C, D) shows the micrographs of the phosphate bio glass–ceramic samples. The morphological structure varies with the composition of the samples. All the samples show almost complete crystallization. The glass–ceramic sample No.1 shows rounded crystals of the different diameters. Increasing the ZrO2 content from 1-3% causes gradual decrease in the dimension of the crystals as shown in sample No. (2-4)
Fig. 15(A, B, C, D) shows the micrographs of the phosphate bioglass ceramic samples after immersion in SBF for 7 days at 37.8 OC. The different shapes of crystals were formed on all samples after immersion in the SBF solution for 7 days. Irregular spherical growths were observed on the surface of Glass No.1 while ball- like growths were presented on the surfaces of glass
IJSER © 2011
International Journal of Scientific & Engineering Research Volume 2, Issue 8, Auguest-2011 13
ISSN 2229-5518
sample No.2 .While cotton-like growths were formed in the surfaces of glass sample No. 3 however the scanning electron micrograph of glass sample No. 4 showed that the large cotton-like growths formed as ball-like texture.
The density and compressive strength of bio-glass ceramics increases with increasing the concentration of ZrO2 in the place of Na2O.The differential thermal analysis (DTA) curves of bioactive glasses revels that both glass transition and crystallization temperature increases with increasing of ZrO2 content. The X-ray diffraction (XRD) patterns of the bioactive glass- ceramics shows main crystalline phase is calcium pyrophosphate ,the other crystalline phases are sodium pyrophosphate, calcium phosphate, sodium meta phosphate, and sodium calcium metaphosphate and sodium zirconium phosphate. The FTIR reflectance spectra show that at 550-620 cm-1 P-O Bend-Crystalline phase is the bioactive ß –Ca2P2O7 . The dimension of the crystal sizes decreases gradually with increasing the ZrO2 content after confirmed by SEM analysis.
1. T. Kokubo, J. Non-Cryst. Solids 120 (1990) 138–151.
2. 2. T .Kokubo, F .Miyaji, H. M. Kim, and T Nakamura, Spontaneous formation of bonelike apatite layer on chemically treated titanium metals. J. Am. Ceram. Soc., 79(1996)1127–1129.
3. 3.T. Kitsugi, T. Yamamuro, T. Nakamura, S. Kotani, T. Kokubo, H.Takeuchi, Biomaterials 14 (1993) 216–
224.
4. 4. M .Ogino,., F .Ohuchi,. and L. L. Hench, Compositional dependence of the formation of calcium phosphate films on Bioglass. J. Biomed. Mater. Res. 14(1980) 55–64.
5. D. C Clupper,., L. L Hench,. and J. J., Melchowsky, Strength and toughness of tape cast bioactive glass
45S5 following heat treatment. J. Eur. Ceram.Soc.,
24 ( 2004) 2929–2934.
6. T Kitsugi,., T Yamamuro,., T. Nakamura, and T., Kokubo, Bone bonding behavior of MgO–CaO– SiO2–P2O5–CaF2 glass (mother glass of AWglass– ceramics). J. Biomed. Mater. Res., 23(1989) 621–
648.
7. M. Neo, T Nakamura, C. Ohtsuki, T. Kokubo, and T. Yamamuro,., Apatite formation on three kinds of bioactive material at an early stage in vivo: a comparative study by transmission electron microscopy. J. Biomed. Mater.Res., 27( 1993) 999–
1006.
8. E .Landi, A. Tampieri,., G. Celotti,. and S .Sprio,., Densification behavior and mechanisms of synthetic hydroxyapatites. J. Eur. Ceram. Soc.,
20(2000)2377–2387.
9. A. Marti, Dr Robert Mathys Foundation, Bischmattstr. 12, CH-2544 Bettlach, Inert bioceramics (Al2O3, ZrO2) for medical application, Int. J. Care Injured 31 (2000) 33-36
10. C. Ohtsuki, H. Iida, S. Nakamura, A. Osaka, J.
Biomed. Mater. Res. 35 (1997) 39.
11. T.Kokubo, H. Kim, M. Kawashita, Biomaterials 24 (2003) 2161–2175.
12. W. Vogel, W. Holand, Angew. Chem. Int. 26 (1987)
527–544.
13. 13.L.L. Hench, J.M. Polak, Science 295 (5557) (2002)
1014.
14. 14.T. Kokubo, H. Kushitani, S. Sakka, T. Kitsugi, T.
Yamamuro, J. Biomed.Mater. Res. 24 (1990)721–
734
15. J.S. Temenoff, L. Lu, A.G. Mikos, in: J.E. Davies (Ed.), Bone Engineering,EM Squared, Toronto, (2000) p. 455
16. P.F. James, in: M.H. Lewis (Ed.), Glasses and Glass–
Ceramics, Chapman and Hall, London,(1989) p. 59.
17. D. Singh, M. de la Cinta Lorenzo-Martin, F.
Gutie´rrez-Mora, J.L. Routbort, E.D. Case Self- joining of zirconia/hydroxyapatite composites using plastic deformation process: Acta Biomaterialia 2 (2006) 669–675
18. 18. S.Bharati, C. Soundrapandian, D.Basu, Someswar Datta : Studies on a novel bioactive glass and composite coating with ydroxyapatite on titanium based alloys: Effect of y-sterilization on coating, Journal of the European Ceramic Society
29 (2009) 2527–2535
19. 19.A.F. Habibe , L.D. Maeda, R.C. Souza, M.J.R.
Barboza, J.K.M.F. Daguano, S.O. Rogero, C. Santos: Effect of bioglass additions on the sintering of Y- TZP bioceramics, Materials Science and Engineering C 29 (2009) 1959–1964.
20. 20.D. de Waal, C. Hutter, Mater. Res. Bull. 29 (1994)
1129–1135.
21. 21.T. Kokubo, H. Kushitani, S. Sakka, T. Kitsugi, T.
Yamamuro, J. Biomed.Mater. Res. 24 (1990) 721–
734.
22. 22.K. Franks, I. Abrahams, J.C. Knowles, J. Mater.
Sci.: Mater. Med. (2000) 609–614.
23. Kasuga, Y. Hosoi, M. Nogami, M. Niinomi, J. Am.
Ceram. Soc. 84 (2001) 450–452.
24. A. Aronne, L.E. Depero, V.N. Sigaev, P. Pernice, E.
Bontempi, O.V.Akimova, E. Fanelli, J. Non- Cryst. Solids 324 (2003) 208–219.
25. Jharcho.M. , C.H.Bolen, M.B.Thomas, J.Bobick, J.F.Ka, and .H.Doemious’synthesis and characterization in dense polycrysttaline form” J.Mat.Sci. 11.(1976)p.2027
26. H. Gao, T. Tan, D. Wang, J. Control. Release 96 (2004) 29–36.
27. F.H. Lin, C.-J. Liao, K.S. Chen, J.-S. Sun, H.-C. Liu, Biomaterials 18 (1997) 915–921.
28. J.M. Antonucci, B.O. Fowler, S. Venz, Dent. Mater.
7 (1991) 124–129.
29. D.R. Lide, CRC Handbook of Physics and
Chemistry, CRC Press, Boca Raton, (2004)
30. L.L. Hench, Bioceramics: from concept to clinic, Journal of American Ceramic Society 74 (1991)1487–1510.
31. 31. H.A. ElBatal, M.A. Azooz, E.M.A. Khalil, A.
Soltan Monem, Y.M. Hamdy, Characterization of some bioglass–ceramics: Materials Chemistry and Physics 80 (2003) 599–609.
32. Oscar peitl, E.D.Zanotoo, L.LHench : “ Highly bioactive P2O5-Na2O-CaO-SiO2 glass-ceramics”, Jo urnal of non-crystalline solids 292(2001)115-126.
IJSER © 2011