International Journal of Scientific & Engineering Research, Volume 3, Issue 11, November-2012 1
ISSN 2229-5518
Student’s Examination Result Mining:
A Predictive Approach
Vaneet Kumar, Dr. Vinod Sharma
Abstract— This paper takes into consideration the various factors and their influence on student performance in education and predicts their final examination result whether Pass or Re-appear. Various factors such as previous year results, attendance, financial status of family, parent educational qualification, internet use for study material, parents visits to school, extra classes etc plays an important role in students’ education. A lot of other immeasurable factors such as student motivation level, learning techniques used, strategy for preparing for final examination, student behavior and habits, questions chosen for answering and way of expressing ideas may also be responsible for the final result, but they are beyond the scope of this paper. This paper discusses the most common measurable factors among the students. The data mining methodology while extracting useful, valid patterns from education database environment contribute to proactively ensuring students maximize their academic output [1]. The results of this paper present an idea about these factors and their influence on student performance and may also be used by the educational administrators in making proper decisions for the welfare of the students. Naive Bayes classifier is applied to calculate probabilities. MATLAB is used to get the final outcome which helps in predicting final examination results. The data set is collected from different schools by distributing questionnaires, has been used as input to the algorithm.
—————————— ——————————
here is a growing interest among researchers that use data mining in educational technologies, or educational data mining (EDM). There are several fields from which
EDM methods are derived such as data mining and machine learning, psychometrics and other areas of statistics, infor- mation visualization, and computational modeling. A view- point on educational data mining is given by Baker, which classifies work in educational data mining as Prediction, Clus- tering and Relationship mining [2]. The process of the for- mation of significant models and assessment within Knowledge Discovery in Databases – KDD is referred to as data mining [3]. The use of data mining techniques may im- prove the efficiency of educational institutions. If data mining techniques such as clustering, decision tree, association be ap- plied to education processes, it can help improve students’ performance, their life cycle management, selection of course and major, their retention rate and grant/fund management of an institution [4]. Now a day the data in the educational insti- tutes has increased to many folds. These databases contain a lot of hidden information that can be used for improvement of students’ performance. The performance in education is a turning point in the academic and professional life of all stu- dents. The ability to predict student’s performance is very im- portant in educational environments. The academic perfor- mance is influenced by many factors; hence it is essential to apply a predictive data mining algorithm for students’ per- formance so as to identify the different factors that highly in- fluence student’s academics. Moreover after having the entire factors one can also predict the final examination results. In the present investigation, we had 250 student records, which were used by Bayes classification prediction to predict the fi- nal examination results.
Data Mining can be used in educational field to enhance the understanding of learning process to focus on identifying, extracting and evaluating variables related to the learning process of students [5]. There are different educational objec- tives for using classification, such as: to discover potential stu- dent groups with similar characteristics and reactions to a par- ticular pedagogical strategy [6], to detect students’ misuse or game-playing [7], to group students who are hint-driven or failure-driven and find common misconceptions that students possess [8], to identify learners with low motivation and find remedial actions to lower drop-out rates [9], to pre- dict/classify students when using intelligent tutoring systems etc [10], [11].
Academic institutions are increasingly required to monitor their performance and the performance of their students. This gives rise to a need to collate, analyse and interpret data, in order to have evidence to inform academic policies that are aimed at, for example, improving student retention rates, allo- cating teaching and support resources, or creating interven- tion strategies to mitigate factors that may affect student per- formance adversely [12].
The data set used in this study has been obtained from differ- ent students reading in various schools and colleges. A ques- tionnaire was prepared containing a lot of multiple choice questions. These questionnaires were then distributed among the students and finally collected back from them. A total of
280 questionnaires were distributed, out of which 250 were collected back. Each student filled the questionnaires with independence and according to his own real data. Only those fields are selected which are required for data mining and prediction purposes. The data so collected is then divided into
IJSER © 2012
International Journal of Scientific & Engineering Research, Volume 3, Issue 11, November-2012
ISSN 2229-5518
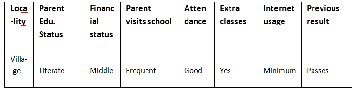
two categories; Training set and testing set. The classification algorithms so used is trained using the training set and then tested using the other set for testing data. A brief description of the attributes that has been taken into consideration in this paper is given in the following table:
S. no | Variable type | Attributes |
1. | Locality type | Village, town or city. |
2. | Parent Educational status | Literate or illiterate |
3. | Financial status | Low, medium or high |
4. | Parent visit to school | Nil, frequently or rare |
5. | Attendance in class- room | Good, medium or shortage |
6. | Extra classes status | Yes or No |
7. | Internet usage | Minimum, medium or maximum |
Bayesian learning algorithm is the most practical learning ap- proach for most learning problems and is based on evaluating explicit probabilities for hypotheses. Bayes learning classifier is extremely competitive with other learning algorithms and in many cases outperforms them. Bayesian learning algorithms are extremely important in machine learning since they pro- vide unique perspective for understanding many learning algorithms that do not explicitly manipulate probabilities [13]. Bayes theorem states that:
![]() ---------- (1) Where:
---------- (1) Where:
n = the number of training examples for which v = vj
nc = number of examples for which v = vj and a = ai
p = a priori estimate for P(ai/vj)
m = the equivalent sample size.
The training and testing of data along with all the calculations are performed in MATLAB.
Suppose there is no example with such attributes in combina- tion in our data set. Looking back at equation (1) we calculated the following probabilities:
And
and multiply them by P(Pass) and P(Re-appear) respectively.
We estimated these values as follows:
=============================================
n= 141 n=59 n=141 n=59
nc=41 nc=33 nc=125 nc=23 p=0.33 p=0.33 p=0.5 p=0.5
m=3 m=3 m=3 m=3
=============================================
=============================================
n=141 n=59 n= 141 n=59
nc=44 nc=24 nc= 95 nc=23 p=0.33 p=0.33 p=0.33 p=0.33
m=3 m=3 m=3 m=3
=============================================
============================================= n= 141 n=59 n=141 n=59 nc=107 nc=13 nc=122 nc=22 p=0.33 p=0.33 p=0.5 p=0.5
m=3 m=3 m=3 m=3
=============================================
=====================
n= 141 n=59
nc=92 nc=46 p=0.33 p=0.33
m=3 m=3
=====================
Looking at P(Village|Pass), we have 141 cases where vj = Pass
, and in 41 of those cases ai=Village. So for P(Village|Pass), n=141 and nc =41. Note that all attribute are not binary. So the
probability of each attribute is calculated as,![]()
The m value is arbitrary, (We will use m = 3) but consistent for all attributes. Now simply apply equation (1) using the pre computed values of n, nc, p, and m.
P(Village|Pass)= (41+3*0.33)/(141+3)=0.2916
IJSER © 2012
International Journal of Scientific & Engineering Research, Volume 3, Issue 11, November-2012
ISSN 2229-5518
P(Village|Reappear)= (33+3*0.33)/(59+3) =0.5482
And similarly we can calculate the similar values for all
attributes.
We have P(Pass)=0.5 and P(Re-appear)=0.5, so we can calcu- late the final probability as:
For v = Pass, we have
=0.5 * 0.2916 *0.8784*0.3124*0.6666*0.7499*0.8576*0.6457
= .0111
and for v = Reappear, we have
= 0.5 * 0.5482* 0.3951*0.4030*0.3869*0.2256*0.3790*0.7579
= .0011
Since 0.0111 > 0.0011,
The data element gets classified as ‘PASS’
Following are some of the snapshots of output obtained in
MATLAB: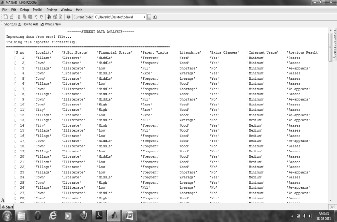
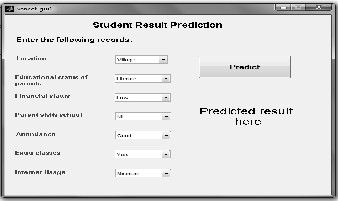
The Naïve Bayes algorithm is trained using the training da- ta set. The training inputs for the algorithm are directly fed from the stored file. After the algorithm is trained, then the inputs from the testing file are fed into the algorithm for pre- diction one by one. All the records are maintained in the stored file. The records for training and testing are maintained in different files. In order to provide the input to the algo- rithm, an output window shown in Fig.2 has been developed. The output window has been Coded, Developed and De- signed in MATLAB GUI interface. Each record from the train- ing set is fed into the GUI interface one by one and then its output result is predicted and noted as either pass or reappear. The output predicted by the algorithm is then compared with the actual results. If they mismatch, this record set becomes an error. The same process is repeated for all testing record set and at last the percentage of correct and incorrect prediction is calculated.
After performing all the calculations over the collected data the efficiency of algorithm has been calculated. It has been observed that the algorithm works with an efficiency of 88% on the record set considered in this paper. The total records used for training the algorithm were 200 whereas the testing record set was 50. Intuitively the trained classifier is tested on training set by which it is trained and surprisingly the infor- mation found is also not error free. The results suggest that the algorithm can perform good prediction with least error and finally this could be an important tool for student’s examina- tion results prediction.
This paper takes into consideration some of the most com- mon factors of students. A lot of other factors are also there that may affect the performance of the students. Here the measurable factors are considered which can affect the student performance in the final examination results. All the other factors also need to be taken into an account. Moreover, there may be a definite impact of immeasurable factors on student’s results also. To take all those factors into consideration for prediction purposes is left as a future scope of this paper.
IJSER © 2012
International Journal of Scientific & Engineering Research, Volume 3, Issue 11, November-2012
ISSN 2229-5518
[1] E.N. Ogor, “Student Academic Performance Monitoring And Evaluation Using Data Mining Techniques,” Conf. on Electronics, Robotics and Automotive Mechanics (CERMA), pp. 354 – 359, 2007.
[2] S. Narli and Z.A.Ozelik, “Data Mining in Topology Education: Rough Set Data Analysis,”Int. J. Physical Sciences, Vol. 5(9), pp.
1428-1437, 2010.
[3] S.Z.Erdogan and M. Timor, “A Data Mining Application in a Student Database,”J. Aeronautics and Space technologies (AST), Vol.2, no.2, pp. 53-54, July 2005.
[4] J.Ranjan and R Ranjan, “Application of Data Mining Techniques In Higher Education In India,” J. Knowledge Management Practice, Vol. 11, Special Issue 1, January 2010.
[5] B.K. Bhardwaj and S. Pal, “Data mining: A Prediction for Per- formance Improvement Using Classification,”Int. J. of Computer Science and Information Security, Vol. 9, no.4, 2011.
[6] [6] G.D. Chen, C.C. Liu and K.L. Ou and B.J. Liu, “Discovering Decision Knowledge from Web Log Portfolio for Managing Classroom Processes by Applying Decision Tree and Data Cube Technology,” J. of Educational Computing Research, Vol.23, issue
3, pp.305–332, 2000.
[7] R.S.Baker, A.T.Corbett and K.R.Koedinger, “Detecting Student Misuse of Intelligent Tutoring Systems,”Proc. Int. Conf. on Intel- ligent Tutoring Systems (ITS), pp.531–540, 2004.
[8] M.V.Yudelson, O.Medvedeva, E.Legowski, M.Castine, D.Jukic and C.Rebecca, “Mining Student Learning Data to Develop High Level Pedagogic Strategy in a Medical ITS,”AAAI Work- shop on Educational Data Mining, pp.1-8, 2006.
[9] M.Cocea and S. Weibelzahl, “Can Log Files Analysis Estimate Learners’ Level of Motivation?”Workshop on Adaptivity and User Modeling in Interactive Systems, pp.32-35, 2006.
[10] W.Hamalainen and M.Vinni, “Comparison of machine learning
methods for intelligent tutoring systems,”Conf. Intelligent Tutor- ing Systems, pp. 525–534, 2006.
[11] C. Romero, S.Ventura, P.G. Espejo, and C. Hervas, “Data Min- ing Algorithms to Classify Students,” Proc. Int. Conf. on Educa- tional Data Mining (EDM08), pp.8-17, 2008.
[12] M.G. Madden, W. Lyons and I. Kavanagh, “A data-driven ex- ploration of factors affecting student performance in a third- level institution,”proc. AICS Irish Conf. on Artificial Intelligence and Cognitive Science, 2008.
[13] E. Alpaydin, “An Introduction to Machine Learning,” The MIT
press, Cambridge, Massachusetts, England, 2004.
————————————————
Vaneet Kumar is currently a Research Scholar in Deptt. Of Com-
puter Science and I.T. in University of Jammu, India, PH-
+919419170697. E-mail: vaneetverma@gmail.com
Dr. Vinod Sharma is currently serving as Associate professor in
Deptt. Of Computer Science and I.T. in University of Jammu, In- dia, having a teaching experience of more than 18 years in higher education department. PH-+919797301111. E-mail: vnodshrma@yahoo.com
IJSER © 2012