follows [7]:
Fc=Fa+k�𝐹𝑎 + 1
………………………………………………………………..(1)
International Journal of Scientific & Engineering Research, Volume 6, Issue 5, May-2015 1831
ISSN 2229-5518
Road traffic accidents are a major cause of premature death and disabilities. Every year the lives of almost 1.24 million people are cut short as a result of a road traffic crash. Between 20 to 50 million more people suffer non-fatal injuries, with many incurring a disability as a result of their injury. Road traffic injuries cause considerable economic losses to victims, their families, and to nations as a whole. These losses arise from the cost of treatment (including rehabilitation and incident investigation) as well as reduced/lost productivity (e.g. in wages) for those killed or disabled by their injuries, and for family member who need to take time off work to care for the injured. The aim of the traffic accident analysis to investigate the cause accidents, to determine hazardous locations and to determine to enhance road features, to evaluate traffic safety after enhancement. This kind of system often includes a database query tool to store and analysis information about accidents mainly to identify high crash locations, in other words hazardous
locations along the road [2]. The advancements in using GIS and Remote Sensing techniques can
be put to effective use in accident analysis. Although GIS has been used for over thirty years however it has only been recently used in the field of transportation. In addition, to promote linkage between various types of data for easy comprehension. This paper aims to observe and analyzed road accidents hazardous locations recognized according to accidents and traffic data and road information. The main purpose of this paper is to use Statistical GIS techniques, SPSS and high resolution imagery for detecting and determine the most critical accidents points along the external and internal roads of the study area. The study area for this research is Darbandikhan town and their surrounding landscape. Darbandikhan is one of the towns belong to Sulaimani Governance in Kurdistan Region at the northern part of Iraq.
IJSER © 2015 http://www.ijser.org
International Journal of Scientific & Engineering Research, Volume 6, Issue 5, May-2015 1832
ISSN 2229-5518
Road traffic accidents are a major cause of premature death and disabilities. Every year the lives of almost 1.24 million people are cut short as a result of a road traffic crash. Between 20 to 50 million more people suffer non-fatal injuries, with many incurring a disability as a result of their injury. Road traffic injuries cause considerable economic losses to victims, their families, and to nations as a whole. These losses arise from the cost of treatment (including rehabilitation and incident investigation) as well as reduced/lost productivity (e.g. in wages) for those killed or disabled by their injuries, and for family member who need to take time off work to care for the injured. There are few estimates of the cost of injury, but an estimate carried out in 2000 suggest that the economic cost of road traffic crashes was approximately 518 billion $. National estimates have illustrated that traffic crashes cost countries between 1-3% of their gross national product, while the financial impact on individual families has been shown to result in increased financial
borrowing and debt, and even a decline in food consumption [1] thus to make road safer traffic
accident analysis system is useful tool for highway agencies. The aim of the traffic accident analysis to investigate the cause accidents, to determine hazardous locations and to determine to enhance road features, to evaluate traffic safety after enhancement. This kind of system often includes a database query tool to store and analyse information about accidents mainly to identify
high crash locations, in other words hazardous locations along the road [2]. Classical database can
also perform many queries such as crash statistics for locations during the specified time periods, types of accidents, drivers involving certain type of accidents etc. in addition to these output can be printed out [3].
The advancements in using GIS and GPS techniques can be put to effective use in accident analysis. Although GIS has been used for over thirty years however it has only been recently used in the field of transportation. GIS is a technology for managing , processing and analyzing locational and related information. It visually displays the results of analyses thus enabling sophisticated analysis and quick decision making. Development of a system that uses GIS to analyze traffic accidents has been pursued towards improving the efficiency and effectiveness of traffic accident countermeasure. Also GIS would make analysis less time consuming and less tedious which otherwise would become very labour sensitive. Thus GIS will offer a platform to
maintain and update accident record database and use it for further analysis [4].
IJSER © 2015 http://www.ijser.org
International Journal of Scientific & Engineering Research, Volume 6, Issue 5, May-2015 1833
ISSN 2229-5518
The study area for this research is Darbandikhan town and their surrounding landscape. Darbandikhan is one of the towns belong to Sulaimani Governance in Kurdistan Region at the northern part of Iraq. It is mountainous region and it extends between latitude 35°09′09″ north and longitude 45°47′42″ east.
Darbandikhan town has an urban population of 45000. It is considered as an important region where contains Darbandikhan Dam, which was constructed in 1956 to 1961. The purpose of the dam is irrigation, flood control, hydroelectric power production and recreation. In addition, this town is considered as one of the important regions for tourist attractions, it is near the border with Iran, where witnesses a high traffic exposure because it is near of cross-border trade and it is the only communication link between the cities of Sulaimani and Kalar within Sulemani province .
It is very important that road accidents hazardous locations recognized according to accidents and traffic data and road information. There are many methods for this reason, but today five significant methods determine to identify accidents hazardous locations.
It is the method used for analyzing hazardous locations and ranking them in order through the use of the number of accidents to determine and prioritize accident prone spots which were estimated by counting the reportable accidents occurred in each road segment simultaneous with making a list with descending order so, it means that higher crash frequency signifies the most hazardous
location within the segment [5].
The accident rate method consists of simply dividing the accident frequency at a location by the vehicle exposure to determine the number of accidents per million vehicle-mile of travel at highway segment. Segments are priority ranked in order of descending accident rate [6].
The frequency-rate method is a combination of three methods, the crash frequency, crash density and crash rate method. Locations are considered high-crash areas if they have a higher rate than predetermined crash frequency, crash density or crash rate. The method first finds crash frequency and crash densities on a highway segment and then uses the crash rate to reorder the final list.
The frequency-rate method provides a list of high-crash locations that are then evaluated using other methods. Sites that should be investigated using other methods. Sites that should be investigated further might not be and sites that should not be investigated might be, causing time to be wasted. This method does not take into account crash severity, such as fatalities and/or
serious crashes [7].
IJSER © 2015 http://www.ijser.org
International Journal of Scientific & Engineering Research, Volume 6, Issue 5, May-2015 1834
ISSN 2229-5518
The quality control methods consider various highway categories to rank high crash locations. The method compares site crash frequencies, densities, or rates against predetermined average values for sites with similar characteristics [7].
The number quality control method applies statistical analysis to find a particular crash sit’s frequency/density and the compares it with the mean frequency/density for similar sites. The number quality control method is used on sites where crash density is much greater than other sites across the region. The formula to find the critical crash rate at a roadway location is as
follows [7]:![]()
![]()
![]()
Fc=Fa+k�𝐹𝑎 + 1
………………………………………………………………..(1)
𝑀 2𝑀
Where
Fc=critical rate for a particular location
Fa=average crash frequency/density for all road location of like characteristics.
k= probability factor determined by the level of statistical significance desired for Fc, and
M=number of vehicles traversing particular road section (millions of vehicle of vehicle-km) or number of vehicles entering particular intersection (millions of vehicles) during the analysis period.
The rate quality method is used in the hazardous road locations by means of a statistical test which compares the traffic crashes rates for roadway segments and intersections with similar characteristics to determine if a site may have a higher rate of traffic crashes. The formula to find
the critical crash rate at a roadway location is as follows [7]:![]()
![]()
![]()
Rc=Ra+k�𝑅𝑎 + 1
…………………………………………………………………(2)
𝑀 2𝑀
Where
Rc: critical rate for a particular location (crashes per million vehicles or c crash per million vehicle-km)
Ra: average crashes rate for all road location of like characteristics (crashes per million vehicles or c crash per million vehicle-km).
k: probability factor determined to be the level of statistical significance desired for Rc, and
M: number of vehicles traversing particular road section (millions of vehicle-km) or number of vehicles entering particular intersection (million of vehicles) during the analysis period.
IJSER © 2015 http://www.ijser.org
International Journal of Scientific & Engineering Research, Volume 6, Issue 5, May-2015 1835
ISSN 2229-5518
The severity method is based on converting each crash to a “property damage only” (PDO) equivalency. The severity of a crash is determined by the most severe injured in the indicate regardless of the number of injuries.
The equivalent property damage only (EPDO) average crash frequency performance measure assigns weighting factors to crashes by severity (fatal, injury, property damage only) to develop a combined frequency and severity score per site. The weighting factors are often calculated relative to property damage only (PDO crash cost). The crash costs by severity are summarized
yielding an EPDO value [8].
EPDO=9.5K +3.5B+PDO ……………………………………….………………. (3)[9]
Where
K: No. of fatal crashes
B: No. of injury crashes
PDO: No of property damage crashes.
In order to determine hazardous locations in the geographical boundaries of Darbandikhan town and their surrounding landscape, accidents reports from 2010-2012 (where this period is long enough to limit random fluctuations in the accidents account and short enough to limit change in road and traffic conditions) collected from the traffic police office in Darbandikhan town. An integration of GIS techniques and statistical modeling using ArcGIS and SPSS software was applied to complete the research requirements. A brief description of the steps of work is shown in the figure (1) below.
•location, time, type of accident, etc..classification the locations in group of sections
(legth of every section=500m.
•statistical analysis for the accident dataMicrosoft Excel software used to determine the hazardous locations. (locations which have five accidents or more.
•using EPDO method to to rank the locations in order of priority and genoreference these locations on the road network by using several colors.
•using ArcGIS software to determin the location of the critical places with high risk and accidents.

Fig ( 1 ) A brief description of the steps of workflow
IJSER © 2015 http://www.ijser.org
International Journal of Scientific & Engineering Research, Volume 6, Issue 5, May-2015 1836
ISSN 2229-5518
A sample from these reports is shown in the figure (2).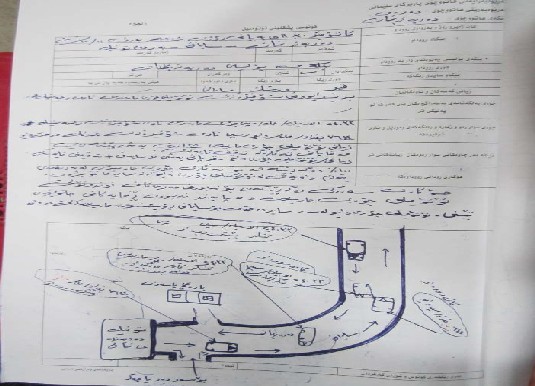
Fig. (2) Sample of traffic accident reports
All data in the reports transferred to Microsoft Excel software in order to manage our captured data and to create database. The database contain description for the location of the accident, crash type, weather information, surface information, date and time, vehicle type, human damage and material damage. The database contains 334 reports. A sample of these data is shown in the figure (3).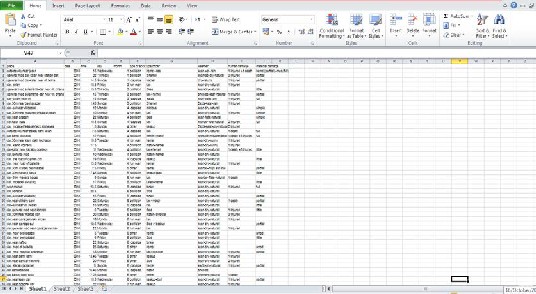
Fig. (3) Database using Microsoft Excel
IJSER © 2015 http://www.ijser.org
International Journal of Scientific & Engineering Research, Volume 6, Issue 5, May-2015 1837
ISSN 2229-5518
SSPS program was used to create charts that include number of accidents in each year, type of accidents, vehicles involved in accidents, time of accidents, accident’s day and accident’s month for the study area in general as shown in figures (7,8,10, 11 and 12).
Microsoft Excel software used to filter data and select a group of high-accident locations (which have five accidents or more in the specified section as shown in the figure (4) below.
Hazardous locations
Ignore
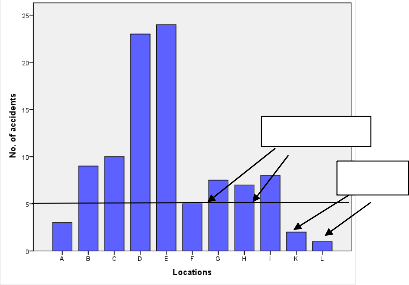
Fig. (4) Determining the hazardous locations by using Microsoft Excel software
.
Then these hazardous locations were visited and every section (which is defined in the study as
500 meters long). Each section has five accidents or more was considered as a hazardous location.
Although the traffic accidents data reports captured from the traffic police office at the study area contained a great details of information, at the same time, some information that are not available, for this reason, in this paper the researchers arrived to the conclusion that there are only two methods that can be applied according to the quantity and quality of data available for the study area to determine the hazardous locations. In the beginning frequency method was used then the crash severity method used and (EPOD) calculated in these locations to rank the locations in order of priority.
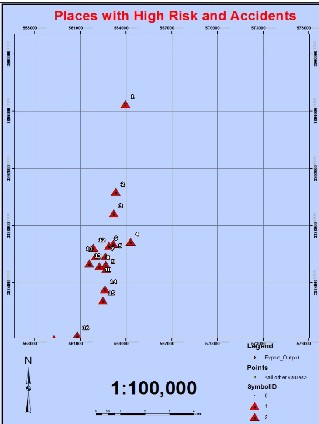
As shown in figure (2) ArcGIS ESRI software was applied for editing, georeferencing and representing data to determine the location of twenty critical places with high risk and accidents along the main road which link Darbandikhan with other towns. In each section on the road network by using several colors according to the severity of these locations, as illustrated in the figures ( 5-12 ) below .
IJSER © 2015 http://www.ijser.org
International Journal of Scientific & Engineering Research, Volume 6, Issue 5, May-2015 1838
ISSN 2229-5518
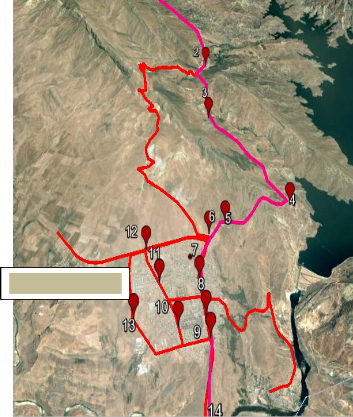
 Darbandikhan
Fig (6) Digital map of the places with high risk and accedints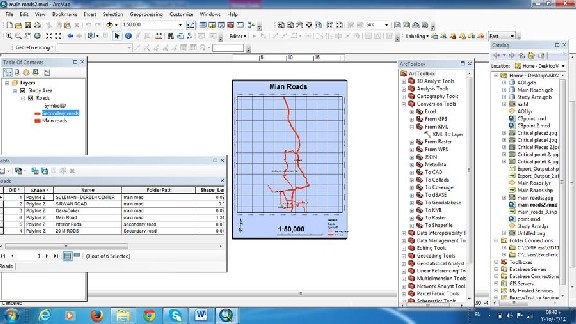
IJSER © 2015 http://www.ijser.org
International Journal of Scientific & Engineering Research, Volume 6, Issue 5, May-2015 1839
ISSN 2229-5518
Darbandikhan
Sulemani
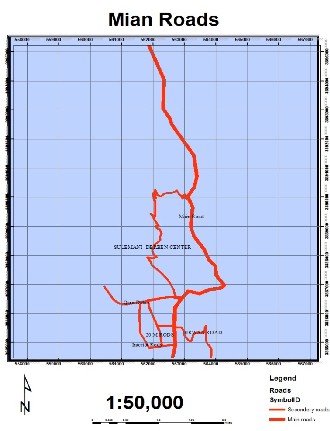
Fig (8) Digital map of Main & Secondary Roads of the Study Area
Statistical analysis performed using SSPS 21 and ArcGIS 10.2 to analysis the data of 334 accident's reports. SSPS can quickly evaluate the accidents data and presents the general trends of the accidents data in the study region in general.
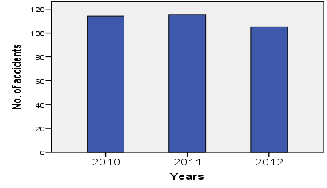
Fig. (9) the number of accidents in each year (2010-2012)
It can be seen from the graph above the number of accidents are nearly close in the three years.
IJSER © 2015 http://www.ijser.org
International Journal of Scientific & Engineering Research, Volume 6, Issue 5, May-2015 1840
ISSN 2229-5518
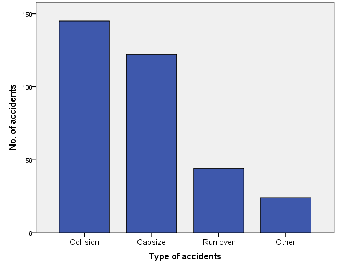
Fig.(10) Type of accidents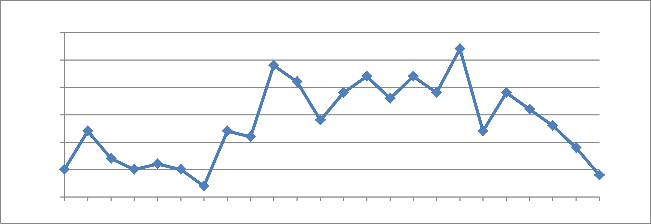
The above graph indicates occurrence of collisions accidents (43.3%) are higher than other types
30
25
20
15
10
5
0 Time of day
1 2 3 4 5 6 7 8 9 10 11 12 13 14 15 16 17 18 19 20 21 22 23 24
of accidents, followed by capsizes accidents (36.42%).
Fig.(11) Variation of accidents with time of day
The graph above shows that frequency of accident is highest at 18 o'clock (8.33%); also it shows frequency of accidents through the daytime (8-18) is (64.51%).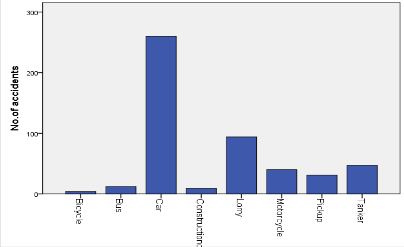
International Journal of Scientific & Engineering Research, Volume 6, Issue 5, May-2015 1841
ISSN 2229-5518
Fig.(12) distribution of vehicles involved in accident (2010-2012)
It can be clearly seen from the graph that among various types of vehicles, the car is responsible for most accidents of (52.3%) followed by lorry which is (18.9%) then tanker (9.5%).
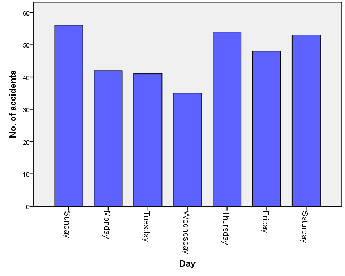 Fig.(13) variation of accidents per days
It can be seen from the graph above the occurrence of accidents from Thursday to Sunday are higher than (64.1%) compare with the other days.
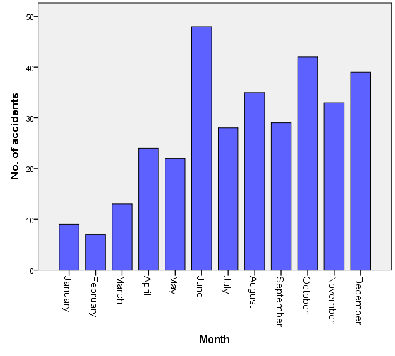 Fig.(14) variation of accidents per months
Here, the graph illustrates frequency of accidents from June to December which are higher
(77.2%) compare with the period from January to May.
IJSER © 2015 http://www.ijser.org
International Journal of Scientific & Engineering Research, Volume 6, Issue 5, May-2015 1842
ISSN 2229-5518
From the table (1) and the figure (15) it can see that (Near village of Chinara) and (The beginning of tunnel) locations are the most vulnerable sites according to frequency method.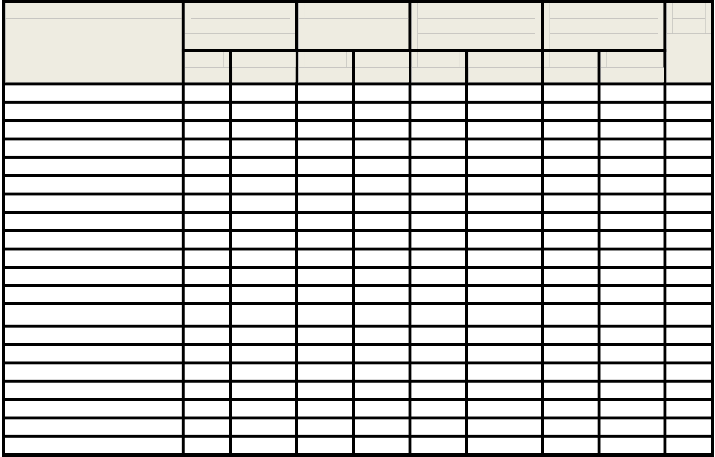
Table 1: Distribution of accidents at location (2010-2012)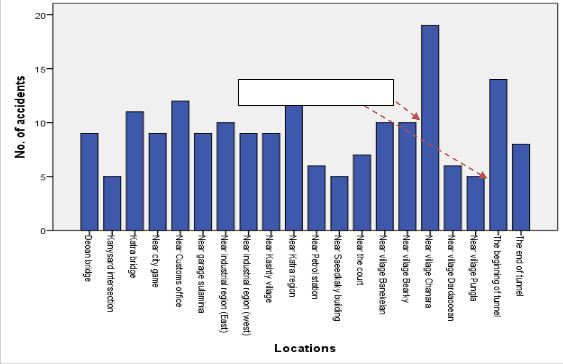
No. | % | No. | % | No. | % | No. | % | ||
Near village of Chanara | 3 | 15.79 | 11 | 57.9 | 3 | 15.79 | 2 | 10.52 | 19 |
The beginning of tunnel | 2 | 14.29 | 7 | 50 | 3 | 21.43 | 2 | 14.29 | 14 |
Near Katra region | 4 | 33.77 | 8 | 61.54 | 1 | 7.69 | - | - | 13 |
Near Customs office | 1 | 8.33 | 7 | 58.33 | 4 | 33.33 | - | - | 12 |
Katra bridge | 3 | 27.27 | 6 | 54.55 | 2 | 18.18 | - | - | 11 |
Near village e of Banekelan | 2 | 20 | 6 | 60 | 2 | 20 | - | - | 10 |
Near village of Bearky | 1 | 10 | 6 | 60 | 3 | 30 | - | - | 10 |
Near industrial region (East) | - | - | 5 | 50 | 5 | 50 | - | - | 10 |
Deoan bridge | - | - | 4 | 44.44 | 4 | 44.44 | 1 | 11.11 | 9 |
Near village of Kashty | - | - | 5 | 55.56 | 4 | 44.44 | - | - | 9 |
Near garage sulaimni | - | - | 4 | 44.44 | 3 | 33.33 | 2 | 22.22 | 9 |
Near city game | - | - | 8 | 88.89 | 1 | 11.11 | - | - | 9 |
Near industrial region (west) | 1 | 11.11 | 7 | 77.78 | 1 | 11.11 | - | - | 9 |
The end of tunnel | 2 | 25 | 5 | 62.5 | 1 | 12.5 | - | - | 8 |
Near the court | - | - | 3 | 42.86 | 4 | 57.14 | - | - | 7 |
Near village of Dardaooean | - | - | 3 | 50 | 2 | 33.33 | 1 | 16.67 | 6 |
Near Petrol station | 2 | 33.33 | 2 | 33.33 | 2 | 33.33 | - | - | 6 |
Near village of Bonkla | - | - | 4 | 80 | - | 1 | 20 | 5 | |
Kanysard intersection | - | - | 3 | 60 | 2 | 40 | - | - | 5 |
Near Saeedkaky building | - | - | 2 | 40 | 1 | 20 | 2 | 40 | 5 |
The most hazardous locations
International Journal of Scientific & Engineering Research, Volume 6, Issue 5, May-2015 1843
ISSN 2229-5518
Fig. (15) Ranking of hazardous locations according to the frequency method
However, the frequency method tends to rank high volume locations as high accidents locations, even if those locations have a relatively low number of accidents for the traffic volume. In addition accident severity has been neglected in this method. Therefore in this research the frequency method was used to select a group of high-accident locations and then accident severity method (EPDO) was used to rank the locations in order of priority. Accident severity method is shown in table (2) and figure (16).
From the table (2) and the figure (16) it can see that (Near village Chanara) and (Near Katra region) locations are the most vulnerable sites according to severity.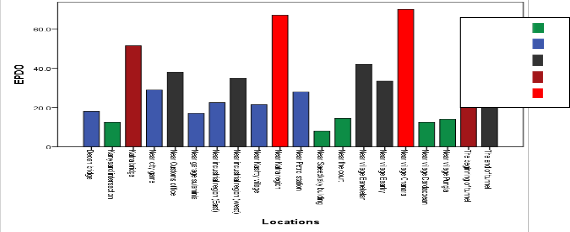
Table 2: the value of EPDO at locations
Location | EPDO |
Near village of Chanara | 70 |
The beginning of tunnel | 46.5 |
Near Katra region | 67 |
Near Customs office | 38 |
Katra bridge | 51.5 |
Near village Banekelan | 42 |
Near village of Bearky | 33.5 |
Near industrial region (East) | 22.5 |
Deoan bridge | 18 |
Near village of Kashty | 21.5 |
Near garage of sulemani | 17 |
Near fan fair | 29 |
Near industrial region (west) | 35 |
The end of tunnel | 37.5 |
Near the court of Darbandikhan | 14.5 |
Near village of Dardaooean | 12.5 |
Near Petrol station | 28 |
Near village of Bonkla | 14 |
Kanysard intersection | 12.5 |
Near Saeedkaky building | 8 |
EPDO: 0-15
EPDO: 15-30
EPDO: 30-45
EPDO: 45-60
EPDO: 60-75
International Journal of Scientific & Engineering Research, Volume 6, Issue 5, May-2015 1844
ISSN 2229-5518
Fig. (16) The ranking of hazardous locations according to the EPDO method
The statistical analysis of road accidents has the purpose to characterize the main trends of data so in this paper the statistical analysis was performed by using SSPS program and several results were recorded. Application of accident frequency method might be easy to determine the hazardous locations but it neglects the accident severity. Hence in this paper EPDO was brought in to hazardous locations identification to rank the locations in order of priority. The use of GIS enables to display the hazardous location on the map and ranking these locations in order of priority by using several colors.
1. The most of traffic accidents occur at the daytime due to congestion caused by large transport vehicles, so must specify the hours of the passage of these vehicles during certain hours at the nighttime, with provide the better level of lighting in the critical regions.
2. Many of hazardous external sites suffer from lack of the sight distance because of the trees, so must minimize these natural obstacles.
3. Transport routes in this region are one lane so must set up a two lane road to reduce
congestion and traffic accidents.
4. Most of accidents occur due to the excessive speed so should specify the speed by using the monitoring devices in critical areas and the imposition of fines on the offending cars.
5. Putting the warning signs in hazardous locations.
1- World Health Organization Fact Sheet, Road Traffic Injuries, March, 2013.
2- Pawlovich, M.D.,Estochen, B. and Strauss, T., “The Application of Geographic Information Systems to Improve Rural Highway Safety”, Center for Research and Education, Iowa State University. (1998).
3- Mustafa Karasahin & Serdal Terzi “Determination of Hazardous Locations on Highways through GIS: A Case Study-Rural Road of Isparta-Antalya”, International Symposium on GIS, September 2002, Istanbul-Turkey.
4- Deepthi Jayan. K& B. Ganeshkumar, 2010,“Identification of Accident Hot Spots: A GIS Based Implementation for Kannur District, Kerala, International Journal of Geomatics and Geoscience, volume 1, No 1, pp51-59, 2010
5- . Vatanavongs Ratanavaraha & Duangdao Watthanaklang “Road Safety Audit: Identification of Bus Hazardous Location in Thailand” India Journal of Science and Technology Vol. 6, PP.5126-5133, August 2013.
6- Supornchai Utainarumol and Rebert E. Stammer “an Evaluation of Methods for Identifying Hazardous Highway Locations” Journal of the Eastern Asia Society for Transportation Studies, Vol 3, No. 1, September 1999.
7- Ghulam H. Bham, Ph.D. and Uday R.R. Manepalli “Identification and Analysis of High Crash
Segments on Interstate”, Arkansas Highway and Transportation Department ,February 2009.
IJSER © 2015 http://www.ijser.org
International Journal of Scientific & Engineering Research, Volume 6, Issue 5, May-2015 1845
ISSN 2229-5518
8- Highway Safety Manuel 1st Edition, Roadway Safety Management Process, April 2009.
9.Nancy Dutta “ Spatial System for the Identification Analysis of High Crash Road Segments” ITE Technical Conference, April, 2011.
IJSER © 2015 http://www.ijser.org