International Journal of Scientific & Engineering Research, Volume 3, Issue 10, October-2012 1
ISSN 2229-5518
Spin Coated YSZ Thin Films on Silicon
Substrate
Shirley Tiong Palisoc, Rose Ann Tegio, Michelle Natividad, Simon Gerard Mendiola
Benjamin Tuason, Kevin Kaw and Stephen Tadios
Abstract— Yttria Stabilized Zirconia (YSZ) thin films (<10 μm) were fabricated by spin coating technique on silicon (Si). Parameters such as concentration ratio of YSZ powder to solvent were varied accordingly. The effects of these variations were investigated and discussed. Using X-ray Diffraction and Raman Spectroscopy, the crystal structure of the samples were determined. The 8-YSZ thin films have cubic fluorite structure. The X- ray diffraction patterns were in agreement with the samples’ Raman spectra. Pores were evident on single coated substrates but were minimized using higher YSZ concentration.
Index Terms—Yttria Stabilized Zirconia,YSZ, spin-coating, thin film
—————————— ——————————
1 Introduction
n order to answer the need for alternative sources of energy and to stop the effects of global warming, many researches and studies have risen, one of which is that on Solid Oxide Fuel Cells (SOFCs). A Solid Oxide Fuel Cell (SOFC) is an energy-converting device or electrochemical power generation device, which can directly generate electricity from chemical energy [1-3]. It can generate electricity at a high efficiency and in an environmentally friendly way. The commonly used material for the electrolyte of SOFC is Yttria-stabilized zirconia (YSZ) because it can work at high temperatures in a highly efficient way [4]. Furthermore, YSZ is readily available and is a good ion
conductor.
————————————————
Shirley Tiong Palisoc, Ph.D. in Materials Science is a professor at the Department of Physics, De La Salle University – Manila, Philippines E-mail: shirley.palisoc@dlsu.edu.ph
Rose Ann Tegio is a junior officer at PNB –Manila, Philippines
E-mail: michelle.natividad@dlsu.edu.ph
Michelle Natividad, Ph.D. in Physics is an assistant professor at the
Department of Physics, De La Salle University – Manila, Philippines
E-mail: michelle.natividad@dlsu.edu.ph
Simon Mendiola is a POSITION at Hitachi Philippines
E-mail: sg_mendiola@yahoo.com
Benjamin B. Tuason is a senior student at the De La Salle University –
Manila, Philippines
E-mail: benjamintuason@yahoo.com
Kevin Y. Kaw is a senior student at the De La Salle University – Manila,
Philippines
E-mail: kevinkaw08@yahoo.com
Stephen G. Tadios is a senior student at the De La Salle University – Manila,
Philippines
E-mail: benjamintuason@yahoo.com
Currently, conventional SOFCs operate at high temperatures (800○C -1000○C) [5]. The high operating temperature is necessary to obtain the maximum efficiency but as a consequence, it can cause reactions and interdiffusion in the cell especially in a long-term operation. As a result, it will reduce cell performance and efficiency [6].
In order to avoid the unnecessary reactions and complications, the current demand for the development of SOFC is to decrease the operational temperature to the range of 600○C -800○C (Intermediate Temperature SOFC or IT- SOFC) [5]. To be able to comply with the new operational temperature range and improve its operational life, it is necessary to decrease the electrolyte resistance and lower the overpotential of the electrodes [2]. The necessary adjustments can be done through decreasing the thickness of the electrolyte which should be less than 1µm.
Numerous techniques can be used in order to make a thin electrolyte. This includes chemical and physical deposition, such as electrochemical vapor deposition [5-6] or magnetron sputtering [4,6], and liquid precursor and powder processing techniques such as spin coating [6,7], die pressing [6]. The aforementioned techniques except for spin coating are very costly and insurmountable to do because these techniques require a lot of training and are cost-inefficient. At the given time frame, the only method that can be easily executed is the spin coating technique which is the least complicated and cost-effective.
IJSER © 2012 http://www.ijser.org
International Journal of Scientific & Engineering Research, Volume 3, Issue 10, October-2012 2
ISSN 2229-5518
This paper focused on the fabrication and characterization of YSZ thin films. Raman Spectroscopy was used as the main characterization technique in order to study and observe the effects of varying the YSZ to solvent ratio concentration (in weight %) (10YSZ: 90ethanol, 30YSZ: 70ethanol, and 50YSZ: 50ethanol) of YSZ and solvent of the YSZ thin films. The Scanning Electron Microscope (SEM) and X-ray diffractometer (XRD) were also used to characterize the fabricated films.
2 Experimental Procedure
2.1. Preparation of the YSZ thin film
8-YSZ ((Y203)0.08 (ZrO2)0.92) thin films were fabricated using the spin coating technique. Commercially available 8- YSZ powder (fuelcelmaterials, particle size: <1µm, purity:
99.9%) was diluted in ethanol (Figure 8b) (Aced Laboratory, purity: 95%) in order to make a suspension. The suspension was then homogenized using the ultrasonic stirrer for 3 hours.
spectroscopic technique using Raman Systems R-3000 (785nm and laser power ~290mW)
3 Results and discussion
3.1. XRD results
Figures 1 to 3 show the same diffraction angles for pre-sintered and sintered samples. This shows that the YSZ is very ideal to be used as a primary electrolyte material since there were no evident phase changes (i.e. appearance of new peaks or doubling of peaks) seen in the pre-sintered and sintered samples. If there was phase change this would greatly affect the performance of the electrolyte because the crystal structure of the electrolyte would be constantly subjected to phase change while operating.
All diffraction patterns for both Figures (22 & 23) have
o
This homogenizing process was done in all sample
similar location (in 2θ) of peaks approximately at 30
(111),
concentrations, specifically, 10YSZ:90ethanol, 30YSZ:70ethanol and
35o
(200), 50o
(220), 59o
(311), 63o
(222) and 74o
(400). The
50YSZ:50ethanol. (Note: the YSZ and ethanol ratio is expressed in
most prominent peak (2θ) coming from the substrates can be
weight percent)
located at 69o
- 70o.
The substrate underwent two coating stages. The first coating stage had a rotation speed of 700rpm for 6 seconds and the second cycle had a rotation speed of 2400-2500 rpm for 25-30 seconds.
The coated substrate was baked in a furnace at 300○C for
3 minutes to remove excess moisture. Then the coated substrate was sintered in a furnace at about 650○C for 4 hours with a heating and cooling rate of 2C○/min.
2.2. Characterization of YSZ thin films
The morphology and cross-section of the sintered samples were studied under the scanning electron microscope (SEM) (JEOL- 5310). Crystal structure and phase change identification of the pre-sintered and sintered samples were studied through x-ray diffraction (with Scan range: 27o-
83o, Step size: .02 o, Time per step: 0.5s with Cu-Kα radiation, λ=1.541Å as the parameters). Crystallite size was measured and estimated using Scherer expression [8] (Eq. 1).
Comparing the intensity of diffraction peaks of Figure 1
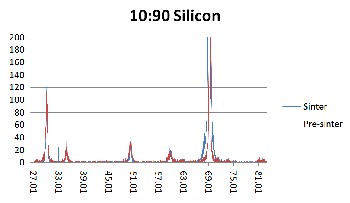
to Figure 3, it is evident that the peaks of the sintered samples are higher. This increase of intensity means that larger crystals are present. Since the intensity increases, the width of the peak narrows and basing from Equation 1 as β decreases, t increases.
Figure 1. XRD results of 10YSZ:90Ethanol weight percent ratio on silicon (Si)
substrate for pre-sintered (red) and sintered (blue) samples.
t .94
cos
(1)
Where t is the crystallite size, λ is the X-ray wavelength (λ=1.541Å), β is the full width at the half maximum intensity (FWHM) in radians and θ is the Bragg angle. The pre sintered and sintered samples were also characterized by Raman
IJSER © 2012 http://www.ijser.org
International Journal of Scientific & Engineering Research, Volume 3, Issue 10, October-2012 3
ISSN 2229-5518
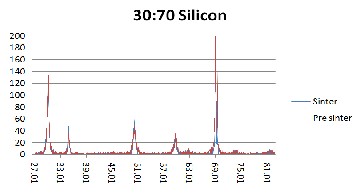
Figure 2. XRD results of 30YSZ:70Ethanol weight percent ratio on silicon (Si)
substrate for pre-sintered (red) and sintered (blue) samples.
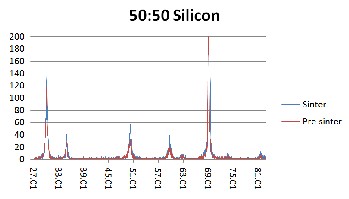
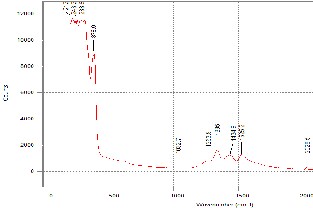
Figure 3. XRD results of 50YSZ:50Ethanol weight percent ratio on silicon (Si)
substrate for pre-sintered (red) and sintered (blue) samples.
3.2 Raman results
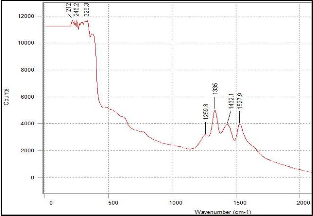
Raman spectroscopy was used in order to confirm the results of the XRD. Since this technique is much more sensitive, it would confirm that there are other phases (i.e. tetragonal or monoclinic) of YSZ existing in the film. According to the results, the Raman peaks of all samples were consistent all throughout. The first set of peaks ranging from 370/cm to 750/cm were obtained, which showed a good fit with the results of A. Gosh et. al. (2006).
But since the Raman results obtained in this research has a wider scan range, a second set of peaks appeared at range of 1200/cm to 1550/cm. Both sets of peaks are attributed to YSZ and not to any impurity that may be present. As can be seen from Fig. 4 to 6, the peaks in the pre sintered and sintered samples have the similar peak position (wavenumber cm-1). The peaks in the sintered samples are higher and more defined. This affirms the XRD results where sintering alleviates the level of crystallization. Furthermore, as the intensity of the Raman peak increased, the width of the peak decreased as well. This is additional evidence that the YSZ crystal size became larger (better quality).
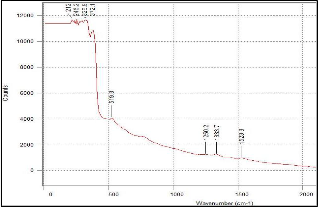
(a)
(b) 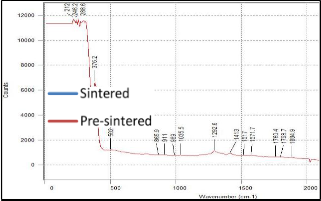
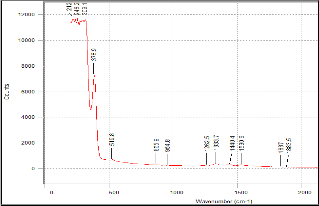
Figure 4. Raman results of 10:90 YSZ ratio on silicon substrate (a) before sintering and (b) after sintering.
(a)
IJSER © 2012 http://www.ijser.org
International Journal of Scientific & Engineering Research, Volume 3, Issue 10, October-2012 4
ISSN 2229-5518
(b) 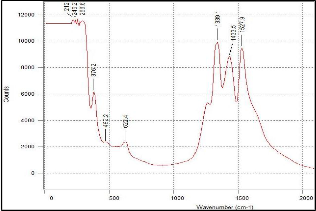
Figure 6. Raman results of 50:50 YSZ ratio on silicon substrate (a) before sintering and (b) after sintering.
The Raman peaks are due to the polarizability associated with the oxygen ion vacancies. These vacancies introduce disorder in the lattice that brings a change between the Zr-O bond length and angle [9]. Thus, this makes the crystallite easier to polarize. In effect, more peaks can be observed. Since the sintered samples have larger crystals, these resulted to larger distortions. In effect, sharper and higher Raman peaks are detected.
TABLE I
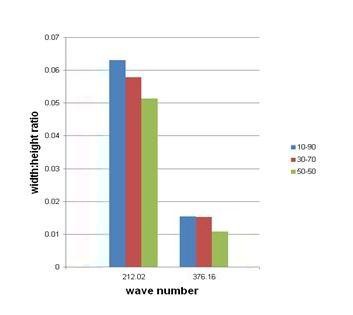
Width to height ratio of Raman peaks of 10%wt, 30%wt and 70%wt YSZ films on silver substrate
(b)
Figure 5. Raman results of 30:70 YSZ ratio on silicon substrate (a) before sintering and (b) after sintering.
(a)
Fig 7. Width to height ratio of Raman peaks of 10%wt, 30%wt and 70%wt YSZ
films on silicon substrate
IJSER © 2012 http://www.ijser.org
International Journal of Scientific & Engineering Research, Volume 3, Issue 10, October-2012 5
ISSN 2229-5518
Table I lists the three different YSZ concentrations and their corresponding width to height ratios.
Figures 4 to 6 indicate that the substrate is not a factor in the position of the Raman peaks. There was little or no shift in the Raman peaks as the substrate was changed.
Figure 7, on the other hand, shows that peak intensity increases as YSZ concentration increases, a result that verifies the findings of Umbach and Hines [10].
3.3 SEM results
3.3.1. Surface Analysis
3.3.1.1. 10YSZ:90ethanol
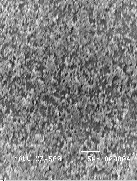
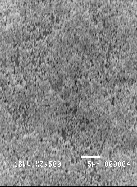
Figure 8 shows the SEM micrographs of sintered YSZ (10:90) deposited on silicon (Si). From Fig. 8(a), it can be seen that there are portions where the deposition is denser. This accumulation is primarily caused by the roughness of the substrate that makes more of the solution to deposit in the pits of the substrate. In effect, the material is not deposited evenly. In Fig. 8(a), the material was deposited on the etched part of the substrate making the uneven deposition more evident.
Large density of pores can also be observed from the surface of the 10:90 YSZ films (Figure 8(b)). High porosity on silicon can be attributed to the fact that the material was deposited on the etched part of the substrate. As a result, the material is compelled not to distribute evenly throughout the surface of the substrate. Due to this uneven distribution, some areas have a thinner deposit. This makes those areas with thinner layer more prone to pores due to the insufficiency of material to cover the pores.
(a)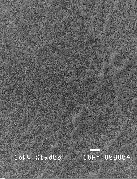 (b)
(b)
Figure 8. SEM micrograph of sintered 10:90 YSZ ratio, spin coated on silicon (a) x1,000 and (b) x3,500.
3.3.1.2. 30YSZ:70ethanol
In Fig. 9, in terms of accumulation of material, relatively it is almost the same with the previous figure. The only difference between 30:70 YSZ films and 10:90
YSZ films is the amount of accumulation where the
30:70 YSZ film has fewer accumulation. This is because in this batch of samples, there is more YSZ in the suspension thus, making the suspension more viscous. Due to this increase of YSZ material, 30:70
YSZ films are denser compared to the 10:90 YSZ films because there is sufficient YSZ available that can cover the pores.
(a)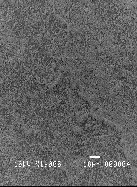 (b)
(b)
Figure 9. SEM micrograph of sintered 30:70 YSZ ratio, spin coated on silicon (a) x1,000 and (b) x3,500.
3.3.1.3. 50YSZ:50ethanol
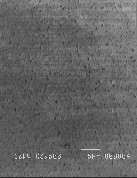
In Figure 10, there are no evident accumulations on
any substrate. This absence of accumulation can be attributed to the density of the deposited suspension.
Due to abundance of YSZ material, the 50:50 YSZ film (Figure 10(b)) became very dense and the pores are smaller compared from the other film concentration. In Figure 10(b), the film has very few pores (pinhole like).
(a)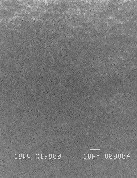 (b)
(b)
Figure 10. SEM micrograph of sintered 50:50 YSZ ratio, spin coated on silicon (a) x1,000 and (b) x3,500.
3.3.2. Cross-sectional Analysis
3.3.2.1. 10YSZ:90ethanol
IJSER © 2012 http://www.ijser.org
International Journal of Scientific & Engineering Research, Volume 3, Issue 10, October-2012 6
ISSN 2229-5518
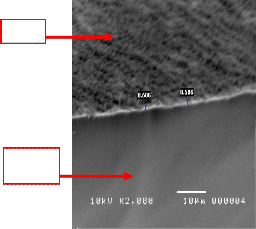
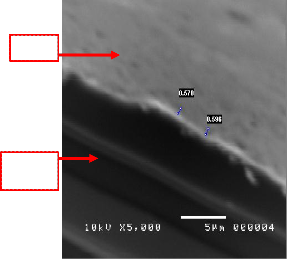
Figure 11 shows a cross sectional view of a spin coated 10:90 YSZ. It shows that making a thin film through spin coating (≤1µm) is very possible in this concentration. But there are complications when using the 10:90 YSZ concentrations. Firstly, the film that will be created using this type of concentration is very prone to accumulation.
Film
Film
Silicon
Subs.
Silicon
Subs.
Figure 11. SEM micrographs of sintered 10:90 YSZ ratio, spin coated on silicon at 2500rpm for 30 seconds.
3.3.2.2. 30YSZ:70ethanol
As shown in Figure 12, this is the cross sectional
micrograph of a spin coated 30:70 YSZ. When using a
30:70 YSZ concentration, it is still possible to achieve a thin film (≤1µm) through spin coating. Furthermore, the micrograph of Figure 12 shows that the film is almost uniform in every section of the film. This goes to show that spin coating technique is very ideal in order to produce an even thin film.
Figure 12. SEM micrographs of sintered 30:70 YSZ ratio, spin coated on silicon at 2500rpm for 30 seconds.
3.3.2.3. 50YSZ:50ethanol
Figure 13 shows, the cross sectional micrographs of
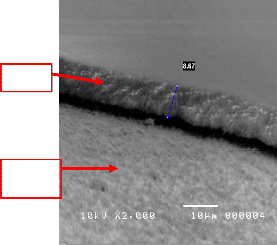
a spin coated 50:50 YSZ. When using a 50:50 YSZ concentration, it would be very difficult to achieve a thin film (≤1µm) through spin coating because 50:50 concentration is very viscous. Longer spin time should be considered in order to produce thinner 50:50 YSZ film.
Film
Silicon
Subs.
Figure 13. SEM micrograph of sintered 50:50 YSZ ratio, spin coated on silicon at 2500rpm for 30 seconds (cross-section view).
Listed on Table II are the respective thicknesses of the thin films according to YSZ concentration
TABLE II
IJSER © 2012 http://www.ijser.org
International Journal of Scientific & Engineering Research, Volume 3, Issue 10, October-2012 7
ISSN 2229-5518
THICKNESS OF FILMS (in µm)
4. Conclusion
X-ray Diffraction
The XRD patterns revealed a cubic fluorite structure. X-ray diffraction techniques identified that the YSZ material is very stable since in every case or parameter imposed (YSZ to ethanol concentration) in the material the diffraction pattern is more likely the same. Furthermore, XRD results also showed that sintering increases the intensity of the diffraction peaks. This increase in intensity means that larger crystals are present [6].
Raman Spectroscopy
Raman spectroscopy results further confirmed the results of the XRD that the samples have cubic fluorite structure and that the YSZ thin film did not undergo any phase change. The only changes that occurred are the increase in intensity and narrowing of the Raman peaks. This means that larger crystals were present that made the scattering more concentrated.
Scanning Electron Microscope
The surface micrographs shows that the problem of accumulation of materials that causes uneven distribution of the film can be resolved by using a higher concentration of YSZ or by using a substrate that is very smooth and even. By using a higher concentration of YSZ in a suspension, pore density can also be minimized. But as a consequence of using higher concentration of YSZ, it is expected that the film that will be fabricated will be thicker.
References:
[1] M. Ellis, Fuel Cells for Building Applications, New
York NY: McGraw-Hill, 2002.
[2] T. Komikado, A. Inoue, A. Takashi, & S. Umegaki, Multi-layered mirrors fabricated by spin-coating organic polymers. Thin Solid Films. 515 (2006),
3887-3892.
[3] C. Spiegel, Designing and Building Fuel Cells, New
York NY: McGraw-Hill, 2007.
[4] K. Easler, & K. Kuan, (Eds.), Fuel Cell Electronics Packaging. New York, NY: Springer Science + Business Media, 2007.
[5] X. Xu, C. Xia, S. Huang, & D. Peng, YSZ thin films
10 wt% YSZ | 30 wt% YSZ | 50 wt% YSZ |
0.506 | 0.578 | 8.76 |
deposited by spin-coating for IT-SOFCs. Ceramics
International. 31 (2005), 1061-1064.
[6] Y. Pan, J. H. Zhu, M. Z. Hu, & E. A Payzant, Processing of YSZ thin films on dense and porous substrates. Surface & Coatings Technology. 200 (2005), 1242-1247.
[7] B. S. Yahia, L. Znaidi, & J. P. Petitet, Raman study of oriented ZnO thin films deposited by sol–gel method. Spectrochimica Part A. 71(2008), 1234-
1238.
[8] W. Tennyson. X-ray Diffraction-The basics Followed by a Few Examples of Data Analysis. (2007) Retrieved from http://www.nhn.ou.edu/~bumm/NanoLab/ppt/X- ray_Diffraction_files/frame.htm December 14, 2010
[9] A. Gosh, A. Suri, M. Pandey, S. Thomas, T. Rama Mohan, & B. T. Rao. Nanocrystalline zirconia-yttria system–a Raman study Materials Letters 60 (2006),
1170-1173.
[10] Umbach, C. C. & Hines, M. A. (2009). Applications of Raman Spectroscopy [PDF Document]. Retrieved from http://www.ccmr.cornell.edu/igert/modular/docs/Ap pl_of_Raman_Spectroscopy.pdf
IJSER © 2012 http://www.ijser.org