International Journal of Scientific & Engineering Research, Volume 4, Issue 8, August-2013 1805
ISSN 2229-5518
Sodar studies of air pollution meteorology over
Delhi
Neha Gera1, N.C.Gupta1 , V. Mohanan2 , B.S. Gera2
Abstract— The studies present an analysis of air pollution meteorological aspects of Delhi in terms of the occurrence characteristics of stable
/unstable atmospheric boundary layer (ABL) thermal structures using a decade long (2001-2010) sodar observations made at the National Physical La- boratory (NPL), New Delhi. Diurnal, monthly and seasonal variation of ground/elevated inversion, thermally driven convection atmospheric boundary layer and fumigation characteristics have been examined. Results reveal that Delhi witnesses a good atmospheric ventilation period of about 7 hours (1000-1700 hours) during the day while it observes poor ventilation characterized by stable inversion for about 10 hours (1800-0600 hours). Fumigation period shows seasonal dependence varying from couple of hours to more than 6 hours during winter fog conditions. The information is useful to evaluate pollutants carrying capacity of Delhi, environment impact assessment, seasonal strategies planning for emission etc.
.
INDEX TERMS—AIR POLLUTION METEOROLOGY, ATMOSPHERIC BOUNDARY LAYER, FUMIGATION, INVERSION, MIXING HEIGHT, STABILITY, SODAR.
—————————— ——————————
1 INTRODUCTION
elhi, the national capital territory of India has the distinc- tion of being one of most polluted metropolis in the world. In fact, in the scenario of economic race and the
lust of luxurious living among the developing countries has led to the uncontrolled growth rate of human activities con- taminating the air. In pursuit of the same, Delhi has been wit- nessing a notable change in the rural-urban composition, growth of industrialization, population, vehicular traffic den- sity, unplanned urbanization with poor ventilation. The activi- ties are still further on the rise and continuously loading the city pollution level. Unplanned expansion of urban develop- ment in densely built cities, clustering of houses with narrow lanes, the amount of vertically placed gaps, permeability and porosity of the cityscape are known to affects the city ventila- tion and wind environment. The buildings introduce localized turbulent zones which readily force the pollutants to the ground (concept known as building downwash). Furthermore, industrial zoning in areas of poor ventilation environmental sites also add on to the pollution problems. The collective con- tribution of these factors has placed Delhi among the most polluted metropolis of the world.
The concern for air quality management has been well real-
————————————————
• Neha Gera is currently pursuing Ph.D in university school of environment management, GGSIPU, India, Delhi, PH-9958878884.
E-mail: nehagera@gmail.com
• N.C Gupta is Associate Professor in USEM,GGSIPU, India,E-mail:
ncgupta1@gmail.com
• V.Mohanan & B.S. Gera- scientist at National Physical Laboratory, Delhi
ized by the public and the national pollution control authori- ties and is sounding alert for action. However, the action for a comprehensive cost effective lasting strategies for the short term as well as long term air quality management banks upon the knowledge, understanding and logical analysis of air qual- ity damaging and the practically feasible control means be- cause an imbalance between the two leads to good or bad quality of air that we breathe.
Further, the quality of breathing air is determined by the load of suspended pollutants, particularly the respirable particulate matter (RSPM) and toxic gases as they practically become a part of breathing air that enters the body and causes health hazards. Thus, the real challenge of air quality management lies in handling the polluted air itself. The straight forward options are: (1) stop industries/emissions which is against the economic interest and sustainable development of the country or (2) provide effective ventilation to the polluted air or (3) control emissions within tolerable limits for health safety. Ven- tilation is a natural process driven by horizontal and vertical winds and is not in our control. Therefore, only practical op- tion is to control emission within safety limits of tolerance. The standards of safety limits are fixed by medical science. Thus, the load of strategies of emissions needs to be regulated in such a way that total load of pollutants in the ABL remains within natural ventilation or atmospheric carrying capacity. The natural ventilation is driven by characteristics of city spe- cific climatology and the meteorological processes such as wind, inversion, thermal convection etc. which govern ABL stability and accordingly support dispersion, migration, ac- cumulation of pollutants and determine atmospheric carrying capacity of pollutants. Therefore, knowledge about the charac-
IJSER © 2013 http://www.ijser.org
International Journal of Scientific & Engineering Research, Volume 4, Issue 8, August-2013 1806
ISSN 2229-5518
teristics of natural ventilation process and its operational un- derstanding is vital for making its effective use in air quality management.
1.1 CITY VENTILATION AND CLIMATOLOGY
Natural ventilation process of polluted air involves is re- placement or dilution by fresh air, gravitational settling of heavier particulate matter, migration of pollutants to higher heights by thermal buoyancy and the horizontal diversion to sink areas (ocean/ forest etc) by action of wind flow. There- fore, the ventilation efficiency banks upon harnessing the wind and the thermal buoyancy forces. The temperature gra- dient between the interior and exterior environments drives the air flow and plays a significant role in providing natural ventilation during course of the day. The vertical temperature gradient creates vertical mixing of air up to the reaching height of thermal buoyancy. This height is commonly known as the mixing height of pollutants defines vertical room size of pollutants and a qualitative indicator of air quality. Further- more, depending upon the location of the polluting source, the buoyancy forces (or stack effect) may assist or oppose the wind-driven flow and thereby affect the air exchange rate and the thermal stratification.
Therefore, a knowledge of the characteristics of thermally driven free convection is important to make effective utiliza- tion of the good ventilation periods for emissions during the day. On the other hand occurrence inversions during the night oppose the said ventilation process and exhibit poor condition of natural ventilation. Interestingly, both the good and the bad ventilation conditions both occur on daily routine basis, in a cyclic order, in association with sun rise and sun set. However, deviations in their occurrence characteristics may be seen dur- ing local/synoptic disturbed weather conditions. Therefore, characterization ABL ventilation process in terms of inversion, thermally convective ABL and the transition periods is an im- portant concern of air pollution meteorology.
These processes being manifestations of incoming solar radia- tion and earth-atmosphere energy exchange exhibit site specif- ic characteristics of diurnal/seasonal variations in accordance with underlying topographical features, prevailing lo- cal/synoptic weather variations. As such the city specific changing parameters such as population density, city struc- ture, urbanization, topographical features, deforestation, in- dustrial zoning etc. have a bearing on the city ventilation characteristics. Therefore, practically, the city specific air pol- lution meteorology forms a back bone of air quality because it determines carrying capacity of pollutants and thereby directs needs of regulations for emissions.
In view of above, the present focused study of air pollution meteorological over Delhi assumes significance to evaluate city ventilation and environment impact assessment (EIA) with respect to city expansion, growth of industries etc. The
outcome will be useful for the pollution control agencies, envi- ronment consultants, city planers, researchers etc. for evalua- tion of environment impact assessment, regional carrying ca- pacity and accordingly plan strategies for environment man- agement.
Therefore, a consideration of city climatology, here under, is also important while evaluating city air pollution meteorolo- gy.
1.2 CLIMATOLOGY OF DELHI
The climate of Delhi is humid subtropical type which is mon- soon-influenced and shows high variation in temperature and precipitation between summer and winter. Delhi has relatively dry winters and a prolonged spell of very hot weather. Sum- mers start in early April and peak in May, with average tem- peratures near 32oC, although occasional heat waves can result in temperature highs close to 45o C on some days.
The monsoon starts in late June and lasts until mid-September, with rainfall of about 797.3 mm. With temperatures varying from around 25oC on rainy days to 32oC during dry spells. The average temperature during monsoon is around 29oC. The monsoons recede in late September and the post-monsoon season continues till late October, with average temperatures sliding to about 21o C.
Winter starts in November and peaks in January with average temperatures being around 12-13oC. Although winters are generally mild yet Delhi’s proximity to the Himalayas results in cold waves that regularly dip the temperatures below freez- ing. Dense fog is seen during the winter months (December and January). At times the reduced visibility, due to fog, leads to disruption of road, air and rail traffic. They end in early February, and are followed by a short spring till the onset of the summer.
The annual extreme temperatures have ranged from −0.6 °C to
47 °C.
2 AIR POLLUTION METEOROLOGY ON SODAR SCALE
Sodar is a proven potential tool for air pollution meteorological studies associated to atmospheric mixing processes ( Brown and Hall, 1978; Mikhail and Lokoshchenko,
2002; Neff and Coulter, 1986; Clifford et al., 1994;Gera and Saxena, 1996; Coulter and Kallistratova, 1999;Assimakopoulos and Helmis, 2003). It provides pictorial view of the real time dynamics of the prevailing meteorological process such as thermal plumes; ground based/elevated stable inversion layer (with flat top, short/tall spiky top), multiple layers, wavy layers, dot echoes etc. These structures serve as the
IJSER © 2013 http://www.ijser.org
International Journal of Scientific & Engineering Research, Volume 4, Issue 8, August-2013 1807
ISSN 2229-5518
qualitative indicator of atmospheric stability and the stack plume behavior. The fine structural information can deliver quantitative information about ABL mixing height and the Pasquill stability class ( Singal et al.,1985).
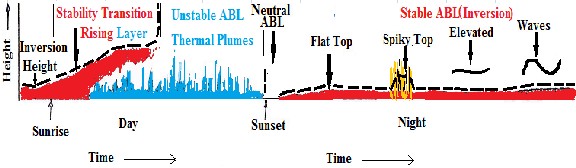
Sodar registers a characteristic repeatable patterns of pollution concerned meteorological processes, in a cyclic order on diurnal scale, in accordance with solar heating and nocturnal cooling of the ground. The cycle exhibits the occurrence of four stages of ABL stability beginning with unstable during the day followed by neutral in the evening at around sun set, stable during the night, transition from stable to unstable at around sun rise in the morning and it repeats again. Sodar translations of the meteorological cycle in terms of fine structural details exhibits occurrence of thermal plumes during day time sunny hours, zero structure in the evening transitional phase of stability, ground based stable layer (inversion) during the night time and a rising layer with thermal plumes beneath during morning transitional phase. A schematic diurnal cycle is shown in Fig. 1. Dotted line marking top of ground based layer gives height of stable ABL during night time.
Fig.1 Schematic echograms depicting meteorological cycle of ABL stabil- ity/ height
Each stage of the meteorological cycle is significant in air qual- ity management:
(1) Thermal plumes are indicators of good ventilation and mi- grate the pollutants to higher heights. The information of plume dimensions of height defines the room volume availa- ble for dilution of pollution concentration. The information about the onset, dissipation and the duration of occurrence of thermal plumes can be utilized to harness the natural disper- sion conditions to our advantage for planning release of pollu- tants.
(2) No Structure in the evening indicates near neutral state of atmospheric ventilation and a pre alarm of coming in poor ventilation conditions (stable ABL) forward so as to be pre- pared for controlled minimum emissions.
(3) Inversion during the night accumulates pollutants within it and leads to high concentration of pollutants. Thus, prolonged
persisting inversions pose a threat to air quality. Moreover, inversion height is useful in fixation of stack heights because their relative heights govern the outflow characteristics of pol- lutants and the possible impact on inhabitants on ground.
(4) Rising layer indicates the morning transitional phase of stability, from stable to unstable (near sun rise) and pre alarm of atmospheric switching on to good ventilation conditions so as to be effectively utilized for emissions. However, during the transition period witness erosion of the inversion base and downward fumigation of the overnight trapped pollutants because upward dispersal is dissuaded by inversion aloft. Therefore, fumigating overnight effluents and the fresh emis- sions during this period both start mixing downward towards the ground and would lead to much higher ground level con- centrations of pollutants. As such, the presence of rising layer is a directive to avoid emissions untill complete erosion of inversion is followed by occurrence of thermal plumes and there after the cycle repasts.
Since the thermal plumes during the day offers good ventila- tion, therefore, the information about over of fumigation and the onset of thermal convective unstable ABL can be utilized to regulate the operational hours of smoke spewing industrial units and even plan the traffic transit to avert adverse im- pact of pollutants.
The described diurnal air pollution meteorological cycle or sodar structures is normally seen every where, irrespective of topographical variations, in accordance with solar heating and nocturnal cooling of the ground. Deviations in terms of the residence time of each individual structure (thermal plumes, inversion and fumigation) may be observed depending upon variations of site specific climatology and topographical condi- tions form one place to the other place. Further, the complexi- ties of structural deformations may be observed in terms of spiky, wavy character of inversion layer, elevated layers, su- perimposition or co-existence of multiple thermal structures, persistence, absence or prolonged delays in onset/dissipation of prevailing structure due to changes in local or synoptic weather conditions. Study of these variations in correlation with wind variations has been used to further determine Pas- quil stability class (Singal et al., 1985) that is useful in air pol- lution dispersion modeling.
However, the real time and the statistical information about diurnal/ seasonal variations in the characteristics of meteoro- logical cycle have tremendous utilitarian scope to parameter- ize city specific air pollution meteorology.
IJSER © 2013 http://www.ijser.org
International Journal of Scientific & Engineering Research, Volume 4, Issue 8, August-2013 1808
ISSN 2229-5518
3 PARAMETERIZATION OF ABL STABILITY AND MIXING
HEIGHT
The basic parameters of interest in air pollution for parame- terization, in sodar environment, are inversion/mixing height and the stability class. In this context, sodar echograms pro- vides a direct information of broad stability (stable, unstable and neutral) and the height of stable ABL as the top of the ground inversion. However, fine structural details are used to determine the stability class while an empirical relation (valid for Delhi) is used to determine mixing height of unstable ABL (Singal et.al., 1985: Singal et al.,1990). The said methods have been used in the present work for parameterization Delhi pol- lution meteorology in terms of occurrence characteristics of inversion/mixing height, stability class, diurnal and seasonal variations, persistence characteristics the of ground inver- sions, low altitude elevated capping inversions, fumigation periods etc. The dotted line in Fig.1 illustrates the methodolo- gy to determine inversion/ mixing height from sodar echo- grams.
It may be mentioned that the Sodar measured height of con- vectively rising thermal night. However, a true measure is available in case thermal plumes are capped by a stable inver- sion layer. In view of the problem, empirical relation was de- veloped through correlation of sodar measured plume height and the actual mixing height computation using radio sonde temperature profile of IMD station at Aya Nagar, Delhi. The relationship developed Delhi has been found to be valid ( Singal et al.,1990) for another site in India. Therefore, the rela- tionship, given below, is used in the present work to compute day time mixing height.
Mixing Height (convectively unstable ABL) = (4.24 Ph + 95)
meters
Where Ph is the sodar recorded height of thermal plume (in meters)
4 DATA ANALYSIS
Based on above methodologies to determine mixing height of stable and unstable ABL, we have analyzed hourly averaged sodar data pertaining to the decade long period (2001-2010) collected at the National Physical Laboratory, New Delhi. The monthly distribution of observational days and the number of hours of data for each month are shown in Fig. 2. Total data of
38280 hours spread over 2056 days is more or less evenly dis- tributed during different months of the year except for mon- soon months (July-August) due to rains. The data has been analyzed in terms of occurrence characteristics of the diurnal variation of inversion/ mixing height, elevated capping in- versions, fumigation periods etc.
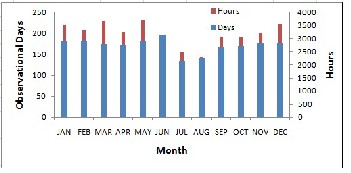
Fig. 2 Monthly Distribution of sodar observational days and hours (2001-
2010).
4.1 ABL STABILITY DISTRIBUTION
The hourly data analysis of ABL stability in terms of the oc- currence of various sodar structures referring to stable, unsta- ble, morning and evening transitional phases of neutral stabil- ity (including no echo and totally black echoes due strong sur- face winds) is shown in Fig.3. It is seen that stable atmospheric conditions (stability E and F) are observed for 56.9 % of the observational period. Unstable conditions (stability A, B and C) represented by the clear thermal plumes on sodar echo- grams are seen for 32%. Morning transitional phase (stability C) of eroding inversion (rising layer) is observed for 7.8% and the neutral stability class D (no echo or dark echo) is seen for
3.3 % during the study period. Further subdivision of stable atmospheric conditions into spiky inversion (stability E) and flat top inversion (stability F) shows that flat top inversion is seen for about 21.4% while spiky layers have occurred for
35.5% during the stable period.
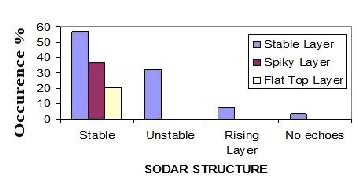
Fig.3 Distribution of atmospheric stabilities (sodar structures) over Delhi
(2001-2010)
Further, diurnal variation of ABL stability has been studied in terms of the occurrence characteristics of the associated ther- mal structures of flat top, spiky / elevated / rising layer and
IJSER © 2013 http://www.ijser.org
International Journal of Scientific & Engineering Research, Volume 4, Issue 8, August-2013 1809
ISSN 2229-5518
thermal plumes (Fig. 4). It is seen that maximum occurrence of stable ABL is in general confined within period of 1800-0600 hours while that of unstable ABL is observed during 1000-1700 hours. The Morning transitional phase of rising layer lies over the period of 0600-1000hours and the evening transitional phase of stability is seen around 1700-1800 hours. Further ex- amination of the occurrence structures of stable ABL shows that flat top layers are mostly confined up to around mid night hours while significant occurrence of spiky layers is seen dur- ing early morning hours (0400-0700 hours). The highly stable ABL, indicated by elevated layers, are seen during the post mid night hours ( 0100-0400 hours).
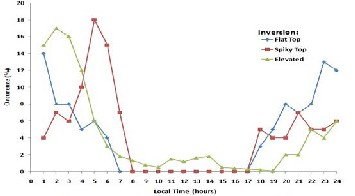
Fig.4 Diurnal variation of ABL Thermal structures over Delhi (2001-2010)
The studies concerning the diurnal variation of height of sta- ble/ unstable ABL (inversion/ mixing height) shown in Fig.5 reveals a maximum ABL height about 1.2 Km around during thermally convective unstable ABL conditions around noon (1200-1400 hours). While minimum height of about 50m is seen during stable atmosphere conditions.
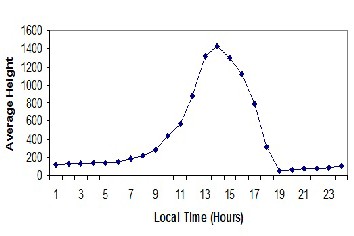
Fig. 5 Diurnal variation of ABL height over Delhi (2001 - 2010)
4.2 STABLE ABL CHARACTERISTICS
The height of stable ABL (inversion) grows with advance of time, in accordance with the increasing radiational cooling of
ground. As such maximum/minimum inversion heights are seasonal dependent. Inversion arrests pollutants within its own height, therefore, a knowledge of occurrence characteris- tics inversion, over the year, is important for air quality stud- ies. In this context, the month wise occurrence of the inversion layer (flat top/ spiky and elevated layers) during the period of stable ABL (1800 - 0600 hours) has been analyzed (Fig.6) as per sodar records. It is seen that occurrence of flat top inversion is more or less evenly distributed during the year except for the monsoon period ( July-August) wherein the occurrence of spiky layer is predominate. As spiky characteristic is associat- ed with winds, it considered that the maximum occurrence of spiky layers during the monsoon season is attributed to sea- sonal winds of monsoon. Elevated inversion layers mostly seen to occur during the winter months (November to Janu- ary) and the pre monsoon period (May-June). The occurrence during winter period is, as per visual observations, is seen to be associated with occurrence of fog and incursion of cold wave due to passage of western disturbances during winter. The occurrence during pre monsoon is presumed to be associ- ated with development of shear conditions due occurrences of weather disturbances of dust storm, thunderstorm, frontal disturbances etc,
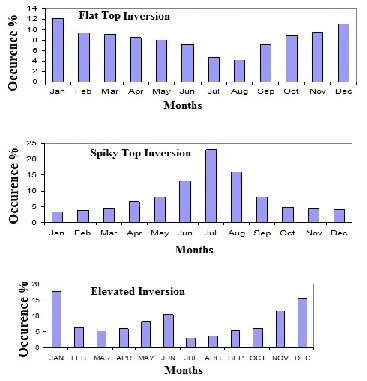
Fig.6 Month wise occurrence of stable atmospheric thermal structures
(Flat top / spiky top / elevated inversions) over Delhi (2001-2010)
Further, the monthly occurrence of the hourly averaged in- versions height of flat / spiky top and elevated inversions per- taining to the stable period (1800-0600 hours) is shown in
IJSER © 2013 http://www.ijser.org
International Journal of Scientific & Engineering Research, Volume 4, Issue 8, August-2013 1810
ISSN 2229-5518
Fig.7. It shows that the maximum of averaged inversion height with flat top (143 m) is observed during the proximity of win- ter (October-November) while minimum height of 82m is seen during the post winter month of March. The height of spiky layer is maximum (265m) during July and minimum of 153m during post winter month of February. The maximum height of elevated inversions is seen to be 330 m during pre monsoon month of May and minimum height of 225 is observed during the winter month of January. Based on correlation with visual weather conditions, it is considered that the low lying elevated inversions during winter are associated with occurrence of fog and western disturbances while comparatively higher altitude elevated layers during the pre monsoon are associated with the shear.
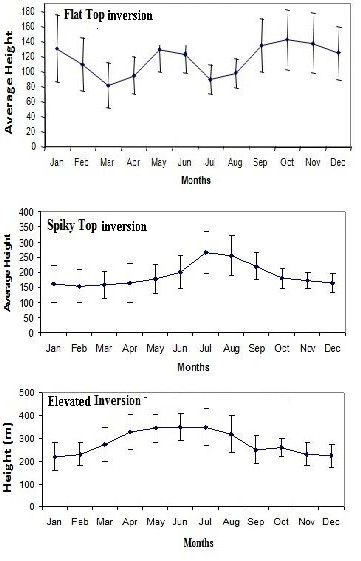
Fig. 7 Monthly inversion average height over Delhi during 1800-0600 hours (2001-2010)
Furthermore, the maximum of inversion height is normally associated with the period of maximum cooling (0300-0500 hours) at night while maximum height of thermal plumes is associated with the period of maximum ground heating (12000-1400 hours) during the day. Therefore, the data pertain- ing to these periods has been analyzed to examine cumulative occurrence probabilities of the maximum of inversion and mixing height over Delhi. The studies show (Fig.8) that inver- sion height varies from minimum 60 meters to more than
400m. The occurrence probability for inversion height up-to 75 meters is more than 90% while probability of inversion reach- ing up-to 150m is 83%. There is more than 50 % probability for the inversion to be within 175m and it can reach up-to 225 with occurrence probability of 25 %. The chance of inversion height being more than 250 meters is about 8% only.
Similar analysis for the day time convectively driven ABL mixing height shows that mixing height (considering only clear weather conditions) varies between a minimum of 800m to more than 2 km. For 83 % of the time it more than 1 Km, for
35 % it is more than 1.4 Km and for 12% it is more than 1.5 km
for occurrence probability.
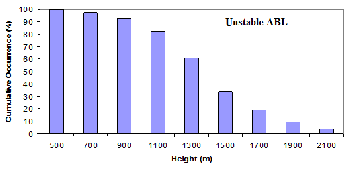
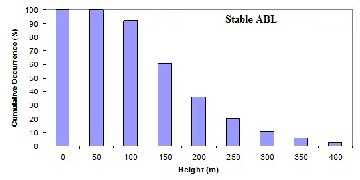
Fig.8 Cumulative occurrence percentage of stable (inversion) and unstable
(thermal plumes) ABL mixing height over Delhi (2001 - 2010)
4.3 CHARACTERISTICS OF ERODING INVERSION: FUMIGATION
City Fumigation period is an important parameter of concern for air quality considerations. The month wise duration of the fumigation period as per the persistence of eroding inversion (rising layer) on sodar records is shown in Fig.9. It is seen that
IJSER © 2013 http://www.ijser.org
International Journal of Scientific & Engineering Research, Volume 4, Issue 8, August-2013 1811
ISSN 2229-5518
fumigation lasts for about couple hours during summer (April
– August) and it extends to fours during post monsoon (Sep-
tember- October). Prolonged fumigation periods ranging from
3 hours to more than 8 hours (with an average of about) 6
hours is seen during winter months (November to January).
Since the ground level concentrations of pollutants increases
during fumigation, the information about the seasonal varia-
tions of fumigation may be used to apply seasonal control
measures for traffic transit planning and industrial operational
hours. In pursuit of the same it is further important to know
the end time of fumigation or the onset time of thermally driv-
en free convection for planning strategies of emissions. A
study in this context (Fig.10) reveals that for most of the time (about 70%) during the year fumigation is complete by 1000 hours. However, under typical cold /fog conditions, it may get prolonged till afternoon hours.
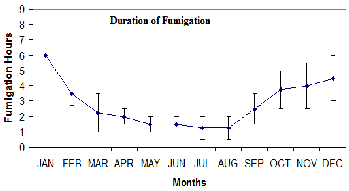
Fig.9 Residence period of fumigation over Delhi (2001-20010)
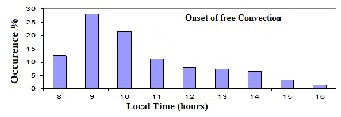
Fig.10 Onset time of free convective ABL over Delhi (2001-2010)
5 CONCLUSIONS
Sodar observational based analysis of air pollution meteoro- logical aspects of ventilation over Delhi has been carried out in terms of occurrence characteristics of stable/unstable ABL thermal structures. It is seen that Delhi witness poor atmos- pheric ventilation associated with stable inversion conditions for about 10 hours (1800-0600 hours) and good ventilation as- sociated with convectively driven unstable ABL for about 7 hours (during 1000-1700 hours). Fumigation period varies from couple of hours during summer to more than 6 to 8 hours during winter. However, Fumigation is mostly over by
1000 hours. The minimum averaged inversion level is about
50m while the maximum is seen to about 400m. However, the
averaged inversion height is seen to be 133±27 m. The height
of convectively unstable ABL varies from minimum of 500m
to maximum of more than 1.5 Km. However, the average
height is 1180 ± 323m during the day. The elevated inversions
are seen to occur at heights of about 225m occur during winter
and pre monsoon periods in association with occurrence of
fog, dust storm/ thunder storm, frontal passage etc. The in-
formation is useful for studying carrying capacity of Delhi and
planning environment management strategies.
ACKNOWLEDGMENT
The authors wish to thank the Director National Physical La- boratory, New Delhi for providing infrastructural facilities for carrying out sodar R&D and other needed support for the above work. Thanks are also due to India Meteorology De- partment for giving valuable visibility data. We are also thankful to Dean, University School of Environment Manage- ment, GGSIP University for his keen interest and valuable dis- cussions and advisory support in carrying out this work.
REFERENCES
[1] E. H. Brown and F. F. Hall, Jr., “Advances in atmospheric acoustics”, Rev.
Geophys. Space Phys., vol. 16, (47-110), 1978.
[2] A.Mikhail, Lokoshchenko, “ Long-Term Sodar Observations in Moscow
and a New Approach to Potential Mixing Determination by Radiosonde Da- ta”, Journal of Atmospheric and Oceanic Technology, (1151–1162),2002.
[3] W.D. Neff and R. J. Coulter, “Acoustic remote sensing in Probing the Atmospheric Boundary Layer”, D. H. Lenschow, Ed.Boston, MA, Amer. Meteorol. Soc., pp.201-239,1986.
[4] S. K. Clifford, J. C. Kaimal, R.J. Lataits and R.G. Strauch, ”Ground- based remote profiling in atmospheric studies.”. An overview. Proc. IEEE., 82, No. 3, 313-355, 1994.
[5] B.S Gera.and Neeraj Saxena, 1996: Sodar data—A useful input for disper- sion modeling. Atmospheric Environment, 30(21), 3623-3631.
[6] R. L. Coulter and M. A. Kallistratova,” The role of acoustic sounding in a
high- Technology era.” Meteorology and Atmospheric Physics, 71, 3-13,
1999.
[7] V. D. Assimakopoulos and C. G. Helmis,”Sodar mixing height estimates and air pollution characteristics over a Mediterranean big city. “Environ- mental Technology, Volume 24 Issue 10 pages 1191 – 1199,2003.
[8] S.P. Singal, S.K. Aggarwal, D.R. Pahwa and B.S. Gera,” Stability studies with the help of acoustic sounding.” Atmospheric Environment, 19, (221-
226), 1985.
[9] B.S. Gera and S.P. Singal,” Sodar in air-pollution meteorology”, Atmos- pheric Environment, 24A, 2003-2009, 1990.
IJSER © 2013 http://www.ijser.org