International Journal of Scientific & Engineering Research, Volume 4, Issue 4, April-2013 1483
ISSN 2229-5518
Signal Processing as a Probe to Study Dielectric Properties of Mouth
Cancer Patient’s Saliva
Dr. Uddhav Ram Lahane Prof. S. R. Ganorkar * Prashant U. Lahane *
----------------------------------------------------------------------------------------------------------------------------
ABSTRACT
Dielectric relaxation study of saliva of mouth cancer patient, normal person and tobacco, gutaka-chewing person has been carried out at sampling frequency 12.4 GHz and at temperature 370C. Time domain reflectometry (TDR) in reflection mode has been used as a technique. In TDR a fast rising step pulse of 25 ps is incident on the saliva kept in the cell. The reflected pulse from the cell is sampled with incident pulse in sampling oscilloscope. The sampled pulses are digitized. The time dependent data were processed to obtain complex reflection coefficient spectra *() using Fourier transformation. The static dielectric constant (0) and dielectric relaxation time () of “ saliva” were evaluated from complex reflection spectra. KEYWORDS
Cancer, Saliva, Time domain reflectometry, Dielectric constant, Relaxation time, Fourier transformation,
least- squares fit method.
1. INTRODUCTION
The microwave energy is nonionizing. It does
not alter the molecular structure of the sample. It provides only thermal activation. In the study of microwave dielectric relaxation, 1,2,3 the static dielectric constant (0) and relaxation time () for saliva of mouth cancer patient and normal person at 12.4 GHz sampling frequency and at 370C temperature using time domain spectroscopy4 are reported. The dielectric parameter provides information about saliva of mouth cancer patient and normal person.
2. MATERIALS AND METHODS
The saliva of normal persons and mouth cancer
patients were obtained from government medical college, Aurangabad. Ethanol AR grade (Changshu Yangyuan Chemical, China) and Acetone AR grade (Qualigens Fine Chemicals, Mumbai) 99.9% purity were obtained commercially and used without further purification. The complex permittivity spectra were studied using time domain reflectometry.

Department of Electronic Science
Shri Chhatrapati Shivaji College Shrigonda 413701
Dist. Ahmednagar (MS), India urlahane@yahoo.co.in
The Hewlett Packard HP 54750A-sampling oscilloscope with an HP 54754A TDR plug-in module was used. A fast rising step voltage pulse of about 25 ps rise time generated by a tunnel diode was propagated through a flexible coaxial cable. The saliva was placed at end of the coaxial line in the standard military application (SMA) coaxial cell of 3.5 mm outer diameter and 1.35 mm effective pin length.
All measurements were done under open load conditions. The change in pulse on reflection from the sample placed in cell was monitored by the sampling oscilloscope. The reflected pulse without sample R1(t) and with sample Rx(t) were digitized in 1024 points and stored on disc.
The temperature controller system with a water bath and a thermostat has been used to maintain
the constant temperature within the accuracy
limit of 10C. The sample cell was surrounded by an insulating container through which, the
constant temperature water was circulated.
3. DATA ANALYSIS
The time dependent data were processed to obtain complex reflection coefficient spectra
*() using Fourier transformation (Samulon4 ; Shannon5) as
* Department of Electronics and Telecommunication
Engineering
* ( )
c p( )

jd q( )
Sinhgad College of Engineering and Research, Pune, India
prashlahane@gmail.com
Where p() and q() are Fourier transforms of (R1(t)-Rx(t)) and (R1(t)+Rx(t)), respectively, c is the velocity of light, is the angular frequency, and d is the effective pin length.
IJSER © 2013 http://www.ijser.org
International Journal of Scientific & Engineering Research, Volume 4, Issue 4, April-2013 1484
ISSN 2229-5518
The complex permittivity spectra *() were obtained from reflection coefficient spectra *() by using the bilinear calibration method (Cole et al.6). Ethanol and Acetone were used as calibrating liquids.
The *() spectra for saliva’s are shown in figure.
4. FINDINGS
The static dielectric constant and relaxation time of saliva obtained at 370C by the least- squares fit method are listed in table1.
Table 1: Dielectric relaxation parameters for saliva.
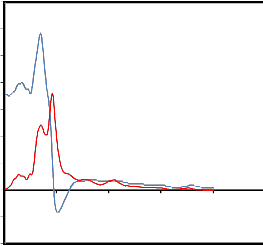
140
120
100
80
60
40
*(w) spectra for normal person's saliva
'
"
20
0
-20
-40
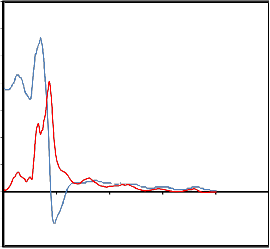
140
0 5 10 15 20
f GHz
120
100
'
80
60
* (w) spectra for cancer patient's saliva
40
20
0
-20
"
0 5 10 15 20 2
f GHz
-40
The experimental values of *() are
fitted with the Debye equation (Havriliak and
Negami7; Cole and Cole8; Davidson and Cole9)

* 0
1 j
with o, and as fitting parameters. A nonlinear least- squares fit method (Bevington10) was used to determine the values of dielectric
parameters.
u Numbers in brackets indicate uncertainty. e.g.,
81.68(66) means 81.68 0.66.

IJSER © 2013 http://www.ijser.org
International Journal of Scientific & Engineering Research, Volume 4, Issue 4, April-2013 1485
ISSN 2229-5518
5. RESULTS AND CONCLUSION
An attempt is made to determine dielectric
parameters of mouth cancer patient’s saliva at
370C using Ethanol and Acetone as calibrating
liquids. The values of dielectric constant o and relaxation time for cancer patient’s saliva are greater than normal person’s saliva. This raise in dielectric constant o is due to increase in effective dipole moment per unit volume of molecules in saliva. Relaxation time of biological material can be related to the size of molecule, mobility of molecules, molecular volume, viscosity, and temperature. Increase in relaxation time can be correlated to increase in size of molecule as well as to decrease in mobility of molecules. The saliva of mouth cancer patient becomes sticky, so its viscosity increases.
REFERENCES
1. Grant E.H., Dielectric Behavior of
Biological Molecules in Solutions.
Clarendon Press Oxford (1978).
2. Froblich H., Theory of Dielectrics. Oxford
University Press London (1949).
3. Debye P., Polar Molecules. The Chemical
Catalog Co., New York (1929).
4. Samulon H.A. Spectrum analysis of transient response curves, Proc. IRE 1951,39,175-
186.
5. Shannon C.E., Communication in the presence of noise, Proc. IRE 1949,37,10.
6. Cole R.H.; Berbarian J.G.; Mashimo S.; Chryssikos G.; Burns A.; Tombari E. Time domain reflection methods for dielectric measurements to 10 GHz, J. Appl. Phys.
1989,66,793-802.
7. Havriliak S. & Negami S. A complete plane analysis of -dispersion in some polymer systems J. Polym. Sci. Polym. Symp.
1966,99-117.
8. Cole K.S. & Cole R.H. Dispersion and absorption in dielectrics, J.Chem. Phys.
1941,9,341-345.
9. Davidson D.W.; Cole R.H. Dielectric
relaxation in Glycerin, J. Chem. Phys.
1950,18,1417.
10. Bevington P. R., Data reduction and error analysis for the physical sciences; McGraw Hill: New York, 1969.
IJSER © 2013 http://www.ijser.org