International Journal of Scientific & Engineering Research, Volume 6, Issue 1, January-2015 546
ISSN 2229-5518
Shear Wall Analysis and Design Optimization In Case of High Rise Buildings Using Etabs (software)
M.Pavani, G.Nagesh Kumar, Dr. Sandeep Pingale
—————————— ——————————
IJSER © 2015 http://www.ijser.org
International Journal of Scientific & Engineering Research, Volume 6, Issue 1, January-2015 547
ISSN 2229-5518
HE design of tall buildings essentially involves a conceptual design, approximate analysis, preliminary design and optimization, to safely carry
gravity and lateral loads. The primary purpose of all kinds
of structural systems used in the building type of structures is to transfer gravity loads effectively. The most common loads resulting from the effect of gravity are dead load, live load and snow load. Besides these vertical loads, buildings are also subjected to lateral loads caused by wind, earthquake forces. Lateral loads can develop high stresses, produce sway movement or cause vibration. Therefore, it is very important for the structure to have sufficient strength against vertical loads together with adequate stiffness to resist lateral forces.
The static and dynamic structural responses of high rise buildings are governed by the distributions of transverse shear stiffness and bending stiffness per each storey. “Making changes to the systems inside the building or even the structure itself at some point after its initial construction and occupation.
The impact of wind and seismic forces acting on High rise buildings becomes an important aspect of the design. Improving the structural system of tall buildings can control their dynamic response with more appropriate structural elements such as shear walls and tube structures, and by improving material properties; the maximum height of concrete buildings has soared in recent decades. Under the large overturning effects caused by horizontal Earthquake forces, edges of shear walls experience high compressive and tensile stresses. To ensure that shear walls behave in a ductile way, concrete in the wall end regions must be reinforced in special manner to sustain these load reversals without losing strength. End regions of wall with increased confinement are called boundary elements. This special confining transverse reinforcement in the boundary elements is similar to that provided in columns of reinforced concrete frames. Sometimes, the thickness of the shear wall in these boundary elements is also increased.
Columns are compression elements where as shear wall is compression as well as shear resisting elements. A shear wall is a vertical structural element that resists lateral forces in the plane of the wall through shear and bending. Shear walls are usually provided along both length and width of buildings. Shear walls are like vertically-oriented wide beams that carry earthquake loads downwards to the foundation. Their thickness can be as low as 150mm, or as high as 400mm in high rise buildings (depends on structure). If the ratio of length to the breath is less than 4 then it is considered as shear wall. Columns are line loaded elements and shear wall is area loaded elements.
Center of mass and center of stiffness study shall be made in this report to get the minimum eccentricity. Try to avoid the torsional irregularity in the building by positioning the shear wall in such a way that center of stiffness and center of mass lies in one line parallel(or) perpendicular to the force acting on it.
In this study R.C.C. building is modelled, analyzed and designed. Design of shear wall by itself is a study of demand Vs capacity ratio adhered to the properties of shear wall sections. This can be generated by the mathematical model created in Etabs by considering the earthquake and wind forces. There is various ways to find out the capacity of a section mainly stated as below
1. Object based model
2. Idealization for shear design and boundary line checks
3. Idealization for flexural design(or) check
The stability of the building is evaluated by checking of Storey Drifts, Lateral Displacements, Lateral Forces, Storey Stiffness, Base shear, Time period, Torsion.
The most commonly used methods of analysis are based on the approximation that the effects of yielding can be accounted for by linear analysis of the building, using the design spectrum for inelastic system. Forces and displacements due to each horizontal component of ground motion are separately determined by analysis of an idealized building having one lateral degree of freedom per
floor in the direction of the ground motion component
IJSER © 2015 http://www.ijser.org
International Journal of Scientific & Engineering Research, Volume 6, Issue 1, January-2015 548
ISSN 2229-5518
being considered. Such analysis may be carried out by the seismic coefficient method (static method) or response spectrum analysis procedure (dynamic method).
According to the Indian code in the response spectrum
method, the response of a structure during an earthquake is obtained directly from the earthquake response (or design) spectrum. This procedure gives an approximate peak response, but this is quite accurate for structural design applications. In this approach, the multiple modes of response of a building to an earthquake are taken into account. For each mode, a response is read from the design spectrum, based on the modal frequency and the modal mass. The responses of different modes are combined to provide an estimate of total response of the structure using modal combination methods such as complete quadratic combination (CQC), square root of sum of squares (SRSS), or absolute sum (ABS) method. Response spectrum method of analysis should be performed using the design spectrum specified or by a site – specific design spectrum, which is specifically prepared for a structure at a particular project site. The same may be used for the design at the discretion of the project authorities
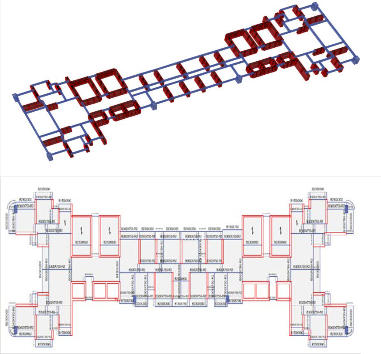
A hypothetical building is assumed for seismic analysis that consists of a G+44+terrace R.C.C. residential cum commercial building. The plan of the building is irregular in nature but considered as it is regular for easy analysis. The building is located in Seismic Zone III and is founded on medium type soil. The building is 158.92 m (162.58 along with others) in height 73.95m in length and 23.8m in width. The important details of the structure is as follows
Tie and Stilt level framing view![]()
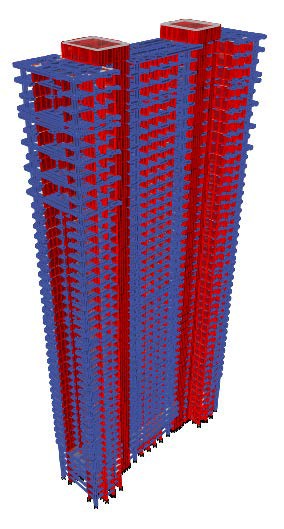
The E-TABS software is used to develop 3D space frame model and to carry out the analysis. Dynamic analysis of the building models is performed on ETABS. The lateral loads generated by ETABS correspond to the seismic zone III and the 5% damped response spectrum given in IS:
1893-2002.
IJSER © 2015 http://www.ijser.org
International Journal of Scientific & Engineering Research, Volume 6, Issue 1, January-2015 549
ISSN 2229-5518
IS875:1987 | |||
WPLXG | Wind | 0 | User Loads |
WPLYG | Wind | 0 | User Loads |
Fz = Ct* Ae* Pz* G
Where
Fz = along wind load on the structure at any height z corresponding to strip area
Ct = force coefficient for the building,
A e = effective frontal area considered for the structure at height c,
Pz = design pressure at height z due to hourly mean wind
obtained as 0.6 v2 (N/ma), G = Gust factor given as,
![]()
G = 1+gf .r �𝑩(𝟏 + 𝜱)𝟐 +
![]()
𝑺𝑬
𝜷
Figure -2: 3D view of Model in ETabs
Table 2: loads taken according to the codes in ETABS
(All fig and tables are taken as per IS specifications)
Where
gf* r = peak factor defined as the ratio of the expected peak value to the root mean
Value of a fluctuating load, and
r = roughness factor which is dependent on the size of the structure in relation to the ground roughness. The value of (‘g f* r’ is given in Fig. 8,)
B = background factor indicating a measure of slowly varying component of Fluctuating wind load and is obtained from Fig.9,![]()
SE
= measure of the resonant component of the fluctuating
β
wind load
S = size reduction factor (see fig 10 for S)
E = measure of available energy in the wind stream at the natural frequency of the structure (see Fig. 11),
IJSER © 2015 http://www.ijser.org
International Journal of Scientific & Engineering Research, Volume 6, Issue 1, January-2015 550
ISSN 2229-5518
β = damping coefficient (as a fraction of critical damping) of
the structure (see Table 34), and![]()
gtr √B
Terrain & Height Factor
(K2 )![]()
Φ = and is to be accounted only for buildings less
4
than 75 m high in terrain Category 4 and for buildings .less
than 25 m high in terrain Category 3, and is to be taken as zero in all other cases.
Providing the wind loading details as per IS875:1987
a) Category of building =3 b) Class of building =C
c) Basic wind speed in m/sec =44m/se
Windward Coefficient, Cp,wind = 0.8
Leeward Coefficient, Cp,lee = 0.5
Risk Coefficient, k1 = 1
Topography Factor, k3 = 1
Design Wind Speed, Vz = Vb k1k2 k3
= 44X1X1.15X1
Vz = 50.865584
Design Wind Pressure, P = 0.6 X V2 XCF
= 0.6 (50.6) 2 X1.4
=2150.70N/m2
= 2.15 KN/m2
WIND DATA BASIC WIND SPEED
Terrain Category
Terrain Class
Topographic Factor
Design Wind Pressure
(Vz ):
Pz =
F= Cf x Ae x pd x G
a= 73.95 b= 22.8 h= 119.3 a/b= 3.24 h/b= 5.23
Figure-3: force coefficient as in IS 875 (part3)
Along X Axis:
Considering Higher Shape factor for irregular shape
Along Y Axis:
Risk Coefficient (K1 )
IJSER © 2015 http://www.ijser.org
International Journal of Scientific & Engineering Research, Volume 6, Issue 1, January-2015 551
ISSN 2229-5518
Considering Higher Shape factor for irregular shape
Gust factor calculation
Fundamental natural period of building To = 4.92
T90 = 4.92
C y = 10; C z = 12 are constants from IS: 875 (part 3)
For terrain category -3
g t r=1.1 L(h) =1700![]()
C z.h
L(h)
For T0 &T90![]()
C y.b
λ=
C z.h
= 0.16 and in y-direction 0.52![]()
𝐿(ℎ)
f0
𝑉ℎ
=5.77 on both directions
F0 =![]()
C z.f0.h
𝑉ℎ
=4.86 and in y-direction 4.86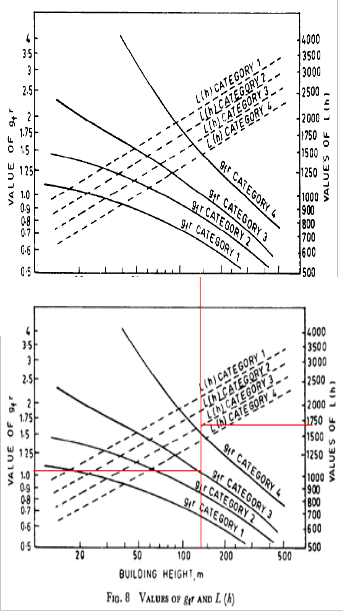
ER © 2015 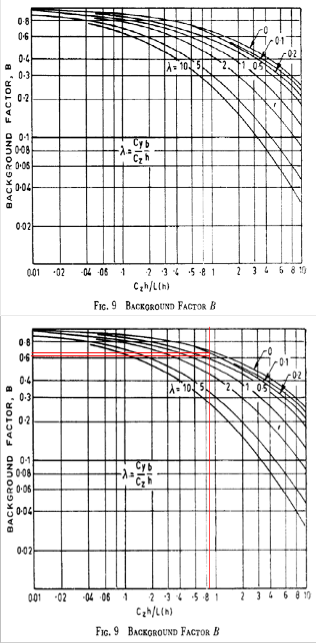
International Journal of Scientific & Engineering Research, Volume 6, Issue 1, January-2015 552
ISSN 2229-5518
From graph B = 0.65 & 0.61 in both the directions
Φ=0
Nature of structures (1) | Damping coefficient ,β (2) |
Welded steel structures | 0.010 |
Bolted steel structures | 0.020 |
RC structures | 0.016 |
E =0.17
β=0.016![]()
![]()
𝑺𝑬
𝜷
S =0.32 & 0.28
G = 3.21 & 3.08 is gust calculated at a distance z in
both directions
Providing the EQ loading details
a) | Zone factor | =0.16 |
b) | Importance factor | =1 |
c) | Response reduction factor shear wall code IS 1893:2002) | =4 (for ductile |
d) | Soil type | = type II (medium) |
e) | %LL considered in seismic | = 25% |
Time period in horizontal X-direction
T x =![]()
0.09ℎ
√𝑑
IJSER © 2015 http://www.ijser.org
= 0.09 x 158.92
√73.95
International Journal of Scientific & Engineering Research, Volume 6, Issue 1, January-2015 553
ISSN 2229-5518
= 1.7
Similarly Ty = 3.09
Seismic weight W = 945198 (from Etabs)
It is the displacement of one level relative of the other level above or below. The storey drift in any storey shall not
exceed 0.004 times the height of storey height
Seismic coefficient, Ah =![]()
𝒁 𝑰 𝑺𝒂 𝑾
𝟐 𝑹 𝒈
Height of Storey = 3660mm
Table 4: static base shear values
Directio n | Period Used (sec) | W (kN) | Vb (kN) |
X | 1.7 | 945198 | 15123 |
Y | 3.09 | 945198 | 8320 |
Story | Load case/combo | Location | VX KN | VY KN |
TIE | SPECX Max | Top | 15855 | 4119 |
TIE | SPECX Max | Bottom | 15855 | 4119 |
TIE | SPECY Max | Top | 1915 | 8765 |
TIE | SPECY Max | Bottom | 1915 | 8765 |
Case | Item Type | Item | Static % | Dynamic % |
Modal | Acceleration | UX | 100 | 98.01 |
Modal | Acceleration | UY | 100 | 97.93 |
Modal | Acceleration | UZ | 0 | 0 |
From the above table we can say as
Static base shear ≈ Dynamic base shear
0.004(h) = 0.004(3660) = 14.64mm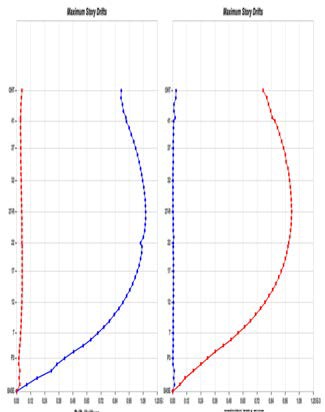
Hence after analyzing the Building the results obtained for entire structure in both longitudinal and transverse directions are presented in tabular form.
IJSER © 2015 http://www.ijser.org
International Journal of Scientific & Engineering Research, Volume 6, Issue 1, January-2015 554
ISSN 2229-5518
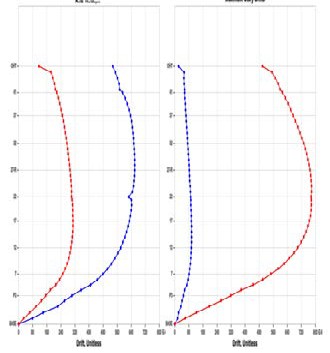
Figure -8: Storey Drift of Building in Longitudinal and transverse direction for static and dynamic cases

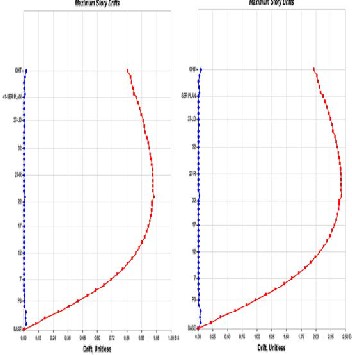
Figure-9: Storey drift for wind load with and without gust factor in logitudinal direction
Figure-10: Storey drift for wind load with and without gust factor in logitudinal direction

(ALL GRAPHS OBTAINED FROM SOFTWARE) Table 7: max. Storey Drift from static load case
IJSER © 2015 http://www.ijser.org
International Journal of Scientific & Engineering Research, Volume 6, Issue 1, January-2015 555
ISSN 2229-5518
Load case/combinations | ||||||||
Stor y | SPECX | SPECY | ||||||
X | Y | X | Y | |||||
OH T | 0.00053 | 0.00053 | 0.000535 | 0.0005 | ||||
TER | 0.00055 | 0.00055 | 0.00055 | 0.0005 | ||||
44 | 0.000562 | 0.00056 | 0.000562 | 0.000562 | ||||
43 | 0.000571 | 0.0002 | 5.30E-05 | 0.000588 | ||||
42 | 0.000574 | 0.00021 | 5.30E-05 | 0.000599 | ||||
41 | 0.000591 | 0.00022 | 5.60E-05 | 0.000613 | ||||
40 | 0.000606 | 0.00023 | 5.70E-05 | 0.000629 | ||||
39 | 0.000617 | 0.00023 | 5.90E-05 | 0.000645 | ||||
38 | 0.000627 | 0.00024 | 6.10E-05 | 0.00066 | ||||
37 | 0.000636 | 0.00025 | 6.30E-05 | 0.000673 | ||||
36 | 0.000642 | 0.00026 | 6.50E-05 | 0.000687 | ||||
35 | 0.000647 | 0.00026 | 6.70E-05 | 0.0007 | ||||
34 | 0.00065 | 0.00027 | 7.00E-05 | 0.000713 | ||||
33 | 0.000653 | 0.00027 | 7.10E-05 | 0.000723 | ||||
32 | 0.000655 | 0.00028 | 7.30E-05 | 0.000733 | ||||
31 | 0.000657 | 0.00028 | 7.50E-05 | 0.000743 | ||||
30 | 0.000658 | 0.00028 | 7.70E-05 | 0.000751 | ||||
29 | 0.000659 | 0.00029 | 7.90E-05 | 0.000758 | ||||
28 | 0.00066 | 0.00029 | 8.00E-05 | 0.000764 | ||||
27-R | 0.000659 | 0.00029 | 8.20E-05 | 0.00077 | ||||
26 | 0.000658 | 0.0003 | 8.40E-05 | 0.000774 | ||||
25 | 0.000656 | 0.0003 | 8.50E-05 | 0.000777 | ||||
24 | 0.000653 | 0.0003 | 8.70E-05 | 0.000778 | ||||
23 | 0.000626 | 0.0003 | 9.00E-05 | 0.000776 | ||||
22 | 0.000626 | 0.0003 | 9.00E-05 | 0.000776 | ||||
21- SER | 0.000641 | 0.0003 | 9.10E-05 | 0.000778 | ||||
20 | 0.000643 | 0.00031 | 9.20E-05 | 0.000778 | ||||
19 | 0.00064 | 0.00031 | 9.30E-05 | 0.000776 | ||||
18 | 0.000635 | 0.00031 | 9.30E-05 | 0.000772 | ||||
17 | 0.00063 | 0.00031 | 9.40E-05 | 0.000766 | ||||
16 | 0.000622 | 0.00031 | 9.50E-05 | 0.000758 | ||||
15 | 0.000614 | 0.00031 | 9.50E-05 | 0.000747 | ||||
14 | 0.000604 | 0.00031 | 9.50E-05 | 0.000734 | ||||
13R | 0.000593 | 0.0003 | 9.50E-05 | 0.000719 |
IJSER © 2015 http://www.ijser.org
International Journal of Scientific & Engineering Research, Volume 6, Issue 1, January-2015 556
ISSN 2229-5518
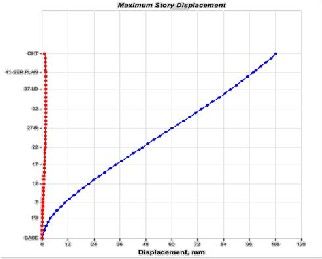
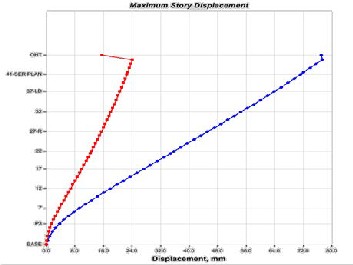
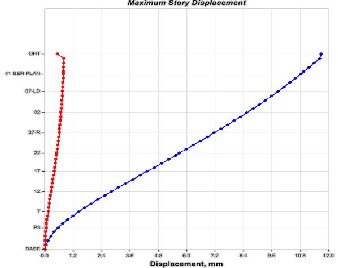
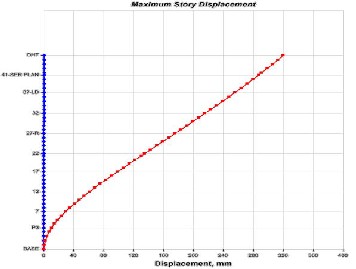
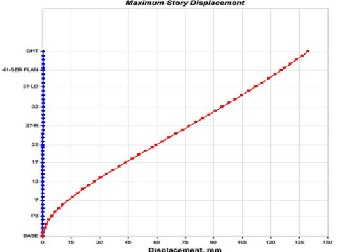
It is displacement caused by the Lateral Force on the each storey level of structure. Lateral displacement will be more on top storey. Hence after analyzing the Building the results obtained for model in both longitudinal and transverse direction and there comparison is presented in tabular form.
CHECK FOR ALLOWABLE DEFLECTION
Max. Deflection against wind allowed is given as![]()
𝐻
500
![]()
162.58
=
500
=0.325=325 mm
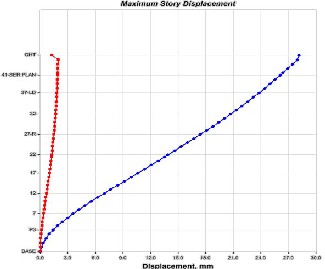
From the graph it is less than 325 hence it is ok
Similarly Max. Deflection against earthquake allowed is
𝐻 162.58
Given as![]()
![]()
=
250
250
=0.650=650mm
From the graph it is ok. Hence it is safe
IJSER © 2015 http://www.ijser.org
International Journal of Scientific & Engineering Research, Volume 6, Issue 1, January-2015 557
ISSN 2229-5518
OHT TER
44
43
42
41
40
39
38
37
36
35
34
33
32
31
30
29
28
IJSER © 2015 http://www.ijser.org
International Journal of Scientific & Engineering Research, Volume 6, Issue 1, January-2015 558
ISSN 2229-5518
5 | 8 | 5.7 | 5.9 | 6.1 | 33.9 | 567.3 |
4 | 6.1 | 4.2 | 4.6 | 4.6 | 30.6 | 512.5 |
P3 | 4.4 | 3 | 3.4 | 3.4 | 27 | 451 |
P2 | 3.1 | 2 | 2.4 | 2.3 | 26 | 434.8 |
P1 | 1.9 | 1.2 | 1.5 | 1.4 | 29.2 | 489.2 |
STILT | 0 | 0 | 0 | 0 | 0 | 0 |
TIE | 0 | 0 | 0 | 0 | 0 | 0 |
BASE | 0 | 0 | 0 | 0 | 0 | 0 |
1. Storey drift of building is within the limit as clause no
7.11.1 of IS-1893 (Part-1):2002.
2. Storey Stiffness of the building is within the limit as clause no 4.20 of IS-1893 (Part-1):2002.
3. In this paper due to the presence of shear wall at all possible deflection positions there is possible of controlling the damage that may occur due to wind and earthquake forces.
1. Shahzad jamil sardar and umesh.N.karadi―effects of change in shear wall location on storey drift of 20 stored multi storey building subjected to lateral loads (IJIRSET-2013).
2. Abiffazl shamsai, loghman rahemi, kamal rahemi,saber peroti ― arangement of shear walls in control of lateral displacement of 16 and 32 storey concrete frames (WASJ-2012).
3. Anshuman.s,dipendu bhunia, bhavin ramjiyani― solution of shear wall location in multi-storey building (IJCSE-2011).
IJSER © 2015 http://www.ijser.org
International Journal of Scientific & Engineering Research, Volume 6, Issue 1, January-2015 559
ISSN 2229-5518
4. Rajesh jayarambhai prajapati & vinubhai.r.patel― effect of different position of shear wall on deflection in high rise building (IJAET-2013)
5. Kevadkar and Kodag―Lateral Load Analysis of R.C.C.
Building . International Journal of Modern Engineering Research (IJMER) www.ijmer.com Vol.3, Issue.3, May- June. 2013
6. S.s.patil,c.g.konapure,s.a.ghadge― equivalent static analysis of high rise building with different lateral load resisting systems (IJERT-2013).
7. O.esmaili s.epackachi m.samadzad and s.r.mirdhaderi― study of RC shear wall system in a 56- storey tall building (14WCEE-2008).
8. Dr. Sudhir K Jain ― Explanatory Examples on Indian Seismic Code IS 1893 (Part I) Department of Civil Engineering Indian Institute of Technology Kanpur.
9. Agarwal P. and M Shrikhande (2007), “Earthquake Resistant Design of Structures”, PrenticeHall of India Pvt. Ltd., 2007, New Delhi.
10. IS 1893 (Part 1)- 2002, “Criteria For Earthquake Resistant Design Of Structures”s - Part 1General Provisions And Buildings”, 5th Revision, 2002, BUREAU OF INDIAN STANDARDS ,New Delhi, INDIA

• M.Pavani holds a B. Tech degree (Civil Engineering) JNTU A, Anantapur, India. she is currently Pursuing her PG degree in structural Engineering under the guidance of G. Nagesh Kumar Andhra Pradesh, India. Her present area of research interest
is in structural design
pursuing his research under the guidance of Dr. CH. Sudharani at SVU, Tirupati , Andhra Pradesh, India. Presently, he is working as Sr. Asst. Prof in the CED of G. Pulla Reddy Engineering College (Autonomous) and has
28 years of experience in
teaching. His research interest includes Material Science
• Dr.Sandeep Pingale He has over 14 years of experience of civil & structural engineering. International experience in structural analysis, design, execution & management of up toG+81 storey structure in Dubai. He has worked with various international multidisciplinary organizations that have given him “State of Art” in providing the services with international quality standards. He has worked in
the area of structural
engineering by using different international codes with ACI-
318, ASCE-7, IBC-2006, UBC-
97, CEB-FIP Euro code, and
BS8110
• G. Nagesh Kumar He has received his M. Tech degree (Structural Engineering) from JNTU, Anantapur, Andhra Pradesh, India. He is currently
IJSER © 2015 http://www.ijser.org