Inte rnatio nal Jo urnal o f Sc ie ntific & Eng inee ring Re se arc h, Vo lume 3, Issue 1, January -2012 1
ISS N 2229-5518
Selection Of Mixed Sampling Plan With CSP-1 (C=2) Plan As Attribute Plan Indexed Through MAPD AND MAAOQ
R. Sampath Kumar, S. Sumithra and R. Radhakrishnan
—————————— ——————————
A variety of plans and pr ocedur es have been developed for special sampling situation involving both measur ements and attr ibutes. Each is tailor ed to do a specific j ob under pr escribed circumstances. They range fr om a simplified variables appr oach to a mor e technically complicated combination of var iables and attr ibute sampling called mixed sampling plans.
Mixed sampling plans ar e of two types,
namely independent and dependent plans. Independent mixed plans do not incor por ate first sample r esults in the assessment of the second sample. Dependent mixed plans combine the r esults of the fir st and second samples in making a decision if a second sample is necessary.
Mixed Sampling Plan (MSP) w as fir st developed by Schilling (1967) for the case of single sided specifications, standard deviation known by assuming an under lying normal distr ibution for measur ements. Dodge (1943) pr ovided the concept of continuous sampling inspection and intr oduced the fir st continuous sampling plan. Dodge (1947) outlined several sampling plans for continuous pr oduction, or iginally r eferr ed to as the random
– or der and later designated as CSP-1 plan by Dodge and
Torr ey (1951). The desirability of developing a set of sampling plans indexed with p* has been explained by ,
Soundararaj an (1975), Kandasamy (1993) studied in designing of various types of continuous sampling plans. Sur esh and Ramkumar (1996)discussed about the use of MAAOQ for the selection of sampling plans. Radhakr ishnan (2002) constr ucted var ious continuous sampling plans indexed thr ough MAAOQ and mentioned its advantage over AOQL. Devaar ul (2003), Sampath Kumar (2007), Radhakr ishnan and Sampath Kumar (2006,
2007, 2009), Radhakr ishnan et.al (2010) have made
contr ibutions to mixed sampling plans for independent
case. Radhakr ishnan et.al and (2009) studied mixed sampling plan for dependent case.
In this paper , using the operating pr ocedur e of mixed sampling plan (independent case) with CSP-1 (c=2) as attr ibute plan, tables ar e constr ucted for the mixed sampling plan indexed thr ough MAPD and MAAOQ. Suitable suggestions ar e also pr ovided for the futur e.
The symbols used in this paper ar e as follows
P : submitted quality of lot or process
p* : ma ximum a llowa ble pe rce nt de fective (MAPD)
j : proba bility of acce pta nce for lot qua lity ‘pj’
j : proba bility of a cce pta nce ass igne d to firs t s ta ge for
pe rce nt de fective ‘pj’
j : proba bility of a cce pta nce ass igne d to second s ta ge
for pe rce nt de fective ‘pj’
k : va riable factor s uch tha t a lot is a cce pte d
![]()
if X A L k
f : the ra te of ins pe ction(=1/n)
i : number of consecutive units a re found conforming
n1 : sa mple s ize for the va ria ble sa mpling pla n
n2 : sa mple s ize for the a ttribute sa mpling pla n = (1/f)
units
The development of mixed sampling plans and the subsequent discussions ar e limited only to the lower specification limit ‘L’. By symmetry a parallel discussion can be used for upper specification limits also It is suggested that the mixed sampling plan with CSP–1(c=2) in the case of single sided specification (L), standar d deviation (σ) know n can b e for mulated by the parameters i, n 1 , n2 and k.
IJSER © 2012
Inte rnatio nal Jo urnal o f Sc ie ntific & Eng inee ring Re se arc h, Vo lume 3, Issue 1, January -2012 2
ISS N 2229-5518
*. Assist ant P rofessor, Department of St at ist ics, Government Art s College, Coimbatore -18.
**. Assist ant Professor, Department of St at ist ics, Dr.N.G.P Art s and Science College, Coimbat ore - 48.
***. Associat e Professor, Department of Stat ist ics, P SG College of Art s and Science, Coimbatore - 14.
Mixed sampling pr ocedur e suggested by Schilling (1967) is slightly modified and pr esented in this paper and this pr ocedur e is to be adopted separ ately for each time period fixed by the manufactur er . By giving the values for the parameters an independent plan for single sided specification, σ known would be carr ied out as follows:
Determine the parameters with r efer ence to ASN and
OC cur ves
Take a random sample of size n1 fr om the lot assumed to be lar ge during the time per iod‘t’ (may be an hour / a shift / a day / a w eek …). [This is the modification suggested in this paper over Schilling (1967)]![]()
If a sample aver age X A L k , accept the lot
![]()
If the sample average X A L k , apply the operating pr ocedur e of CSP-1 (c=2)
![]()
Step 1: At the outset, inspect 100% of the units
point (p*) is obtained by using d2 Pa (p)/dp2 = 0 and d3 Pa (p)/dp3 ≠ 0.
Maximum allowable average outgoing quality (MAAOQ) of a sampling plan is designated as the Average Outgoing Quality(AOQ) at the MAPD. AOQ = p. Pa (p). and MAAOQ = AOQ at p = p*. Schilling (1967) has given the pr ocedur e for constr ucting the mixed sampling plan w hen a point on OC curve and n1 ar e known w ith CSP-1(c=2) as attribute plan for a specific (p*, β*), n1 , n2 and i
Assume that the mixed sampling plan is independent
Split the pr obability of acceptance ( j ) determining
the pr obability of acceptance that w ill be assigned to the first stage. Let it be j
Decide the sample size n1 (for var iable sampling plan)
to be used
Calculate the acceptance limit for the variable sampling
,
consecutively in the order of pr oduction until i
plan as A L k
L [z( p j ) {z( j ) /
n1 }]
successive conforming units ar e found.
Step 2: W hen i units in succession ar e found
Wher e z(t) is the standar d normal var iate
conforming discontinue 100% inspection and inspect f (=1/n) units until total of (c+ 1) sampled
corr esponding to ‘t’ such that
t
z (t )
![]()
1 eu2 /2 du
2
units ar e found nonconforming.
Step 3: When the number of nonconforming sampled units r eaches (c+1), r evert to 100% inspection as in step 1.
Step 4: Corr ect or r eplace all nonconforming units found with conforming units.![]()
Determine the sample aver age X . If a sample![]()
average X A L K , take a second stage sample
of size ‘n2 ’ using attr ibute sampling plan.
Now determine j the pr obability of acceptance
assigned to the attr ibutes plan associated with the
Step 5: At the end of the time t switch back to
variable sampling plan for the units pr oduced.
second stage as j
j j
![]()
4. Construction and Selection of Mixed 1 j
Maximum allowable per cent defective (MAPD) is the quality level that corr esponds to the point of inflection of the OC curve. It is the quality level at which the second or der derivative of the OC function Pa (p) with r espect to p is zer o ans the thir d order not equal to zer o. When some specific value for a character istic or gr oup of character istics is designated, the continuous sampling plan will have a tendency to accept pr oduct during periods of sampling if the submitted quality is upto MAPD and if the submitted quality is beyond MAPD, the sampling plan w ill have a tendency to submit the pr oduct for scr eening. The inflection
Determine the values of n2 and i from Pa(p)= j for p
= pj.
Using the above pr ocedur e tables ar e constr ucted
to facilitate easy selection of mixed sampling plan w ith CSP-1(c=2) as attr ibute plan indexed thr ough MAPD and MAAOQ.
According to Stephens (1979), the OC function of the CSP-1(c=2) plan is given by Pa (p) = 3qi/[f+(3-f)qi], wher e p is the fraction of incoming lots that ar e not acceptable and q=1-p and f=1/n. The values of i and n ar e calculated for differ ent possible combinations of MAPD and MAAOQ for β*’ = 0.20 using Visual Basic Pr ogram and pr esented in Table
1.
IJSER © 2012
Inte rnatio nal Jo urnal o f Sc ie ntific & Eng inee ring Re se arc h, Vo lume 3, Issue 1, January -2012 3
ISS N 2229-5518
For the specified values of MAPD and MAAOQ one can find the r atio MAPD / MAAOQ and select the near est value of the ratio MAPD/MAAOQ in Table 1 and corr esponding to the given value of MAPD, the values of i and n2 ar e obtained fr om Table 1.
Given MAPD = 0.0015 and MAAOQ = 0.000599. Compute the ratio MAPD/MAAOQ = 2.5042 and select the
At the end of the time t switch back to var iable sampling plan for the units pr oduced.
The OC cur ve for the plan i = 2393 and n2 = 8 is shown in
Figur e 1: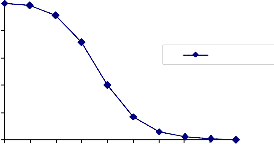
1
0.8
near est value of the ratio fr om the Table 1 as 2.5000. The values of i and n2 corr esponding to the ratio 2.5000 and MAPD = 0.0015 ar e i = 2393, n2 = 8 and f = 1/n2 = 1/8 = 0.125. Thus i = 2393, f = 0.08 ar e the par ameter s selected for the mixed sampling plan having CSP-1(C=2) plan as attribute plan for a specified MAPD = 0.0015 and MAAOQ =
0.000599.
The biscuits ar e expected to contain sugar , carbohydrates, fat, etc., in a specified pr oportion. Inspection of such items means testing one or mor e char acter istics of the pr oduct. Her e mixed sampling plan with CSP-1(c=2) as
0.6
0.4
0.2
0
MSP CSP-…
attribute plan can be used as a basis for acceptance or
r ej ection of such items. The character istic to be inspected is
the ‚Carb ohydrates ‛ of the item for which ther e is a specified low er limit of 78.1g specified by the pr oducer with a known standar d deviation (σ) of 0.2g.
In this example, L = 78.1g, σ = 0.2g and k = 1.5.
A = L + K σ = 78.1 + (1.5)(0.2) = 78.4g.
Now , by applying the var iable inspection first, take a
random sample of size n1 = 10 and find the sample![]()
![]()
average X of the characteristic. If X ≥ 78.4g accept the units otherw ise apply the attr ibute inspection. Under attributes inspection, by taking CSP-1(c=2) as attr ibute plan, for the specified MAPD = 0.0015 (15 non -conformities out of
10000 units) and MAAOQ = 0.000599 (599 non-conformities
out of 10, 00,000 units) the value of i = 2393 and n2 = 8.
Apply 100% inspection to the submitted units and such
inspection is continued until i = 2393 units in
succession ar e found to be acceptable.
When i = 2393 consecutive units ar e found acceptable,
then 100% inspection is discontinued and an inspection at the rate of f = 1/n2 = 1/8 = 0.125 units until total of (c+1) or thr ee sampled units ar e found nonconforming.
Dur ing the skipping inspection, when the number of nonconforming sampled units r eaches (c+1) or thr ee, apply 100% inspection fr om the next unit and inform the management for impr oving the quality of the pr oduct.
6. Conclusion
In this paper a pr ocedur e for the constr uction and selection of independent mixed sampling plan having CSP-
1(c=2) as at tribute plan is pr esented. A table is also
pr ovided for the easy selection of the plans when MAPD
and MAAOQ ar e known. Practical application for the
sampling plan is also discussed. If the floor engineer s know the levels of MAPD and MAAOQ, they can have th eir sampling plans on the floor itself by r eferring to the tables. This pr ovides the flexibility to the floor engineers in deciding their sampling plans. Various plans can also be constr ucted to make the system user fr iendly by changing the first stage pr obabilities (β*’). Similar plans can also be constr ucted for dependent mixed sampling plan suggested by Radhakrishnan et.al (2009).
1. Devaar ul, S. (2003). ‘Certain Studies Relating to Mixed
Sampling Plans and Reliability Based Sampling Plans’,
- PhD thesis - Bhar athiar Univer sity, Tamil Nadu,
India.
2. Dodge, H. F. (1943). A sampling inspection plan for
continuous pr oduction, ‘The Annals of
Mathematical Statistics’, Vol. xiv, No. 3, pp. 264-279.
3. Dodge, H. F. (1947). Sampling plans for continuous pr oduction, ‘Industrial Quality Control’, Vol. 4, No. 3,
pp. 5-9.
4. Dodge, H. F., and Torr ey, M. N. (1951). Additional
continuous sampling inspection plans, ‘ Industrial
Quality Control’, Vol. 7, No. 5, pp. 7-12.
IJSER © 2012
Inte rnatio nal Jo urnal o f Sc ie ntific & Eng inee ring Re se arc h, Vo lume 3, Issue 1, January -2012 4
ISS N 2229-5518
5. Kandasamy , C. (1993). ‘Studies on Designing Certain Continuous Sampling Plans’, - PhD thesis, Department of Statistics, Bharathiar University, Coimbator e, Tamil Nadu, India.
6. Radhakrishnan, R. (2002). ‘Contr ibutions to the Study
on Selection of Certain Acceptance Sampling Plans’, -
PhD thesis - Bharathiar Univer sity, Tamil Nadu, India.
7. Radhakr ishnan, R., and Sampath Kumar , R. (2006).
Construction of mixed sampling plan indexed thr ough MAPD and IQL with single sampling plan as attribute plan, ‘National Journal of Technology ’, Vol. 2, No. 2, pp.
26-29.
8. Radhakr ishnan, R., and Sampath Kumar , R. (2007).
Construction of mixed sampling plans indexed thr ough MAPD and AQL w ith double sampling plan as attribute plan, ‘The International Journal of Statistics and System’, Vol. 2, No. 2, pp. 3-39.
9. Radhakr ishnan, R., and Sampath Kumar , R. (2009).
Construction and comparison of mixed
sampling plans having ChSP - (0,1) plan as attribute
plan, ‘The International Journal of Statistics and
Management System’, Vol. 4, No. 1-2, pp. 134-149.
10. Radhakr ishnan, R., Sampath Kumar , R., and
Saravanan, P.G. (2009). Constr uction of dependent
mixed Sampling plan using single sampling plan as
attribute plan, ‘The International Journal of Statistics and
System’, Vol. 5, no. 1, pp. 69-74.
11. Radhakr ishnan, R., Sampath Kumar , R., and Malathy , M. (2010). Selection of mixed
sampling plan with TNT-(n1 , n2 ; 0) plan as attribute plan indexed thr ough MAPD and MAAOQ,
‘International Journal of Statistics and System’, Vol. 5, No.
4, pp. 477-484.
12. Sampath Kumar , R., (2007). ‘Constr uction and Selection of Mixed Variables – Attr ibutes Sampling Plans’ - PhD Dissertation, Department of Statistics, Bhar athiar Univer sity, Coimbator e, Tamil Nadu, India.
13. Schilling, E.G. (1967). ‚A Gener al Method for
Determining the Operating Characteristics of Mixed Var iables‛ – ‘Attrib utes Sampling Plans single sided specifications, S.D. know n’, PhD Disser tation- Rutgers- The State University, New Brunswick, New Jersy.
14. Soundararaj an, V. (1975). Maximum allowable per cent
defective (MAPD) single sampling inspection by attributes plan, ‘Journal of Quality Technology’, Vol. 7, No. 4, pp. 173-177.
15. Sur esh, K. K., and Ramkumar , T. (1996). Selection of a sampling plan indexed with maximum
allowable aver age outgoing quality, ‘Journal of
Applied Statistics’, Vol. 23, No. 6, pp. 643-642.
Table 1: Various characteristics of Mixed Sampling plan with CSP -1 (C=2) plan as attribu te plan indexed by M AP D and
MAAOQ when β*’= 0.20.
MAPD/ MAAOQ
MAPD i n Percent
0.15 0.25 0.4 0.65 1.0 1.5 2.5 4.0 6.5 10.0
I | n2 | i | n2 | I | n2 | i | n2 | i | n2 | i | n2 | i | n2 | i | n2 | i | n2 | I | n2 | |
2.6490 | 3749 | 56 | 2324 | 67 | 1342 | 43 | 814 | 40 | 542 | 46 | 320 | 25 | 172 | 15 | 97 | 10 | 59 | 10 | 40 | 13 |
2.6316 | 3139 | 23 | 1883 | 23 | 1242 | 30 | 694 | 19 | 427 | 15 | 306 | 21 | 154 | 10 | 96 | 10 | 41 | 3 | 43 | 18 |
2.6059 | 2981 | 18 | 1788 | 18 | 1072 | 15 | 678 | 17 | 414 | 13 | 280 | 14 | 146 | 8 | 93 | 9 | 60 | 11 | 31 | 5 |
2.5806 | 2940 | 17 | 1739 | 16 | 1071 | 15 | 668 | 16 | 405 | 12 | 275 | 13 | 150 | 9 | 90 | 8 | 57 | 9 | 29 | 4 |
2.5641 | 2684 | 12 | 1610 | 12 | 1025 | 13 | 591 | 10 | 393 | 11 | 261 | 11 | 153 | 10 | 83 | 6 | 62 | 13 | 29 | 4 |
2.5477 | 2634 | 11 | 1580 | 11 | 1008 | 12 | 576 | 9 | 374 | 9 | 262 | 11 | 144 | 8 | 83 | 6 | 51 | 6 | 37 | 10 |
2.5157 | 2496 | 9 | 1497 | 9 | 984 | 11 | 557 | 8 | 362 | 8 | 241 | 8 | 144 | 8 | 83 | 6 | 55 | 8 | 36 | 9 |
2.5000 | 2393 | 8 | 1435 | 8 | 925 | 9 | 508 | 6 | 358 | 8 | 238 | 8 | 142 | 8 | 72 | 4 | 34 | 2 | 36 | 9 |
2.4615 | 2393 | 8 | 1324 | 6 | 896 | 8 | 508 | 6 | 330 | 6 | 220 | 6 | 116 | 4 | 77 | 5 | 47 | 5 | 36 | 9 |
2.4539 | 2207 | 6 | 1324 | 6 | 896 | 8 | 508 | 6 | 330 | 6 | 220 | 6 | 116 | 4 | 77 | 5 | 47 | 5 | 26 | 3 |
2.4169 | 2184 | 6 | 1310 | 6 | 888 | 8 | 476 | 5 | 309 | 5 | 192 | 4 | 104 | 3 | 65 | 3 | 47 | 5 | 25 | 3 |
2.4024 | 2064 | 5 | 1238 | 5 | 773 | 5 | 476 | 5 | 309 | 5 | 191 | 4 | 123 | 5 | 65 | 3 | 47 | 5 | 25 | 3 |
2.3952 | 2057 | 5 | 1149 | 4 | 720 | 4 | 441 | 4 | 261 | 3 | 174 | 3 | 123 | 5 | 65 | 3 | 47 | 5 | 25 | 3 |

IJSER © 2012
International Journal of Scientific & Ergineerirg Research, Volume 3, IsstE 1, January-2012 5
ISSN 2229-5518
![]()
1-BER IS)2012
rttp:/lwww.11 ser.crg