International Journal of Scientific & Engineering Research, Volume 5, Issue 4, April-2014 1123
ISSN 2229-5518
Seismic Analysis of Indoor Auditorium
S.Dilipan Bose *, S. Aravindan#
*PG Student M.tech Structural Engineering, Bharath University.
# Assistant Professor, Department of Civil Engineering, Bharath University.
Abstract— The project titled “Seismic analysis of Indoor Auditorium” has been taken up with an objective to determine the seismic response and behaviour of an Auditorium constructed in Chennai area. Even though Chennai is considered as least prone to major earthquake, it is expected that a structure would survive major earthquakes without collapse that might occur unexpectedly during the life of the building. It should also be noted that after the Bhuj earthquake, Indian Standard IS: 1893 was revised and Chennai city was upgraded from zone II to zone III which leads to a substantial increase of the design ground motion parameters. Hence, this project presents an exploratory analysis of the seismic performance of multi-storey buildings system built in the specified area with a comparative study of the structures under past major earthquakes.Computer modeling is undertaken using Ansys is a multi-purpose software which enables to run and simulate tests or working conditions. It also helps in determining and improving weak points, computing by 3D simulations in virtual environment.
Index Terms— Auditorium, Analysis, Ansys, Earthquake, Seismic, Finite Element Analysis, Static Analysis
—————————— ——————————
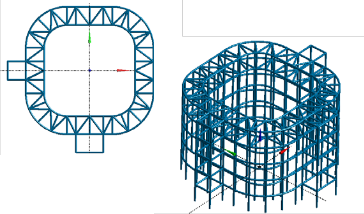
n auditorium is a room built to enable the audience to hear and watch performances at venues such as theatres. Generally, an auditorium has an increasing sloped-styled seating, So as to allow the audience at the back of the auditorium to see the stage without any disturbances. The structural design of an auditorium should be a sloped foundation so as to follow the seating layout. Seismic analysis of an auditorium is done using Ansys and various seismic modes and data are collected. The member with the highest deflection is pointed out and strenghtening methods can be carried out in the next project.
• To create a 3-D finite element model
• Analyse the element using Static structural analysis, Modal analysis and Response spectrum analysis
• Find out the member with maximum displacement due to seismic activity.
3.1 Finite Element Program
The ANSYS program is a computer program for Fi- nite element analysis and design. Also used to find out how a given design works under operating condi- tions. It has its own integrate pre and post processor. Ansys program can be used in all disciplines of engi- neering-structural, mechanical, electrical, electromag- netic, electronic, thermal, and fluid.
3.2 Basic Concepts in FEA
Stress analysis one of the engineering discipline helps in de- termining stress in materials and structures that are subjected to static or dynamic forces.
The aim of this analysis is to determine the collection of el- ements, which is also referred as a structure, can safely with- stand the specified forces. This can be achieved when the de- termined stress from the applied forces are less than the ulti- mate tensile strength and the ultimate compressive strength the material is known to be able to withstand, inspite of that a factor of safety is applied in design.
The factor of safety is one of the important design require- ments for any structure based on uncertainty in loads, materi- al strength (yield and ultimate), and consequences of failure. The factor of safety is to prevent detrimental deformations and the factor of safety on ultimate strength is to prevent collapse. The factor of safety is used to calculate the maximum allowa- ble stress.
Factor of Safety = Ultimate Tensile Strength/Maximum al- lowable stress
When performing stress analysis, a factor of safety is calcu- lated to compare with the required factor of safety. The factor of safety is a design requirement given to the stress analyst. The Analyst calculates the design factor. Margin of safety is another way to express the design factor.
Design Factor = Ultimate Tensile Strength / Maximum Cal- culated Tensile Stress. A key part of analysis involves deter- mining the type of loads acting on a structure, including ten- sion, compression, shear, torsion, bending, or combinations of such loads.
3.3 Problem Definition
The finite element method is a numerical method for solv- ing problems of engineering and mathematical physics. It is useful for problems with complicated geometries, loadings, and material properties where analytical solutions cannot be obtained.
IJSER © 2014 http://www.ijser.org
International Journal of Scientific & Engineering Research, Volume 5, Issue 4, April-2014 1124
ISSN 2229-5518
FEA is a technique that discretizes a given physical or mathematical problem into smaller fundamental parts called elements. An analysis of each element is conducted. A solution to the problem as a whole is obtained by assembling the indi- vidual solutions of the elements. Complex problems can be tackled by dividing the problem into smaller and simpler problems that can be solved using existing mathematical tools.
3.4 Steps in Finite Element Modeling
1. Discretize and Select Element Types
2. Select a Displacement Function
3. Define the Stress/Strain Relationships
4. Derive the Element Stiffness Matrix and Equations
5. Assemble the Element Equations to obtain the Global
Equations
6. Solve for the Unknown Displacements
7. Solve for the Element Strains and Stresses
8. Interpret the Results.
3.5 Finite Element Meshing of Auditorium
Grid generation is the first step of analysis. Grid generation usually requires simplification and idealization of the design model. This requirement is the most cumbersome aspect of grid generation process. Therefore, the analysis model is often rebuilt from scratch, based upon the judgment of skilled ana- lysts in removing details from the design, and duplicating much of the work in creating the geometry. Often, integrated tools are interactive and require the design engineer to pro- vide complex input.
The geometrical question in a finite-element analysis is represented by collection of finite elements used and is known as mesh. Creating the mesh is often the most difficult part of finite element modelling. As a result, the grid genera- tion process is not yet a ‘push button" process; it is the most labor- intensive and time-consuming aspect of the computa- tional structural dynamics. It takes too many man-hours and calendar days, and it requires a grid specialist. Mesh genera- tion could be performed graphically, drawing lines on a com- puter to form elements. Techniques such as extruding a shell mesh to create a solid mesh were developed for creating com- plex geometric models. With use of solid modelling CAD pro- grams, the geometry to be used in finite element analysis al- ready exists in some format. This geometry can be used for simulation, only if the programs being used have the interface capabilities. Once we have creared the geometry in the system, the finite element programs create some type of automatic meshing. In beam elements it is the process of breaking up bigger line entities into smaller line entities. In 2D elements, flat surfaces must be broken into the elements having three or four sides. In shell elements, 3D surfaces must be equally di- vided into the shell elements. In solid elements, a particular volume must be sectioned into elements.Automatic meshing capabilities directs the user place the elements. Most automat- ic mashers create tetrahedral elements in solid volumes. Tet- rahedral elements can be less in accuracy compared to brick
elements. But structural dynamics analysis tetrahedral mesh is sufficient. Structural analysis using Finite Element Method gives a preliminary assessment of dynamic behavior of me- chanical structures in order to establish the guidelines for de- signing the experiment. The main objective of this study was to develop a methodology of seismic analysis of electronic cabinets using ANSYS. Generally has two approaches i.e. tran- sient analysis and response spectrum analysis are adopted for the seismic analysis in ANSYS.
Meshing is used in a Workbench is to provide robust, ease in the use of meshing. These tools are highly automated and it has a moderate to high degree of user control. To carry out a finite element analysis, the model must be divided into a number of small pieces and those pieces are known as finite elements. After the model has been divided into a number of discrete parts, Finite Element Analysis can be described as a discretization technique.
If the system we investigate is one-dimensional in nature, we may have to use line elements to represent our geometry and carry out our analysis. If the system is two-dimensional, then a 2D mesh is required If the system is a complex and 3D representation of the continuum, then we use a 3D mesh.
5.1 Mesh Requirements
The Finite Element Method (FEM) has certain requirements on a mesh:
• The mesh must be valid, (no holes, self-intersections, or faces joined at two or more edges).
• The mesh must conform to the boundary of the do- main. This is an obvious requirement, but some schemes such as a Delaunay triangulation may not satisfy this condition.
• The density of the mesh must be controllable, to allow
trade-off between accuracy and solution time.
• The grid density will vary depending on local accura-
cy requirements, but any variations must be smooth
to reduce or eliminate numerical diffusion/refraction
effects.
• There are some requirements on the shape of ele-
ments. In general, the elements should as equiangular
as possible in equilateral triangles & regular tetrahe-
dral. Highly distorted elements (long, thin triangles, squashed tetrahedral) can lead to numerical stability problems caused by round-off errors. This require- ment is modified for boundary layers, where highly
stretched elements are desired and facilitated in the FEM formulation. The min-max-angle property is still required in this case.
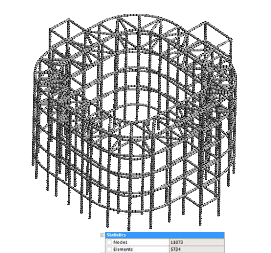
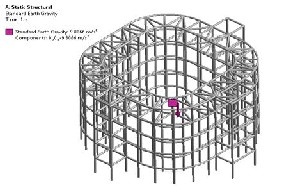
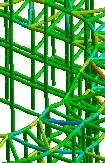
Figure below shows the FEA Model with Meshing which includes 320 columns and 494 beams.
IJSER © 2014 http://www.ijser.org
International Journal of Scientific & Engineering Research, Volume 5, Issue 4, April-2014 1125
ISSN 2229-5518
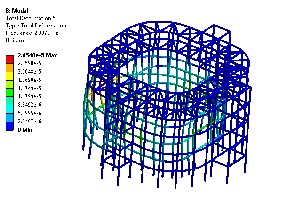
ditions on a structure. A static analysis includes steady inertia loads and time-varying loads that can be accounted as static equivalent loads. Static analysis is used to determine the dis- placements, stresses, strains, and forces in structures or components. These are the kinds of loading that can be ap- plied in a static analysis :
• Externally applied forces and pressures
• Steady-state inertial forces (gravity or rotational
velocity)
• Imposed (non-zero) displacements
• Temperatures (for thermal strain)
• Fluences (for nuclear swelling)
6.1 Overview Of Steps in a Static Analysis
The procedure for a static analysis consists of three main steps:
• Building the model.
• Applyong loads and obtaining the solution.
• Reviewing the results.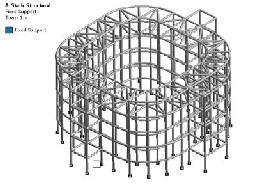
Static analysis calculates the effects of steady loading con-
IJSER © 2014 http://www.ijser.org
International Journal of Scientific & Engineering Research, Volume 5, Issue 4, April-2014 1126
ISSN 2229-5518
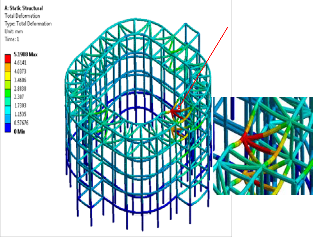
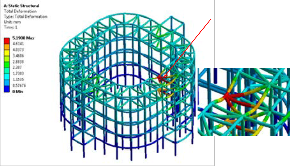
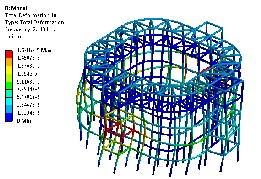
Maximum Displacement 5mm
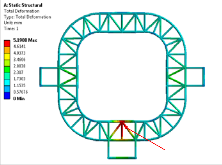
Maximum Displacement 5mm
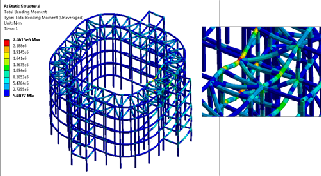
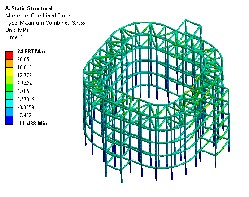
6.2 Modal Analysis
Natural Frequencies of Indoor Stadium
IJSER © 2014 http://www.ijser.org
International Journal of Scientific & Engineering Research, Volume 5, Issue 4, April-2014 1127
ISSN 2229-5518
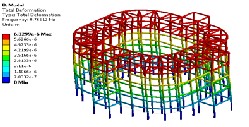
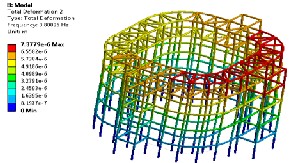
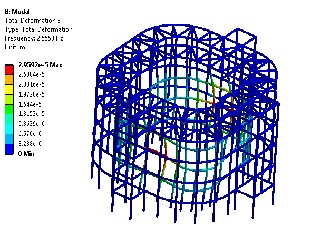
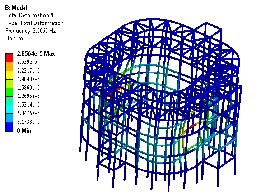
Mode-1
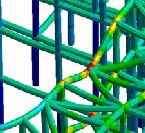
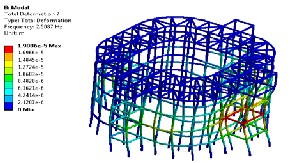
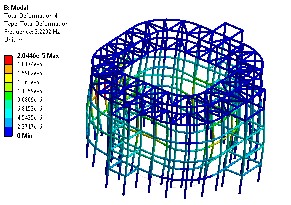
The first mode of the auditorium is rotating about an axis parallel to the x-axis in the E-W direction and the building swings in the N-S direction (Figure 6.11). The second and third modes are both twisting, in clockwise and counter- clockwise, respectively (Figure 6.12 and 6.13). The fourth mode is bending in the N-S direction (Figure 6.14). The last mode shows severe vertical motion at the northwest part of the auditorium and some bending (Figure 6.16).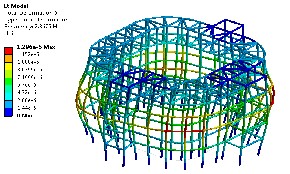
Mode-2
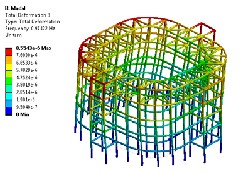
Mode-3
IJSER © 2014 http://www.ijser.org
Mode-4
Mode-5
Mode-6
Mode-7
International Journal of Scientific & Engineering Research, Volume 5, Issue 4, April-2014 1128

ISSN 2229-5518
Mode-8
Mode-9
Large model
Long transient
Full solution
Slow, accurate
Large model Long transient | ||
Large model Mode extraction ↓ Mode shapes | Small model Long transient ↓ Response spectrum | |
Combined solution Fast, approximate |
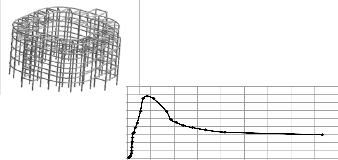
Response Spectrum Analysis
9.000
8.000
7.000
6.000
5.000
4.000
3.000
2.000
1.000
0.000
0.00 2.00 4.00 6.00 8.00 10.00 12.00 14.00 16.00 18.00
Frequency Hz
Seismic Load
Mode-10
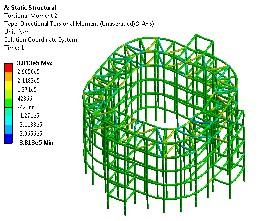
6.3 Response Spectrum Analysis
It uses the results of a modal analysis with a known spec- trum to calculate displacements and stresses in the model. The spectrum is a graph of “spectral value” versus “frequen- cy” that captures the intensity and frequency content of time- history loads.
IJSER © 2014 http://www.ijser.org
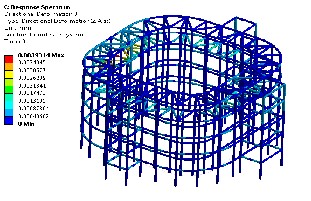
Deformation -X
International Journal of Scientific & Engineering Research, Volume 5, Issue 4, April-2014 1129
ISSN 2229-5518
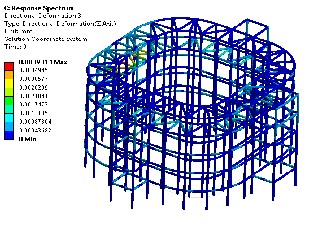
Deformation –Y
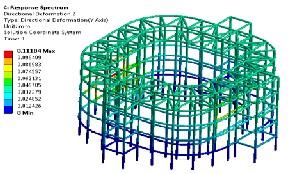
Deformation -Z
Spectrum analysis yielded a lot of information. For the excita- tion, there are three displacement response values at each node: translational displacements in the x, y and z direction, rotations about the x, y and z axis, and total displacement and rotation. The same can be said about the acceleration. There- fore, a total of 3 displacement graphs can be generated. In addition, vector graphs can also be created.
A 3-D finite element model was built and analyzed in the study. The model is based on the actual dimensions from the blueprint and includes all structural components. Static and Modal and spectrum analyses were performed with the FE package, ANSYS. The fundamental frequency obtained from the modal analysis compares well with the empirical value. Displacement, acceleration and stress distributions are gener- ated from spectrum analysis with the response spectrum. It is suggested from the analyses that the most sensitive areas for the accelerate meters to pick up structural motions are the top level and the northwest part of the building. .
My foremost gratitude goes to all that have contributed in the achievement of this study.I am Grateful to the Honourable Chancellor, Dr.J.Sundeep Anand, Bharath University, Chen- nai.
I am Grateful to Dr.v. Tamizharasan, Head Of the Depart- ment, Civil Engineering, Bharath University, Chennai. I am deeply indebted to my supervisor, Professor S. Aravindan, Assistant professor, Civil Engineering, Bharath University, Chennai.
I am sincerely grateful to Library of Structural Engineering Research Centre, Taramani, Chennai, for their support in providing me with Journals.
Civil Engineering Department, Bharath University, Chennai. I am grateful to the support and assistance provided by the team of talented and dedicated technical staff.
[1] Iqbal, A., S. Pampanin, A. Buchanan and A. Palermo. (2007) “Improved Seismic Performance of LVL Post-tensioned Walls Coupled with UFP devices” ." ACI Structural Journal,
62(2),348-352
[2] Newcombe, M. P., S. Pampanin, A.Buchanan and A. Pa- lermo 2008. “Section Analysis and Cyclic Behavior of Post- Tensioned Jointed Ductile Connections for Multi-Story Timber Buildings”, Journal of Earthquake Engineering Vol. 12(1):
83–110.
[3] Durrani A. J. and J. K. Wight (1985). "Behavior of Interior Beam-to-Column Connections Under Earthquake-Type Loading." ACI Structural Journal, 82(3),343-349.
[4] Pampanin, S., C. Christopoulos and M. J. Nigel Priestley
2003. “Performance-Based Seismic Response of Frame Struc- tures Including Residual Deformations. Part II: Multi-Degree of Freedom Systems” Journal of Earthquake Engineering Vol.
7(1): 119-14
[5] Carr A. J., (June, 1994). "Dynamic Analysis of Structures." Bulletin, New Zealand National Society for Earthquake Engi- neering, 27(2), 129-146.
[6] Priestley M.J.N. and M.J.Kowalaky, (December, 2000). "Di-
rect Displacement-Based seismic Design of Concrete Build- ings."Bulletin, New Zealand National Society for Earthquake Engineering, 33(4), 421-444.
The Experimental work was carried out in the laboratory of
IJSER © 2014 http://www.ijser.org