International Journal of Scientific & Engineering Research Volume 2, Issue 12, December-2011 1
ISSN 2229-5518
Segmentation and Area Measurement for Thyroid
Ultrasound Image
Nasrul Humaimi Mahmood and Akmal Hayati Rusli
Abstract—The thyroid measurement and recognition system is very useful in the medical field because the measurement of thyroid is important for the doctor diagnostic and medical analysis. In this paper, we present a simple guide of determine the thyroid lobes in the thyroid ultrasound image using a MATLAB. The image undergoes the contrast enhancement to suppress speckle. The enhancement im age is used for further processing of segmentation the thyroid region by local region-based active contour. The thyroid region is segmented into two parts, which are right and left with the active contour method separately. This is accordingly to the thyroid have two lobes; right lobe and left lobe. Thyroid ultrasound image of transverse view is used in this study. Therefore, the measurements only involve the width, depth and area of the thyroid region. The result of thyroid measurement is successfully calculated in pixel unit. The measurement is converted in centimetre (cm) unit. The proposed method is benefited to enhance the image and segmentation the thyroid lobe. It shows that from five samples, different people have different size of thyroid, especially in measurement of the width, depth and area.
Index Terms— Thyroid, Contrast Enhancement, Active Contours, Ultrasound, Local-region based.
—————————— ——————————
ltrasound is one of the non-invasive low cost imaging techniques for thyroid scanning. It can follow anatomical deformations in real time during biopsy and treatment,
and it is non invasive and does not require ionizing radiation. However, ultrasound images produced by this technique con- tain to echo perturbations and speckle noise that can affect the diagnosis result for a patient. Therefore, the appropriate thyro- id region detection in the ultrasound image may involve seg- mentation method and image enhancement to suppress the speckle noise [1].
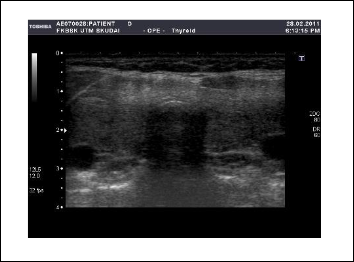
Nowadays, many techniques have made use of digital pre- processing of coherent echo signals to enhance the quality and information content of ultrasonic images of the body. Example of these methods consists of resolution enhancement, contrast enhancement to suppress speckles and imaging of spectral parameters [2]. Contrast enhancement is a technique that able to suppress speckle in thyroid ultrasound image. Figure 1 shows the thyroid ultrasound image of a normal person. One of the popular methods in contrast enhancement is histogram equalization. Histogram Equalization is a technique for reco- vering some of apparently lost contrast in an image by remap- ping the brightness values in such a way as to equalize and distribute its brightness values [3].
————————————————
Nasrul Humaimi Mahmood is currently a Senior Lecturer at Faculty of
Electrical Engineering, Universiti Teknologi Malaysia.
Akmal Hayati Rusli is a graduate student in Medical Electronics at Faculty
of Electrical Engineering, Universiti Teknologi Malaysia.
Fig. 1. Thyroid ultrasound image
Segmentation is a collection of methods allowing interpret- ing spatially close parts of the image as objects. An active con- tour is one of the methods in the image segmentation and used in the domain of image processing to locate the contour of an image and allow a contour to deform so as to minimize a given energy functional in order to produce the desired seg- mentation. Example of active contour method is snakes, bal- loons and local region-based. In this study, local region based active contour is chosen because the method focused on the detection of region based of thyroid image. The advantage of region based compare to edge based is the robustness against initial curve placement and insensitivity to image noise [4].
The rest of this paper is organized as follows. In section 2, the thyroid terminology is discussed as well as related work on proposed method. Details on method and material are de- scribed in section 3. Section 4 includes several experiments on the proposed image processing techniques that are used to segment the thyroid ultrasound image. Finally, we conclude
IJSER © 2011
International Journal of Scientific & Engineering Research Volume 2, Issue 12, December-2011 2
ISSN 2229-5518
the findings in section 5 together with introducing the future works.
Thyroid is one of the largest endocrine glands in the body. A normal healthy thyroid lobe is pear-shaped in the transverse view. Thyroid gland is located in front of the trachea just infe- rior to the thyroid cartilage. The anatomy and pathology of thyroid are explained in the following sections.
Thyroid gland is located in the neck in front of the larynx and trachea at the level 5th, 6th 7th cervical and 1st thoracic verte- brae. It is a highly vascular gland that weighs about 25 g and is surrounded by a fibrous capsule. It resembles a butterfly in shape, consisting of two lobes, one on either side of the thyro- id cartilage and upper cartilaginous rings of the trachea. The lobes are joined by a narrow isthmus, lying in front of the tra- chea. The lobes are roughly cone-shaped, about 5 cm long and
3 cm wide. The arterial blood supply to the gland is through
the superior and inferior thyroid arteries. Two parathyroid
glands lie against the posterior surface of each lobe and are
sometimes embedded in thyroid tissue. The recurrent laryn-
geal nerve passes upwards close to the lobes of the gland and
on the right side it lies near the inferior thyroid artery. Figure
2 shows the position of the thyroid gland as well as right and
left lobe for a human being. Measurement of the thyroid in-
volves three measurements, which are the width, depth and
length [7]. The normal thyroid gland is 2cm or less in width
and depth and 4.5 – 5.5 cm in length.
Fig. 2. Position of thyroid gland. [20]
The volume can then be calculated using the formula for a prolate ellipse [7] :
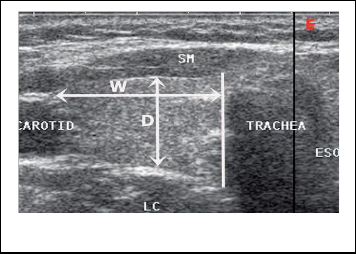
view and maximum distance from the most cranial to the most caudal part of the lobe. After the volumes of each lobe are cal- culated, they are added together for the total volume of the gland. Figure 3 and Figure 4 shows the measurement of width, depth and length of the thyroid lobe in the transverse and longitudinal view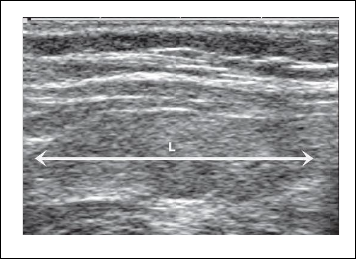
Fig. 3. Measurement of width (W) and depth (D) of thyroid lobe in the tranverse view.
Fig. 4. Measurement the length (L) in the longitudinal view.
Abnormal thyroid function may arise not only from thyroid disease but also disorders of the pituitary or hypothalamus, insufficient dietary iodine causes deficiency in thyroid hor- mone production. The thyroid gland manufactures two essen- tial –thyroxine (also referred to as T4) and tri=iodothyronine (also reffered to as T3)- and issues them into the network of tiny blood vessels than run through the gland.
There is not much difference between T3 and T4. The num-
volume
![]()
W D L
6
(1)
bers refer to the amount of atoms of iodine contained in the hormones. T3 is more powerful while T4 is released by thyroid
The width (W) of a thyroid lobe is measured from an imagi- nary vertical line drawn along the lateral edge of the trachea to the most lateral border of the thyroid gland. The depth (D) is the maximum anterior-posterior distance in the middle third of the lobe. The length (L) is measured in the longitudinal
in larger amounts, but is mostly converted to T3 in the liver
and kidneys. The effect of T3 and T4 are to increase the basal
metabolic rate of almost all the cells in the body, increase the
fat and carbohydrate metabolism, boost protein synthesis and
increase heart rate and blood flow to other organs. Thyroid
IJSER © 2011
International Journal of Scientific & Engineering Research Volume 2, Issue 12, December-2011 3
ISSN 2229-5518
hormones are also needed for normal development of organs such as the heart and the brain in children and for normal re- productive functioning. The thyroid gland also contains some other structures that are important in bone and calcium meta- bolism. The disease that related to the thyroid gland are con- sist of three categories that is abnormal secretion of thyroid hormone (T3 and T4) , goiter and tumors [5,7].
Abnormal secretion of thyroid hormone syndrome is con- sist of hyperthyroidism and hypothyroidism. Hyperthyroid- ism syndrome also known as thyrotoxicosis, arises as the body tissues are exposed to excessive levels of T3 and T4. The main effects are due to increased basal metabolic rate. In the elderly, cardiac failure is another common consequence as the ageing heart works harder to deliver more blood and nutrients to the
hyperactive body cells. The main causes are Graves’ disease,
toxic nodular goiter and toxic adenoma [5].
Second disease is goiter. This is enlargement of the thyroid
gland without signs of hyperthyroidism. Secretion of T3 and
T4 is reduced and the low levels stimulate secretion of TSH
resulting in hyperplasia of the thyroid gland showed in Figure
5. Sometimes the extra thyroid tissue is able to maintain nor-
mal hormone levels but if not, hypothyroidism develops. The causes of goiter are persistent iodine deficiency, genetic ab-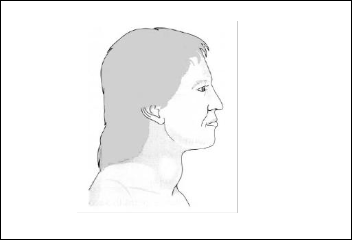
normality and iatrogenic. The enlarged gland may cause pres- sure damage to adjacent tissues, especially if it lies in an ab- normally low position. The structures most commonly af- fected are the oesophagus, causing dysphagia; the trachea, causing dyspnoea; and the recurrent laryngeal nerve, causing hoarseness of voice.
Fig.5. Enlarged thyroid gland in simple goiter [5]
Final categories disease is tumor. Tumors of the thyroid gland are consisting of two types that is Benign tumors and Malig-
A healthy thyroid lobe resembles ―ground glass‖ in appear- ance on the ultrasound monitor. Measurement of the thyroid gland sometimes is difficult using ultrasound because most transducer has a footpad only 4cm or less and normal thyroid lobe is over than 4cm long [8]. Therefore if patient with longer thyroid lobe has longer than the transducer, a ―split screen technique‖ can be used to measure the length of the lobe. Im- age produced by ultrasound systems are adversely hampered by a stochastic process known as speckle. Speckle is visible in all ultrasound images as a dense granular noise or snake-like objects that appear throughout the image Therefore the image enhancement technique is needed to enhance the ultrasound image [9,10,17].
Contrast enhancement is complete by suppressing speckles – the modulation of image brightness by random dark and bright region [3]. The procedures start with computation of calibrated radio frequency (RF) spectra. The spectra were di- vided into N partly overlapping frequency bands using Hamming filter functions. It then computes corresponding video image, balances their mean brightness levels and aver- age them to get the final image.
Other method for contrast enhancement technique requires several steps [10, 14, 18]. First, the ultrasound image will un- dergo contrast enhancement. The median, average and Wiener filter is applied separately. The output image is obtained and the differences of image are analyzed. Blurring in median filter reduces speckle and keeping the image edges but in average filter image both speckle and image edges are reduced. Oth- erwise for wiener filter the speckle is reduce and image edges intact. Median filter was able increase the intensity value at certain point in the image while average filter and Wiener fil- ter able to increase the pixels value but decreased the intensity [2]. From the result obtained, Wiener filter is better technique in reducing the speckle without eliminate the image edges and can give better image quality. The advantage of using this technique is the contrast is enhanced by a factor of 1.7. The example of contrast enhancement applied is to scan traumati- cally injured eye.
One of the techniques for contrast enhancement is using
histogram equalization technique. Histogram Equalization is a
technique for recovering some of apparently lost contrast in an
image by remapping the brightness values in such a way as to equalize and distribute its brightness values [3]. For a given X the probability density function, p (Xk) is defined as:
nk
nant tumors. Benign tumor is Single adenomas are fairly common and may become cystic. Sometimes the adenoma![]()
pX k
n
(2)
secretes hormones and thyrotoxicosis may develop. The tu- mours have a tendency to become malignant especially in the elderly. Malignant tumor are rare and usually well differen- tiate but are sometimes anaplastic [5].
for k = 0, 1, 2..., X-1, where nk is the number of how many
times that Xk appears in the input image X and n is total num- ber of samples in the input image. p(Xk) associated with the
histogram of the input image which represents the number of
pixels that have a specific intensity Xk. Based on probability density function, the cumulative density function is defined as
k
IJSER © 2011
cx pX j
j 0
(3)
International Journal of Scientific & Engineering Research Volume 2, Issue 12, December-2011 4
ISSN 2229-5518
where Xj = x for j = 0,1…, L-1. Note that c(XL-1) = 1 by defini- tion. Histogram equalization is a scheme that maps the input image into the entire dynamic range (X0, XL-1) by using cumu- lative density function as transform function.
For segmentation method , local region-based framework for guiding the active contour is ise in the study.The framework is proposed by Lankton and Tannenbaum [4]. This framework allow the foreground and background to be described in terms of smaller local regions, removing the assumption that fore- ground and background regions can be represented with global statistics. Image is defined on the domain Ω and C be a closed contour represented as zero level of a signed distance function Ø. Firstly; specify the interior of C by following ap- proximation of the smoothed Heaviside function:
Notice that, F variation with respect to can be computed. All region based segmentation energies can be put into this framework. The details explanation of active contours method are discuss in [4,11,15,16].
Several data collection had been done in order to get the raw human thyroid ultrasound images. The data had been processed using several images processing techniques which are image enhancement, segmentation and measurement to get the value of depth and width of thyroid. Even though the entire image enhancement is automatically; the initialization masks still need to do manually, which is the region of inter- est. In order to choose the thyroid region, we referred to med- ical expert.
1,
H x 0,
x
x
x otherwise
(4)
In this study, five subjects were used to obtain the thyr o- id ultrasound images. Five images collected from ultra-
sound scanning [12,13] and other related sources are used in
1 1
![]()
1
![]()
![]()
,
this study. Figure 6 (a)-(e) shows one of the samples of the
2
thyroid images.
The development of software in this study is to overcome
For the exterior of C, it is defined as
1 Hx .To specify
the problem occur due to the detection of thyroid region and
the area around the curve, the derivative of H x , which is a
smoothed version of Direct delta is used [4]. The characteristic
function in terms of a radius parameter, r is
problem in ultrasound image. The experiment is done to test the software. The experiment involves five thyroid ultrasound images. For the software development, the MATLAB software
1,
B x, y
![]()
![]()
x y r
(5)
is used [18,19]. MATLAB Image Processing Toolbox provides a comprehensive set of reference-standard algorithms and
0, otherwise.
Bx, y is use to mask the local regions. Energy functional in
terms of a generic force function, F can be defined by using
Bx, y . The Energy is as follows:
graphical tools for image processing, analysis, visualization, and algorithm development. Most toolbox functions are writ- ten in the open MATLAB language, giving user the ability to inspect the algorithms, modify the source code, and create
E
x
Bx, y F I y, ydydx
(6)
their own custom functions. In this work, we focused on the technique to improve the quality and information of the con-
x y
F is a generic internal energy measure used to represent local adherence at each point along contour. E only consider contri-
tent of ultrasonic image of the thyroid, which the methods chosen are contrast enhancement to suppress speckles and local region based active contours.
butions from the points near the contour.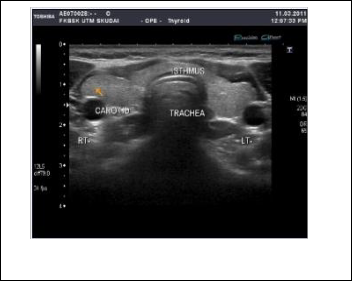
xin outer
integral over x ensures that the curve will not change the to- pology by spontaneously developing new contours. Every
point x selected by
x, mask with Bx, y
ensure that F
operates only on local image information about x. To keep curve smooth, a regularization term is add. Penalize the ar- clength of curve and weight this penalty by a parameter λ. Final energy is as follows:
E x Bx, y F I y, ydydx
x y
x![]() x
x![]() dx
dx
x
(7)
From equation 7, the following evolution equation is obtained.
(a)
Fig. 6. (a) Sample of thyroid ultrasound image
![]()
x x
t
Bx, y y F I y ydy
(8)
y
IJSER © 2011
International Journal of Scientific & Engineering Research Volume 2, Issue 12, December-2011 5
ISSN 2229-5518
Transverse view of thyroid ultrasound image is used in this study. Therefore the measurement involves in the experiment are width (W), depth (D) and area of thyroid region. The ultra- sound image is in RGB type which is an additive color of red, green, and blue. The image is converted into gray scale image for further processing. Image processing toolbox provides im- age enhancement routines.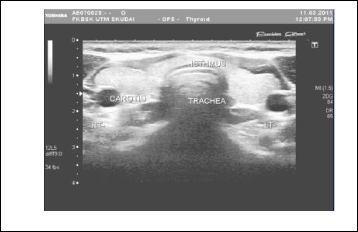
(b)
Fig. 7. Thyroid image after histeq is applied
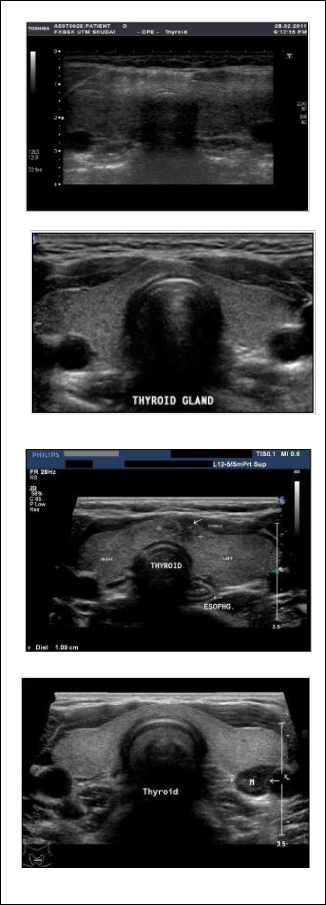
(c)
(d)
(e)
Fig. 6. (b)-(e) Samples of thyroid ultrasound image

The contrast enhancement of the image can be observed by applying histeq (enhance contrast using histogram equaliza- tion). The resulted image after applying histeq for original im- age in Figure 6(a) is shown in Fig. 7. For the segmentation me- thod, the thyroid region is segmented into two sides that are right and left. For the right side of thyroid, the suitable initiali- zation mask is created for the right thyroid region as shown in Figure 8.
Fig. 8. Initialization mask
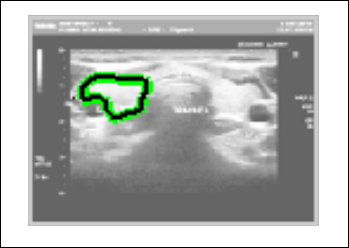
Resizing the image pixels into only the region of interest us- ing initialization mask is significant for efficient image processing. For further processing, the thyroid image and initialization mask are segmented using the local region- based active contour method. The result for the segmentation is shown in Figure 9.
Then image are converted into binary using im2bw func- tion. Fig. 10 shows the result for binary image. The chosen level value is 0.1. The process continues by enhancing the final segmentation image using imfill and bwareaopen opera- tors. This step is important because if there any black spot in
IJSER © 2011
International Journal of Scientific & Engineering Research Volume 2, Issue 12, December-2011 6
ISSN 2229-5518
the area of thyroid region of interest, the region calculation is affected.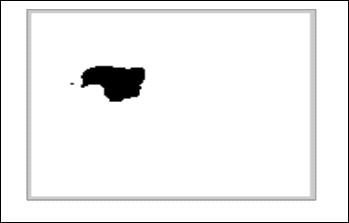
Fig. 9. Local region-based active contours
Fig. 10. The binary image from local region-based active contours.
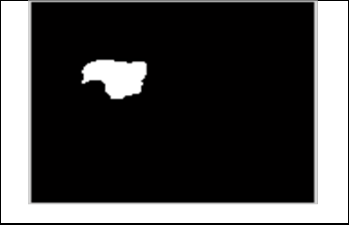
The final resulted image after several operations of image processing techniques is shown on Fig. 11.
Fig. 11. The final result of thyroid region segmentation
The image needs to resize to increase the resolution of our in- terest image. The width (W) and depth (D) is measured as shown in Figure 13 in pixel unit and is converted into centime- tre (cm).
For the left side of thyroid region, the methodology is simi-
lar to the right side. The different is for the initialization mask
value.
To summarize, all the steps taken are presented in the flow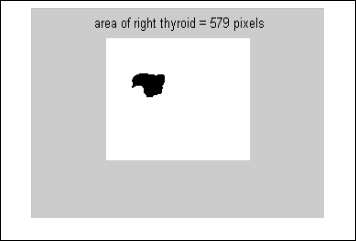
chart in Figure 14.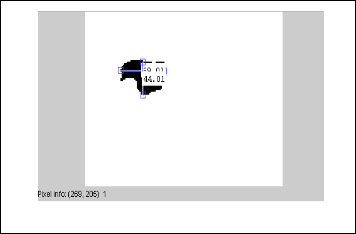
Fig.12. The measurement of the area of the right thyroid
Fig. 13. The measurement of the width (W) and depth (D) of the right thy- roid
The measurements for width (W), depth (D) and area of hu- man thyroid are presented in SI unit (centimeter). The experi- ments involve 5 samples of human thyroid ultrasound image from different person in order to observe the different of thy- roid area between different people. Table 1 indicates the result from the image processing.
The boundaries of white region are detected using operators and follow by image region properties to measure the image. The data measured is in pixels unit as shown in Figure 12. So it is require another step to convert the unit from pixels into cen- timetres. Then image is inverted again using ―~‖ operator and it display the area of human thyroid. Once again the image needs to be measured to get the width and depth of thyroid.
IJSER © 2011
International Journal of Scientific & Engineering Research Volume 2, Issue 12, December-2011 7
ISSN 2229-5518
Thyroid ultrasound image.
Change the RGB image to the grayscale image.
Contrast enhancement the image using histogram equalization.
Image segmentation: Local region based active contours.
Measure the area of segmented region.
Measure the width and length.
Results and analysis.
Fig. 14. Flow chart of the methodology.

From Table 1, different people have different size of thyroid lobe. The higher width for right lobe is person A with 1.8 cm while the lower is person D with 1.5cm. For the left lobe, per- son E has higher size of width with 1.8cm. For depth size of thyroid, the higher is person E with 1.5 cm for the right lobe while for the left lobe; person B is higher with 1.3 cm. The higher area of thyroid is person E for the right lobe and per- son B for the left lobe.
TABLE 1
THE MEASUREMENTS OF WIDTH, DEPTH AND AREA FOR THE RIGHT AND LEFT LOBE OF FIVE PEOPLES
Research found that the right lobe is usually slightly larger than the left [6]. When the thyroid gland enlarges, it extends superiorly and inferiorly to elongate the length of the lobes and laterally to broaden the width of the whole gland.
In term of accuracy analysis, for the width measurement, four out of five images have accurate measurement of width for their thyroid. While for the depth measurement three of images have an accurate measurement of depth. This analysis shows that majority of measurement using this system pro- duce an accurate value.
Local region–based active contour method is suitable for this study to segment the thyroid region. Other method of active contour such as snakes is focused on the edge-based. Edge- based active contour models utilize image gradients in order to identify boundaries not region. Snakes method is very sen- sitive to the image noise and highly dependent on initial curve placement.
The advantages of region-based approach are robustness against initial curve placement and insensitivity to the image noise. This local region-based method also can detect the re- gion automatically by only specify the initialization mask compare to the snake method, which user need to identify the area that they want to segment by specifying point by point on the image. This is hard for user who does not knows more about thyroid region. It found that edge detection technique inappropriate for ultrasound images compare to region based approach [15,16]. Although user can know the area of thyroid region automatically, users still need to measure the width and depth manually using MATLAB operators. This may cause to time delay before user can know the final result of thyroid measurement. This also may cause inaccurate re- sult of thyroid measurement because of human error.
To minimize the weaknesses of the proposed method, the automatic system that can give the width and length mea- surement of thyroid need to develop. By this system the error that occurs can be minimized. For further development of the system, the user friendly user interface need to been develop. This is because not everyone know how to use MATLAB es- pecially doctor and radiologist. Therefore the user interface can help them to use the system.
As a conclusion, the measurement of width, depth and area of thyroid is successful applied in MATLAB. Ultrasound images are widely used as a tool for clinical diagnosis. Therefore a convenient system for thyroid segmentation, measurement and ultrasound image enhancement is one of the interests. The proposed MATLAB method includes contrast enhancement using histogram equalization is important to reduce speckle that may affect the segmentation results of the thyroid. The
IJSER © 2011
International Journal of Scientific & Engineering Research Volume 2, Issue 12, December-2011 8
ISSN 2229-5518
experiment results show that the proposed method can be used to segmentation the thyroid region and give faster con- vergence compare to the active contour snake method. In fu- ture, this work could be extended to high level image processing such as processing in real-time application.
[1] Tay, P.C.,Garson, C.D., Acton, S.T., and Hossack, J.A., Ultrasound Despeck- ling for Contrast Enhancement. IEEE Transactions on Image Processing,
2010, 19 (7), pp. 1847-1860.
[2] Frederic L. Lizzi, Ernest J. Feleppa, Image Processing and Pre-Processing for
Medical Ultrasound. AIPR '00 Proceedings of the 29th
Applied Imagery Pattern Recognition Workshop, 2000.
[3] Soong-Der C., Ramli A.R., Contrast Enhancement using Recursive Mean- Separate Histogram Equalization for Scalable Brightness Preservation. IEEE Transcation on Consumer Electronics, 2003, 49 (4), pp. 1301-1309.
[4] Lankton, S.; Tannenbaum, A., Localizing Region-Based Active Contours.
IEEE Transaction on Image Processing, 2008, 17(11), pp. 2029-2039.
[5] Robert J. Amdur, Ernest L. Mazzaferri, Basic Thyroid Anatomy, in Essentials of Thyroid Cancer Management, Springer US, 2005. pp. 3-6.
[6] Savelonas, M., Maroulis, D., Iakovidis, D., Karkanis, S., Dimitropoulos, N., A variable background active contour model for automatic detection of thyro- id nodules in ultrasound images. International Conference on Image Processing (ICIP), 2005, pp.17-20.
[7] H. Jack Baskin, Daniel S. Duick, Thyroid Ultrasound and Ultrasound- Guided FNA, Springer, Second Edition, NY, USA, 2008, pp. 253.
[8] Kollorz, E.N.K., Hahn, D.A., Linke, R., Goecke, T.W., Hornegger, J., Kuwert, T., Quantification of Thyroid Volume Using 3-D Ultrasound Imaging, IEEE Transaction on Medical Imaging, 2008, 27(4), pp.457- 466.
[9] Muhammad Luqman M.Z., Elamvazuthi I., Mumtaj K. Begam, Enhance-
ment of Bone Fracture Image Using Filtering Techniques. The International
Journal of Video and Image Processing and Network Security. 9(10). pp. 43-
48.
[10] Ji, T. L., Sundareshan, M.K., Roehrig, H., Adaptive image contrast enhancement based on human visual properties. IEEE Transcation on Medical Imaging, 1994, 13(4), pp. 573-586.
[11] Maroulis, D.E., Savelonas, M.A., Karkanis, S.A., Iakovidis, D.K., Dimitropou- los, N., Variable Background Active Contour Model for Computer-Aided Delineation of Nodules in Thyroid Ultrasound Images18th IEEE Sympo- sium of Computer-based Medical System, 2005, pp. 271-276.
[12] Eko Supriyanto, Lai Khin Wee, Too Yuen Min, Ultrasonic Marker Pattern Recognition and Measurement Using Artificial Neural Network, 9th WSEAS International Conference on Signal Processing (SIP), Italy, 2010, pp.
35-40.
[13] K. W. Lai, E. Supriyanto, Automatic Detection of Fetal Nasal Bone in 2 Di- mensional Ultrasound Image using map matching. Proceedings of the 12th WSEAS International Conference on Automatic Control, Modelling & Simu- lation, 2010. pp. 305-309.
[14] Tsu-Cheng Jen, Hsieh, B., Sheng-Jyh Wang, Image contrast enhance- ment based on intensity-pair distribution. International Conference on Im- age Processing (ICIP), 2005, pp. 913-916.
[15] Mendi E., Milanova M., Image segmentation with active contours based on selective visual attention. Proceedings of the 8th WSEAS International Con- ference on Signal Processing, 2009, pp. 79-84.
[16] T. F. Chan and L. A. Vese, Active contours without edges, IEEE Transactions
on Image Processing, 2001, 10(2) , pp. 266-277.
[17] Wang, B. and Liu, D.C., A novel edge enhancement method for ultrasound imaging. The 2nd Inter. Conference on Bioinformatics and Biomedical Engi- neering, 3, 2008, pp.645-649.
[18] Gonzales and Woods, Digital Image Processing, Prentice Hall, 2008.
[19] Gonzales, Woods and Eddin, Digital Image Processing using MATLAB,
Prentice Hall, 2009.
[20] http://underactivethyroid.net/ (date access, 8 August 2011)
IJSER © 2011