International Journal of Scientific & Engineering Research, Volume 4, Issue 6, June-2013 2007
ISSN 2229-5518
Satellite Rainfall Estimation in the South-Eastern
Part of Bangladesh
Mohammad Shohidul Islam Department of Space Technology Applications International School, Beihang University Beijing, China
shohidulam79@yahoo.com
Abstract—In case of sufficient moistures contamination from BOB, the rain forecasting is challenging for the meteorolo- gists over south and south-eastern part of Bangladesh, especially in monsoon and post-monsoon period. Real time rainfall information is necessary for early warning rainfall which triggered hazards such as floods and landslides. Slow dissemina- tion of measured rainfall information was considered as a serious obstacle in terms of the use of such information for early warning purpose. Satellite based rainfall estimation had been considered as an alternative to fulfill that demand. This re- search was addressed to estimate the satellite-based rainfall by using Tropical Rainfall Measuring Mission (TRMM) satel- lite data. Then, estimated rainfall was made to compare with surface-based rain gauge rainfall which was acquired from
08 weather stations over Bangladesh for the years of 2001-2009. At first, daily rainfall was estimated by satellite. Then, monthly, seasonally and yearly rainfall was also determined and compared it with surface rainfall. Temporal and spatial analysis was performed by estimated (TRMM) and observed (RG) rainfall and at same time for the assessment of accuracy some statistical parameters such as correlation coefficients, regression equations, biases and mean absolute errors were deermined for all stations. The TRMM overestimated rainfall during pre-monsoon and underestimated during monsoon while alike during post-monsoon period. Overall, TRMM underestimated rainfall in the heavy-rainfall regions of Bangla- desh.
Index Terms—Bangladesh, Comaprison, Rain Gauge, Rainfall, TRMM, Temporal and Spatial Analysis
1. INTRODUCTION
—————————— ——————————
HE geographical location of Bangladesh is highly dis- cussed for generating weather phenomena and disasters. Bangladesh is a deltaic land at the end of the funnel shaped Bay of Bengal (Figure 1). This special geographical configuration is dominating for the formation of cyclones, floods, droughts, tornadoes, heavy rainfall and so on. Floods and cyclones are very common disaster and almost every year the country is affected by these two disasters. But the miracle is that these two disasters are directly related to heavy rainfall. Even most of the disasters like landslides, hill slides, river ero- sion, flash floods, draught etc are directly or indirectly related to precipitation. Last 05 years, there caused landslides in south and south-eastern part of the country and large number of people were killed by it (landslides) which are created by heavy rainfall upon this regions. Bangladesh Meteorological
Department
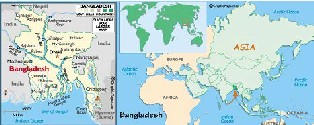
Fig. 1 Geographical Location of Bangladesh in Asia and
World Map
(BMD) is responsible organization for proving all kinds of weather forecast over the country. For precipitation measure- ment, BMD has only 35 rain gauges over the entire country. But in order to save human life and property, advance system of estimation is very essential over the region of the country. For this regard satellite based estimation can give better result for early warning. So, in this project, my main purpose is to find out a good forecasting means which will be helpful for flood forecasting, heavy rainfall estimation as well as early warning of harsh weather.
2 STUDY AREA AND DATA USED
2.1 Study Area
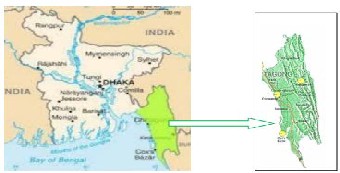
In order to estimate satellite rainfall, the south-eastern part of Bangladesh is selected. This part of the country is actually re- mote regions, islands and coastal belt. The Bay of Bengal (BOB) is directly dominated in this region for generating weather phenomena and disasters or water orientated disas- ters. Since this part of the country is situated near the BOB, the BOB plays an important role for cloud formation. Specially in monsoon period, sufficient amount of moisture is contaminat- ed upon this region which frequently creates deep clouds and as a result of it huge amount of rainfall is occurred in monsoon and sometimes also in pre-monsoon and post-monsoon peri- od.
IJSER © 2013 http://www.ijser.org
International Journal of Scientific & Engineering Research, Volume 4, Issue 6, June-2013 2008
ISSN 2229-5518
Fig. 2 Study areas (yellow color in Bangladesh map) and site map of the region.
ble reflectivity is brighter, it means that the cloud is thicker which causes heavier rainfall and if it is dark, it means that the cloud is thinner which causes less or no rainfall. For infrared brightness temperature, if temperature is colder, it means that the cloud is deeper which causes heavier rainfall and if tem- perature is warmer, it means that the cloud is thinner which causes less or no rainfall. The oldest and still useful precipita- tion-estimation technique is cloud indexing method. It rests on the observation to identify cloud types in satellite images. The precipitation would be assigned by each cloud types. The method of cloud indexing assigns a rainfall rate to each cloud type. The amount of rain at a particular location, R, is written by
2. 2 Data Used
2.2.1. Rain Guage Data
In the current analysis, the rain gauge data is mainly used to validate satellite rainfall estimates and assess their accuracy. Rain gauge data over the study area of the country were pro- vided by Bangladesh Meteorological Department (BMD) for a certain time period of from 2001 to 2009. The data included observations of both 03 hourly and daily rainfall accumula- tions at several rain gauge sites were collected from BMD sta- tions. There are 35 Meteorological Stations available through- out Bangladesh under BMD. More than 80% of these stations are First Class Observatory (FCO). I have actually collected ground-base rainfall data or rain gauge data from FCOs. It is noted that each gauge represents a near-point sampling site and can be geo-referenced with a certain satellite pixel.
2.2.2. TRMM Satellite Data
Recent years have witnessed significant developments in the field of satellite rainfall estimation. Last 10-20 years, several research works also successfully completed about related pur- pose in Bangladesh. Of particular interest is the development of estimation algorithms that can generate high-resolution rainfall products by merging infrared (IR) and microwave (MW) satellite observations. The concept behind most of these algorithms is to use the more accurate (but infrequent) MW estimates to calibrate the more frequent (but indirect) IR esti- mates so that the strengths of these individual sensors main- tained and the weaknesses are alleviated. One recent algo- rithm, which is the focus of the current study, was developed at the National Aeronautics and Space Administration (NASA) Goddard Space Flight Center (GSFC) and is based on the Tropical Rainfall Measuring Mission (TRMM) Multi- satellite Precipitation Analysis (TMPA). The TMPA dataset consists of fields of 3-hourly rainfall rates over a 0.25° x 0.25° grid within the global latitude belt ranging between 50° north and 50° south.
3 MODEL DEVELOPMENT AND METHODOLOGY
3.1. Model Development
The principle of the technique depends on the cloud proper- ties and temperature observed from the space. We can under- stand the cloud properties from visible reflectivity. If the visi-
R= ∑r i f i
Where, ri is rain rate assigned to cloud type i, and fi is the frac- tion of the time and space the point is covered with cloud type i. before making the calculations, the satellite image has to be classified.
According to the cloud indexing method, a Simulink model (Figure 3) is prepared for satellite estimation. It is a simple model and works easily for estimation of rainfall. We can easily estimate satellite rainfall if we can know the rain rate
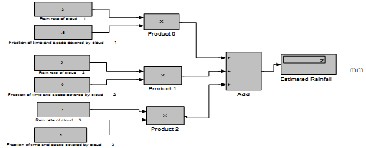
Fig. 3 Simulink Model for Rainfall Estimation
and the amount of cloud is covered by the sky in a specific time. And using the model, it was found of satellite rainfall monthly, seasonally and yearly. The yearly total rainfall is shown by (Table 1).
TABLE 1
YEARLY TOTAL OBSERVED (GAUGE) AND ESTIMATED (SATELLITE)
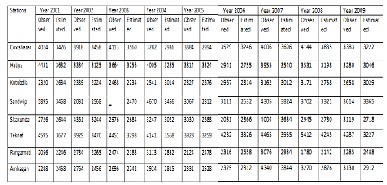
RAINFALL OVER 08 STATIONS (2001-2009)
IJSER © 2013 http://www.ijser.org
International Journal of Scientific & Engineering Research, Volume 4, Issue 6, June-2013 2009
ISSN 2229-5518
In this project, 09 years satellite rainfall was estimated using this model. Then satellite estimated rainfall was compared with surface-based rain gauge observations.
3.2. METHODOLOGY
The method for satellite rainfall estimation over the selected areas can be summarized as follows:
1. Acquisition of rain gauge and satellite data from Bangla- desh Meteorological department (BMD) and Space Re- search and Remote Sensing Organization (SPARSO).
2. Estimation of Satellite-based rainfall over the selected re- gions of Cox’sbazar, Teknaf, Sandwip, Kutubdia, Hatia, Sitakunda, Ambagan (Chittaging) and Rangamati in Bangladesh. At first, the daily rainfall was estimated and then monthly and seasonally (pre-monsoon, monsoon, post-monsoon and winter). The period of estimation co- vers from 2001 to 2009.
3. Spatial geo-referencing and temporal synchronization of gauge and satellite observations: both datasets were geo- referenced using Geographical Information System (GIS). The latitude and longitude locations of each gauge were linked to certain satellite pixel. Similarly, gauge and satel- lite datasets were temporally synchronized by accumulat- ing both datasets into daily and monthly time scales.
4. Analysis of annual rainfall spatial distribution: this analy- sis will focus on constructing maps of annual rainfall over the selected areas to establish a long- term average of rain- fall patterns from satellite estimates. This will provide in- sight into the ability of satellite data to reproduce climato- logically different rainfall patterns over the selected re- gions.
5. Analysis of rainfall seasonal cycle: this analysis will use satellite rainfall data from several years to examine the seasonal cycle of rainfall, if exits, over each of the selected areas. This investigation will indicate whether satellite rainfall estimates can discern among various characteris- tics of rainfall over different regions.
6. Statistical assessment of satellite rainfall estimates: this analysis will focus on assessment of accuracy of satellite estimates by comparison against available raingauge data. The following statistical metrics are calculated.

∑ 𝑅𝑠
Bias = ∑ 𝑅
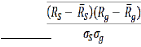
Pearson’s Correlation Coefficient, R2 =
��𝑅𝑆−𝑅𝑔 �

Where Rs and Rg represent the spatially collocated temporally synchronized satellite and rain gauge values, σs and σg repre-
sent their standard deviations, and the bar symbol represents
an arithmetic average. In these metrics, the bias provides a
measure of systematic deviation of satellite estimates from the
corresponding gauge values (a value of 1 represents no bias, a
value larger than 1 represents overestimation by the satellite,
and a value smaller than 1 represents an underestimation).
The correlation coefficient provides a measure of linear associ-
ation and ranges from 0 to 1, with 1 being a perfect correlation.
The mean absolute error (MAE) provides a measure of the
average absolute deviation of satellite estimates from the cor- responding gauge measurements.
4 RESULTS
4.1. Analysis of Temporal Rainfall Pattern
Rainfall estimates from the TRMM-TMPA dataset and the cor- responding gauge observations were analyzed to investigate the seasonal cycle and variations over the study areas. This analysis was performed over the study areas of Cox’sbazar, Teknaf, Sandwip, Kutubdia, Hatia, Sitakunda, Ambagan (Chittaging) and Rangamati in Bangladesh. Figure (4) and Figure (5) show the monthly and seasonal cycle of rainfall es- tablished over the selected eight locations. The figure includes the seasonal variations of monthly rainfall based on the TRMM-TMPA satellite estimates as well as based on the gaug- es. It should be noted that while the satellite dataset is com- pleted for time period of 1998-2009, the corresponding gauge data are available only for the years of 2001-2009. While the satellite dataset shows different magnitudes of monthly rain- fall than those shown by the gauges, it is noted that the TRMM- TMPA data exhibits a similar seasonal pattern of monthly rainfall to that of the gauges. In order to more analy- sis, seasonal total rainfall is also estimated by satellite and at same time it is compared with seasonal measurement of gauge network. In Figure 19, there are showing the seasonal compar- ison of gauge and satellite. Pre-monsoon, monsoon, post- monsoon and winter total rainfall are analyzed in this part.
From the graphical analysis of monthly and seasonal rainfall over eight stations and satellite, it is clear that satellite and gauge are performing good matching in seasonal rainfall pat- tern. In monthly analysis, there are showing more discremina- tion between satellite and gauge and this discremination is more for the month of heavy precipitation such as June, July and August. In these three months, satellites always underes- timated rainfall compared to gauge for maximun stations. The only exception is Rangamati (sometimes Sandwip) in which satellite overestimated. So, it is clear that satellite estimation is more accurate for long-term basis calculations.

Mean Absolute Error (MAE) =
𝑛
IJSER © 2013 http://www.ijser.org
International Journal of Scientific & Engineering Research, Volume 4, Issue 6, June-2013 2010
ISSN 2229-5518
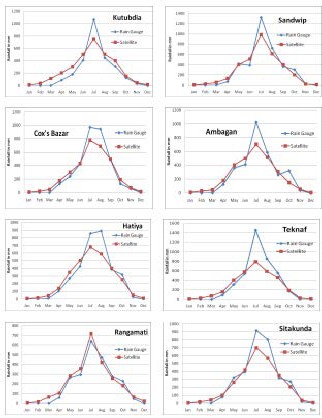
Fig. 4 Graphical comparison of time serries of monthly TRMM esti- mation and gauge observations (2009).
It is also interesting to see that TRMM-TMPA satellite estima- tion is overestimated the precipitation in the period of Pre- monsoon (March-May) comparing with gauge observations and satellite is underestimated the precipitation for South- West monsoon or Monsoon period (June-September). But sat- ellite is showing good matching (not so difference) in Post- monsoon period (October-November) and it is again overes- timated rainfall for North-East monsoon or Winter period ( December February). The gauges show similar patterns, but with different monthly magnitudes. Differences in the magni- tudes of monthly averages could be attributed to two factors: long-term bias in the satellite estimates, and the fact that the averages were established based on different number of years (12 years for the TMPA data, and 09 years for the gauges).
In order to understand the yearly precipitation pattern, yearly total rainfall is also estimated by satellite over all stations and compared it with surface rainfall. The yeearly variations be- tween satellite and gauge are performed by time series analy- sis (Figure 6). From this analysis, we see that satellite underes- timated rainfall almost every year and all stations, but only exception is Rangamati. In this station, satellite overestimated
IJSER © 2013
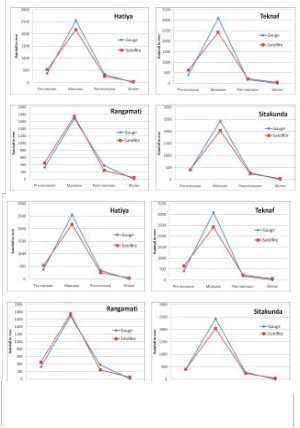
Fig. 5 Graphical comparison of time series of seasonal rain- fall of Gauge and TRMM.
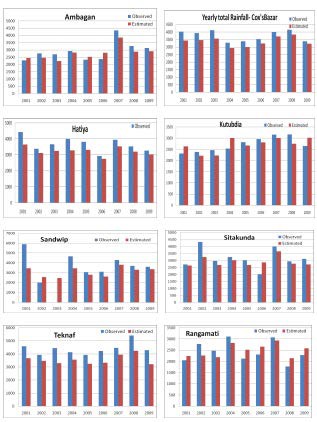
Fig. 6 Time series analysis of total annual rainfall from satellite estimates and gauge observations.
http://www.ijser.org
International Journal of Scientific & Engineering Research, Volume 4, Issue 6, June-2013 2011
ISSN 2229-5518
most of the year and sometimes also in Sandwip it is overes- timated. It is noted that rain gauge data is totally missing for
2003 and partially missing for 2002 over Sandwip. In order to specify the climatological pattern of rainfall, long-term precip- itation analysis is essential. So, time series analysis of rainfall can expose the long-term variations of precipitation. These types of time series analysis were performed over 08 meteoro- logical stations in Bangladesh. According to this analysis, we see that the variation between TRMM-TMPA estimation and gauge measurement is not more. So, TRMM-TMPA estimation is acceptable for the selected study region.
4.2. Analysis of Spatial Rainfall Pattern
The spatial rainfall patterns are also performed over the study area. Figure 7 (a) and Figure 7(b) show some examples of long-term accumulated rainfall spatial patterns over 08 sta- tions of the study areas of Cox’sBazar, Teknaf, Sandwip, Ku- tubdia, Hatia, Sitakunda, Ambagan (Chittaging) and Rang- amati (including the rest of Bangladesh). In this analysis, rain- fall was accumulated for each TRMM 0.25° x 0.25° pixel and each of year within the 1998- 2009 TRMM record.
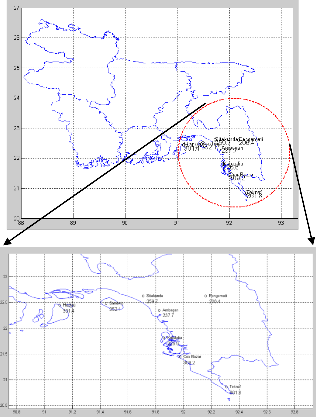
Fig. 7 Spatial Representation of the monthly average rainfall over the study area
The accumulative map for Bangladesh including the selected study areas is based on the average of total rainfall accumulat-
ed over the period of 1998-2009. It is clearly seen that the TRMM-TMPA estimates are capable of reproducing a spatial presentation of long-term rainfall patterns that are in agree- ment with climatologically known information about the re- gions.
TRMM rainfall seasonal climatology from 1998 to 2003 (Figure
32) represented the similar pattern of long range precipitation
over the country and study area. The global rainfall for the
season of DJF (December-January-February), MAM (March-
April-May), JJA (June-July-August) and SON (September-
October-November) are distributed by this presentation of TRMM satellite. In this seasonal accommodation of rainfall is also matching to our estimation of satellite rainfall. So, long- term basis analysis is more effective in this region.
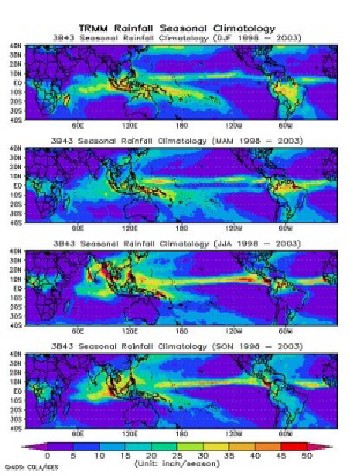
Fig. 8 TRMM global long-term accumulation of precipitation (1998-2003)
4.3. Accuracy Assessment of Satellite Rainfall Estima- tion
A ground validation analysis for the NASA TRMM- TMPA satellite rainfall was conducted by comparison against surface rain gauge observations over the study areas of Cox’sbazar, SaTeknaf, Sandwip, Kutubdia, Hatia, Sitakunda, Ambagan
IJSER © 2013 http://www.ijser.org
International Journal of Scientific & Engineering Research, Volume 4, Issue 6, June-2013 2012
ISSN 2229-5518
Sadwip, Teknaf, Hatiya, Kutubdia, Sitakunda, Ambagan (Chittaging) and Rangamati regions. The validation analysis included graphical comparisons such as scatter plots (Figure
9), time series plots (Figure 4, 5 & 6) and statistical assessment using three measures, they are bias, correlation coefficient, and mean absolute error; Table (2).
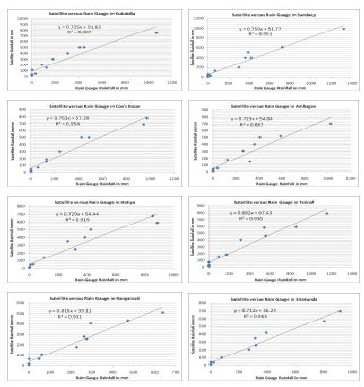
Fig. 9 Scatter plot comparisons of monthly rainfall from Satellite estimated versus the corresponding monthly Rain gauge observed rainfall over all stations.
The scatter plot comparisons show significant scatter of monthly rainfall amounts between satellite estimates and rain gauge values. However, the time series plots indicate a rela- tively good match between the timing and, to a lesser degree, the magnitudes of annual, seasonal and monthly rainfall amounts. The comparison is partially matching between the satellite estimates and rain gauge measurements. But for the regions of Teknaf and Cox’sBazar, there are showing more discrepancy between the gauge and satellite estimates. Only for Rangamati, TRMM overestimated but underestimated for all other stations. It should be noted that gauge observations are usually subject to several sources of uncertainty that may impact their data quality (such as undetected breakdown of gauges, human errors in logging-in the collected observations, data transmission problems). These issues can contribute to the discrepancy observed between the gauge and satellite es- timates. The statistical analysis shown in Table (2) indicates good levels of correlation between the gauge and satellite es- timates.
Figure 33 shows the relationship between the satellite and
gauge rainfalls. For all 08 stations the linear regresion equa- tions take the form,
y = mx+c
where, y = Satellite rainfall x = Gauge rainfall
m = slope (Corelation coefficient) and c = constant (MAE)
TABLE 2
THE REGRESSION EQUATIONS, CORRELATION COEFFICIENTS, BIAS AND MEAN ABSOLUTE ERRORS OF EIGHT STATIONS OF THE STUDY AREA.
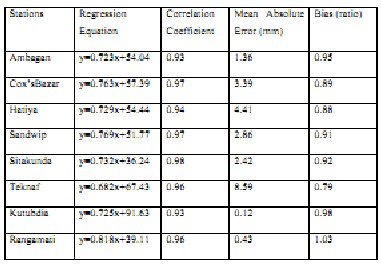
Using this linear equation we can find out the relationship between satellite and rain gauge rainfall for all stations.
For Ambagan: SAT = (0.93) Gauge + 1.36
For Cox’sBazar: SAT = (0.97) Gauge + 3.39
For Hatiya: SAT = (0.95) Gauge + 4.41
For Kutubdia: SAT = (0.93) Gauge + 0.12
For Sandwip: SAT = (0.97) Gauge + 2.86
For Sitakunda: SAT = (0.90) Gauge + 2.42
For Teknaf: SAT = (0.96) Gauge + 8.59
For Rangamati: SAT = (0.96) Gauge + 0.43
i.e. in general:
Satellite rainfall = CC* Surface rainfall + MAE
This means that the satellite rain value was m-times larger than the surface rain value plus the constant value of c (in this project 0.9) used in our study. With this equation the satellite rain can be estimated from surface data.
According to the assessment of satellite estimation with gauge measurement, it is clear that TRMM satellite provided good result for the selected regions of Bangladesh. The correlation
IJSER © 2013 http://www.ijser.org
International Journal of Scientific & Engineering Research, Volume 4, Issue 6, June-2013 2013
ISSN 2229-5518
coefficients of all stations are between 0.90 and 0.98 (where 1.0 means absolute matching) means that satellite performance is matching with surface observations. The mean absolute errors (MAE) and biases are also good matching between TRMM and Gauge. The values of bases are between 0.85 to 1.05 for all stations, which means that there are no more discrimination between satellite and gauge. According to bias (ratio), we see that satellite underestimated rainfall for all station but only exception is Rangamati. In here, satellite overestimated com- pare to true measurement. But the interesting point is that sat- ellite and gauge are good matching in Rangamati (MAE 0.43). The values of MAE of these stations are also good and ac- ceptable. So, we see that these underestimation or overestima- tion is not so far from surface measurement.
5. CONCLUSION
The present study is discussed satellite rainfall estimation in the south-eastern part of Bangladesh. For rainfall estimation the Tropical Rainfall Measuring Mission (TRMM) TMPA algo- rithm was utilized and analyzed over the south-eastern part of Bangladesh like Cox’sbazar, Teknaf, Sandwip, Kutubdia, Hatia, Sitakunda, Ambagan (Chittaging) and Rangamati re- gions. For ground- validation purposes, observations from several surface gauge stations were also used. Analysis of sea- sonal rainfall patterns indicated that the satellite algorithm was able to reproduce and discern among climatologically different rainfall regimes in the regions under consideration. The satellite rainfall seasonal patterns were mostly similar to those based on the gauges. Analysis of 12 years record of satel- lite data (1998-2009) showed that satellite techniques can pro- vide valuable quantitative representation of spatial rainfall variability and patterns over wide scales in these regions. Sta- tistical analysis of satellite rainfall estimates versus gauge ob- servations showed remarkable agreement in rainfall timing and successful detection for some of the gauges; however, rel- atively considerable differences were reported by the bias and mean absolute errors. Such differences can be attributed to the low quality of rain gauge data that are commonly encountered in remote areas, which complicates the task of quantifying uncertainties associated with satellite algorithms. Further chal- lenges are caused by limited number and records of rain gauges available in the selected regions. Therefore, it is strong- ly recommended that local research and operational authori- ties establish experimental rain gauge sites in selected regions with rigorous quality control measures and frequent mainte- nance to ensure data integrity and continuity. Such experi- mental facilities will provide valuable ground datasets that are necessary for validation of satellite rainfall techniques.
6. ACKNOWLEDGEMENT
My deepest gratitude goes first and foremost to Professor DENG Hui, my supervisor, for her constant encouragement and guidance. Second, I would like to express my heartfelt gratitude to Mr. Abdul Mannan, Scientist Synoptic Division, SAARC Meteorological Research Center (SMRC) who led me into the world of translation. I am also greatly indebted to all the professors and teachers of International School, Beihang
University, Beijing, China.
I want to thank Bangladesh Meteorological Department (BMD) and Space Research and Remote Sensing Organization (SPARSO), Dhaka, Bangladesh for providing rain gauge and satellite dataset respectively. Without their help, it was not possible to complete the research properly.
7. REFERENCES
[1] Adler, R. F. & Negri, A. J. (1988) A satellite infrared tech- nique to estimate tropical convective and stratiform rainfall. J, Appl. Met. 27, 30-51.
[2] Adler, R. F. Negri, A. J., Keehn, P. R. SL Hakkarinen, I. M. (1993) Estimation of monthly rainfall over Japan and sur- rounding waters from a combination of low-orbit microwave and geosynchronous IR data. J. Appl. Met. 32, 335-356.
[3] Adler, R. F. , Huffman, G. J. & Keehn, P. R. (1994) Global tropical rain estimates from microwave-adjusted geosynchro- nous IR data. Remote Sens. Rev. 11, 125-152.
[4] Allam, R., Holpin, G. Jackson, P. & Liberti, G.-L. (1993) AIP-2 Pre-Workshop Report. Satellite Image Applications Group, UK Meteorological Office, Bracknell, Berkshire, UK.
[5] Arkin, P. A. & Meisner, B. N. (1987) Spatial and annual variation in the diurnal cycle of large scale tropical convective cloudiness and precipitation. Mon. Weath. Rev. 115, 1009-
1032.
[6] Arkin, P. A., Joyce, S. & Janowiak, J. E. (1994) The estima- tion of global monthly mean rainfall using infrared satellite data: The GOES Precipitation Index (GPI). Remote Sens. Rev.
11, 107-124.
[7] Arkin, P. A. & Xie, P. (1994) The Global Precipitation Cli-
matology Project: First Algorithm Inter-comparison Project.
75, 401-419.
[8] Barrett, E. C. (1993) The development of the Nile Hydrome-
teorological Forecast System. Wat. Resour. Bull. 29, 933-938.
[8] Bell, T. L., Abdullah, A., Martin, R. L. & North, G. R. (1990) Sampling errors for satellite-derived tropical rainfall: Monte Carlo study using a space-time stochastic model. J. Geophys. Res. 95, 2195-2206.
[9] Bellon, A. Lovejoy, S. & Austin, G. L. (1980), Combining satellite and radar data for the short-range forecasting of pre- cipitation. Mon. Weath. Rev. 108, 1554-1556.
IJSER © 2013 http://www.ijser.org