International Journal of Scientific & Engineering Research, Volume 6, Issue 1, January-2015
ISSN 2229-5518
1960
SYNTHESIS OF ULTRA-SMALL CdSe QUANTUM DOTS
CHARLES AHAMEFULA UBANI
Department of Physics, National University of Malaysia 43600 Bangi Selangor Darul Eshan, Malaysia.
ABSTRACT
Monodisperse CdSe quantum dots (QDs) of low dimensions are of great interest due to their high performance being propel by nearly continuous electronic energy levels of highly energetic size- specific QDs. Ultra-small synthesis of CdSe QDs reported in this paper provides a new pathway that supports their fundamental scientific interest and easier processing for a variety of technological applications. Three methods for preparing ultra-small CdSe QDs comprising organometallic injection method, low temperature method and hydrothermal autoclave synthesis produce QDs of different particle sizes. Broad optical absorption and sharp emission peaks propelled by their strong oscillating strength near the band edge and their customizable bandgaps energies indicated the optoelectrical properties of the QDs are in hold of desirable light absorber properties. Elemental analysis of XPS survey spectral quantification and XRD pattern of the crystal phases at diffraction angle 2-Theta from 10o to 80o depicted the absence of impurity in the synthesized CdSe QDs. The XRD pattern of the QDs obtained at 2θ angle showed that CdSe the Bragg’s reflection slightly broadened due to narrow particle size distribution at different lattice spacing d (Å). The hkl plane of CdSe QDs were 1 1 1, 2 2 0 and 3 1 1. The synthesis methods are reproducible and represents alternative pathway to decompose pyrophoric organometallic complexes at lower temperatures for a more competitive technological innovations.
INTRODUCTION
Over the years, a major concern to the synthesis of QDs has taken different facet due to the ease with which the uniqueness of the material can be engineered to meet specific need. Early success in the synthesis of QDs was realized by Murray et al. (1993), Alivisatos (1999) and Bawendi & Bulovic, 2010). Several methods have been used to prepare CdSe QDs. The Molecular Beam Epitax (MBE) is considered expensive and not readily accessible. Peng et al (2000) adopted kinetic synthesis method for CdSe nanocrystals using CdO and elemental Se at 300 oC. Boatman et al. (2005) modified synthesis of CdSe QDs reported by Peng et al (2000) using kinetic synthesis based on a quenching technique at 250°C. The synthesis reported in this paper were used to tune the electronic structure and performance of QDs at lower temperatures. The approaches utilized comprises organometallic route, low temperature synthesis and hydrothermal autoclave synthesis.
IJSER © 2015 http://www.ijser.org
International Journal of Scientific & Engineering Research, Volume 6, Issue 1, January-2015
ISSN 2229-5518
1961
Organometallic synthesis using carbon bonds Se compound involves a spontaneous process depicting observable changes in color of the reactant solution. Organometallic injection synthesis involve high temperature injection usually at elevated temperature (300 – 500 oC) and requires a precise control of nitrogen or Argon gas to keep air away from the sample. The pyrolysis of organometallic synthetic routes developed by Murray et al. (1993) has been used for the production of large quantities of II-VI and III-V QDs (Huang et al. 2009). The synthesis technique enables the control of the final sample particle sizes to absorb wider solar spectral wavelength.
The synthesis of colloidal QDs via organometallic route is based on four essential components and comprises; precursors, organic surfactants, organic ligand and solvents. These stages are not observed with hydrothermal autoclave and low temperature also refer to as mild synthesis method reported in this paper. Because CdSe QDs is soluble in ODE, further functionalization with organic molecules possessing amino groups such as OA was necessary to achieve solubilization. Solubilization process transforms hydrophobic tendency from the disruption of dynamic bonds from nonpolar molecules to hydrophilic (polar molecule) of the QDs.
A low temperature synthesis also refer to as mild synthesis method has not been reported elsewhere. The synthesis approach is developed in an attempt to reduce risk associated with processing materials at high temperature that poses potential risk to synthesis vessels and inhalation of toxic compound. This method provides environmentally benign route to prepare nanocrystalline materials. This method is ideal for material that can decomposes at relatively low temperature. In the case of the present study, noncordinating solvent aid in dissolving the reactants at ambient temperature.
Hydrothermal synthesis utilizes single and heterogeneous phase reactions in aqueous media at elevated temperature (25 ºC to 1000 ºC) and pressure (100 kPa to 500kPa) to crystallize materials directly from solution and are usually conducted at autogenous pressure corresponding to the saturated vapor pressure of the solution at specified temperature base on the composition of the solution (less than 350ºC and 50 MPa) are preferred for commercialized hydrothermal autoclave synthesis. Transition from mild to severe conditions could be as a result of corrosion and strength limits of materials as well as the hydrothermal autoclave reaction vessels. However, advances in hydrothermal chemistry have significantly reduced the reaction time, temperature, and pressure for hydrothermal crystallization of materials to T<200 ºC and P<1.5 MPa) (Byrappa & Yoshimura 2007) and has been reduced from 195 oC to 95 oC in the case of the present study.
The phenomena that underlie the size and surface morphology control base on the thermodynamic variables include the nucleation and growth rates that controls the QDs crystal size and shape. Crystal morphology and size can potentially be affected by surfactant’s adsorption of specific solvents and solubility. In the other hand, thermodynamic synthesis variables can be constrained by the phase boundaries in a specific phase diagram making it difficult to exploit all dot sizes and morphologies for a certain material through the modifying of the thermodynamic variables (Eastman et al. 2011). However, non-thermodynamic variables such as stirring speed is also important when operating in thermodynamically limited processing variable during QDs crystal synthesis and can also influence the particle size by orders of magnitude. In addition, change in the reactants concentration can be used to control crystallites size and shape (Byrappa
& Yoshimura 2007; Eastman et al. 2011; Wang & Han 2010).
Range of conditions can be explored to control reaction time and crystallization kinetics for the purpose of developing a suitable process to produce desired properties such as specific particular size, morphology and aggregation level (Eastman et al. 2011) as applied to the present
IJSER © 2015 http://www.ijser.org
International Journal of Scientific & Engineering Research, Volume 6, Issue 1, January-2015
ISSN 2229-5518
1962
synthesis particles sizes of the QDs provides a clear indication of the energetic product and determines their properties and suitability for specific application.
MATERIALS
The materials used for the synthesis of CdSe QDs comprises trioctylphosphine (TOP, Sigma- Aldrich, 90 %), metal base selenium powder (Se, SCR, 99.5 +%, Sigma-Aldrich), octadecene (OTD, Sigma-Aldrich, 90 %) cadmium oxide (CdO, SCR, 99.9 +%, Sigma-Aldrich) and oleic acid (OA, SCR, 90 %, Sigma-Aldrich). CdO is the pyrolyphic source for organometallic synthesized CdSe QDs while metallic Se powder was the organometallic source. OTD is a non-coordination high-boiling solvent that was used to decompose CdO at low temperature. TOP was used as stabilizing and capping agent while OA as surfactant and ligand. The materials were compatible various synthesis processes and conditions to produce monodispersed CdSe QDs with particle size less than 8%. Synthesis of monodispersed CdSe QDs reported in this paper was achieved using energetic materials to grow useful solid state form of a new refined intended solid state material.
SYNTHESIS of CdSe QDs
CdSe QDs was synthesized by organometallic injection technique, low temperature technique and hydrothermal technique. Organometallic synthesis of CdSe QDs follows two distinctive route namely; preparation of TOP:Se (precursor) and synthesis of CdSe QDs. Subsequent techniques involves vigorously stir-heating of reactants mixture.
Preparation of TOP:Se Solution
25 mg of Selenium powder was weighed out using a chemical balance into a clean and dried 25 mL flat bottom flask. In the same flask, 10 mL of OTD and 0.4 mL of TOP was added using a 5 mL syringe. The mixture was stir-heated at 80 oC with the magnetic rotating at 450 rev/min for 24 hrs as illustrated in Fig 1a. A change in the coloration of the mixture from dark-brown to colorless was an indication that precursor has been formed (Isaac et al. 2013; Srivastava & Singh 2012) and the solution was stored at 23 oC.
Pyrolysis of Organometallic Injection Synthesis of CdSe QDs
Using a chemical balance, 13 mg cadmium oxide (CdO) was put into a 25 mL round bottom flask.
0.5 mL oleic acid (OA) and 10 mL of octadecene (OTD) were added into the flask using a syringe. A thermometer measuring up to 225 °C was inserted into the mixture and the mixture was heated using a heating mantle. At 195 °C, 1 ml of a week old room temperature selenium stock solution was injected into the cadmium solution. After 5 seconds of injecting the precursor, a 9-inch Pasteur pipette was used to rapidly transfer and quenched the synthesized CdSe QDs by squirting the resulting samples into different test tubes after 10 second intervals. Distinguishable changes were observed during QDs formation as the QDs particles grow to different sizes with respect to
IJSER © 2015 http://www.ijser.org
International Journal of Scientific & Engineering Research, Volume 6, Issue 1, January-2015
ISSN 2229-5518
1963
withdrawal time for six samples. The organometallic synthesis method is as illustrated in Fig. 1b while Fig. 2 depicted the injection of TOP:Se, nucleation and growth process.
Heating the colloidal reactant mixture at 95 oC transforms the opaque mixture into homogenous brownish solution and smoke-induced which lasted until the temperature reaches 120 oC. The reactant mixture boils vigorously until 170 oC until and light brown at 195 oC when the TOP-Se was added to initiate nucleation and particle growth. There was a noticeable coloration from light brown to light red and the mixture gradually darkens as the withdrawal time extends.
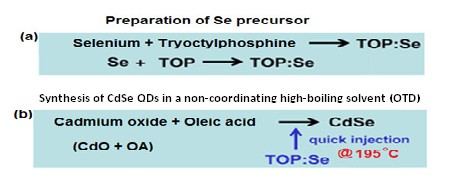
Fig. 1 Organometallic injection synthesis of CdSe QDs (a) Preparation Precursor and (b) Organometallic synthesis of CdSe QDs.
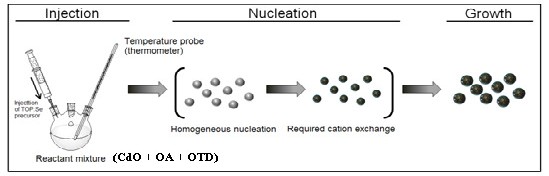
Fig. 2 CdSe QDs growth processes via organometallic injection
The synthesized CdSe QDs has a higher free energy with basic reactions as follows: Cd(OA)2 + Se ↔ CdSe–OA + OA
Low temperature synthesis of CdSe QDs
IJSER © 2015 http://www.ijser.org
International Journal of Scientific & Engineering Research, Volume 6, Issue 1, January-2015
ISSN 2229-5518
1964
Low temperature synthesis also refer to as mild synthesis in this study depicted synthesis at relatively low temperatures below 100 oC achieved through direct mixing of the reactant materials. The synthesis was conducted using Corning PC 620D digital hot plate stirrers with intermittent heating to ensure linearity for temperature control (5–550 oC) & stirring speed (60–1150 RPM). The heating process was controlled by a microprocessor that ensures minimum consistent temperature heat-up times until the set point is reached. The reactant mixture vigorously stirred- mixed for 10 mins was stirred-heated at 360 RPM for 24 hrs at 95 oC using a flat bottom flask. The resulting sample was withdrawn and stored at room temperature prior to purification.
Hydrothermal Synthesized CdSe QDs
Reactant mixture weighed out into a Teflon-walled stainless steel autoclave were thoroughly stirred-heated at 360 rpm for 24 hrs at 195 oC. The batch reactors were assembled and conditioned as follows. Two 3/8” inch stainless steel Swagelok caps were attached to the two ends of a 3/8” port connector. This was done so that one end would be permanently capped and the other end would be fitted with the compression ferrule and ready to receive the cap when needed. Conditioning consisted of triple rinsing each reactor with acetone, followed by a rinse with deionized water. The empty reactors were then capped on both ends and preheated for 1 hrs at
300 °C. The conditioned reactors were cooled and rinsed with ethanol prior to the commencement of the experiments. This process was necessary to examine the feasibility of the process variables such as the reaction temperature and reaction time.
PURIFICATION OF CdSe QDs
To separate the synthesized QDs from impurity, toluene was added to the final sample to keep it from solidifying and to extract excess OTD and TOP. After 24 hrs, the QDs solution was centrifuged and the supernatant contains the QDs, the surfactant/ligand and the stabilizing agent (TOP) in toluene solution with the excess OTD. To separate the QDs, glass vials containing the synthesized samples were filled with methanol until the solution became hazy and was centrifuged for 10 minutes at 1000 rpm causing the QDs to form a pellet. After centrifugation, the supernatant was removed and centrifuged for another 20 mins. at 1000 rpm. The sample was decanted into a clean flat bottom flask which was filled with methanol and was centrifuged for another 20 minutes at 1000 rpm. The QDs pellet was resolvated in toluene for 24hrs before characterization.
SAMPLE PREPARATION TECHNIQUES FOR CHARACTERIZATION
The sample preparation for UV-vis and PL analysis comprise a mixture of 3 ml of OTD solution and a drop of the purified sample was vigorously shaken to obtain a homogeneous mixture. A one- cm path length quartz cuvette was used for the spectral study. Perkin Elmer Lambda-20 UV-vis spectrometer was used to carry out the optical measurement in the range of 200–800 nm wavelength at room temperature. The absorption peaks recorded were signatory to the absorption properties of the samples. The PL spectra were recorded using Perkin Elmer Ls-55 Luminescence Spectrometer with xenon lamp over 350–700 nm range. For SEM, AFM, FESEM, XPS and XRD sample preparation, transparent FTO glass measuring 25.2 x 22.2 mm (1”x3”) having a thickness
IJSER © 2015 http://www.ijser.org
International Journal of Scientific & Engineering Research, Volume 6, Issue 1, January-2015
ISSN 2229-5518
1965
of 3.2 mm was ultrasonically cleaned with distilled water for 10 minutes and the process was repeated using methanol. The glass was dried in nitrogen gas to keep moisture away from the glass. Two drops of the sample were deposited on the dry-cleaned FTO substrate and was annealed at
350oC for 4 hrs under Nitrogen environment. Samples for the TEM analysis was prepared by thoroughly dissolving of the purified CdSe QDs in toluene in a ratio of 1:3 and the mixture was
dried in fumehood.
CHARACTERIZATION OF THE SYNTHESIZED SAMPLES
The synthesized QDs of CdSe was characterized using Perkin Elmer Lambda-20 UV-vis spectrometer at 200–800 nm wavelength and photoluminescence spectra (PL) using Perkin Elmer Ls-55 Luminescence with xenon lamp over 350–700 nm wavelength to determine opto-electronic properties. AFM was conducted using Niegra Prima Scanning Probe Microscope (NT–MDT) model SPM-9500 J2 (Shimadzu Co. Ltd.) to determine the surface roughness profile of the sample surface and to obtain information about the surface morphology. TEM analysis was conducted using Philips CM12 Transmission Electron Microscope (TEM) with microprocessor-based control system that operates at accelerating voltages between 20 and 120 kV and FESEM microstructure images using Carl Zeiss SMT (Merlin Compact) to determine the particle sizes and for cross sectional analysis. XRD was used to identify the samples that were formed and to obtain information about the crystalline nature of the samples using Bruker AXS D8 Advance while XPS was used to explain the surface chemistry of the CdSe QDs and to determine the kinetic and binding of ejected photoelectron using Kratos Axis Ultra XPS.
(a) (b) (c)
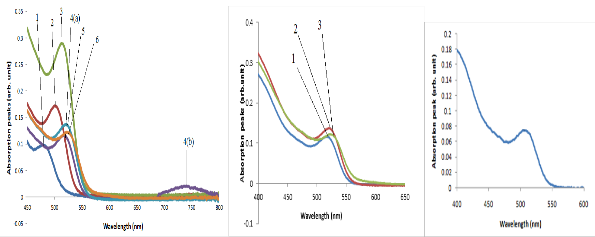
Fig. 3. Optical absorption peaks of purified CdSe QDs synthesized by: (a)e organometallic injection method at the 195oC, (b) Low temperature method at 95 oC and (c) hydrothermal autoclave method at 195oC.
IJSER © 2015 http://www.ijser.org
International Journal of Scientific & Engineering Research, Volume 6, Issue 1, January-2015
ISSN 2229-5518
1966
Table 1 Optical absorption wavelength and the bandgap of organometallic synthesized CdSe QDs withdrawn at 10 sec. interval, low temperature synthesized samples and hydrothermal autoclave sample

Sample peak Optical wavelength (nm) Bandgap (eV) Organometallic synthesis
1 | 511 | 2.42 |
2 | 498 | 2.49 |
3 | 510 | 2.43 |
4(a) | 476 | 2.60 |
(b) 740 1.67 |
5 | 517 | 2.40 |
6 | 521 | 2.38 |
The average bandgap energy is 2.34 eV.
Low temperature synthesis
1 | 513 | 2.42 |
2 | 520 | 2.38 |
3 | 521 | 2.38 |
The average bandgap energy is 2.39 |
Hydrothermal synthesized sample
504 2.46

(a) (b) (c)
IJSER © 2015 http://www.ijser.org
International Journal of Scientific & Engineering Research, Volume 6, Issue 1, January-2015
ISSN 2229-5518
1967
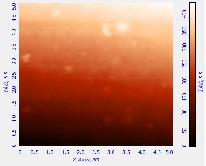
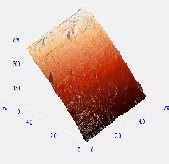
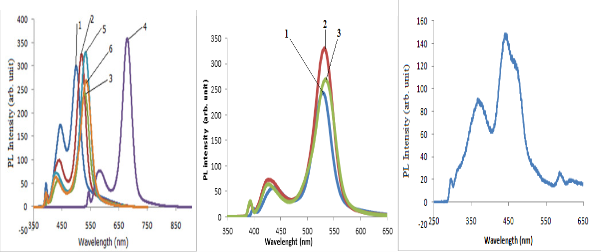
Fig. 4. PL emission peaks of; (a) organometallic synthesized CdSe QDs withdrawn at 10 sec. interval depicting excitation wavelength of the QDs and the PL intensity; (b) low temperature synthesized CdSe QDs and (c) hydrothermal autoclave synthesized CdSe QDs
(ai) (aii) (aiii)
(bi) (bii) (biii)
(ci) (cii) (ciii)
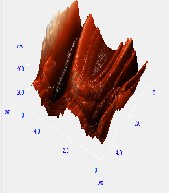
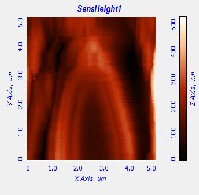
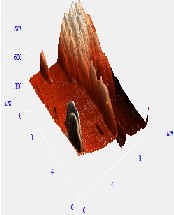
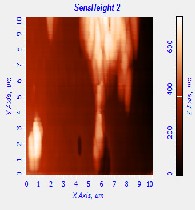
Fig. 5. AFM morphological microstructure depicting (i) 2D image, (ii) 3D image and (iii) surface roughness profile of (a) organometallic synthesized CdSe QDs; (b) low temperature synthesized CdSe QDs and (c) hydrothermal synthesized sample of Cdse QDs.
IJSER © 2015 http://www.ijser.org
International Journal of Scientific & Engineering Research, Volume 6, Issue 1, January-2015
ISSN 2229-5518
1968
Table 2 AFM surface roughness profile analysis of different synthesis method

Surface property
Organometallic Hyd. Autoclave Low. Temp.
Injection method method
Roughness average 108.961 nm 118.816 nm 62.016 nm

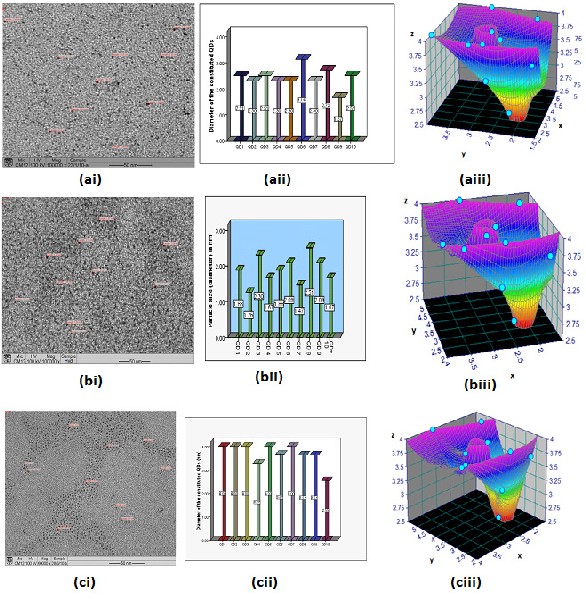
Fig. 6. TEM Image (i), QDs particle sizes (ii), and particle size orientation (iii) of CdSe QDs synthesized via; (a) organometallic injection method (average QD diameter of 2.4 nm). (b) Low
IJSER © 2015 http://www.ijser.org
International Journal of Scientific & Engineering Research, Volume 6, Issue 1, January-2015
ISSN 2229-5518
1969
temperature synthesized CdSe QDs (average QD diameter of 1.9 nm) and (c) hydrothermal autoclave synthesized CdSe QDs (average QD diameter of 3.7 nm).
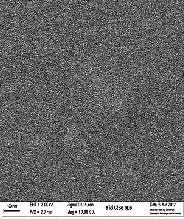
(a) (b) (c)
Fig. 7. FESEM micrograph image of CdSe QDs film synthesized via (a) organometallic injection method, (b) low temperature synthesis method and (c) hydrothermal autoclave synthesis method.
IJSER © 2015 http://www.ijser.org
International Journal of Scientific & Engineering Research, Volume 6, Issue 1, January-2015
ISSN 2229-5518
1970
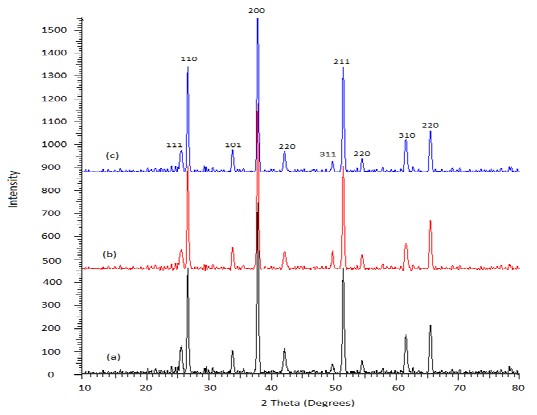
Fig. 8. XRD patterns of purified CdSe QDs annealed at 350 oC. (a) Depicted organometallic synthesized sample, (b) low temperature synthesized CdSe QDs and (c) hydrothermal autoclave synthesized QDs of CdSe.
Table 3. XRD patterns, lattice spacing and particle sizes of CdSe QDs


2θ (o) FWHM h k l planes Lattice spacing, d (Å) Particle size (nm) Organometallic synthesized CdSe QDs (a)
25.47 | 3.86 | 1 1 1 | 3.50 | 0.6 |
42.29 | 2.30 | 2 2 0 | 2.14 | 1.8 |
49.88 | 1.03 | 3 1 1 | 1.83 | 4.8 |
Low Temperature synthesized CdSe QDs (b) |
25.47 | 3.23 | 1 1 1 | 3.48 | 0.7 |
42.29 | 2.31 | 2 2 0 | 2.14 | 1.7 |
49.87 | 1.03 | 3 1 1 | 1.81 | 4.8 |
Hydrothermal autoclave synthesized CdSe QDs (c) |
25.47 | 3.23 | 1 1 1 | 3.41 | 0.7 |
42.29 | 2.28 | 2 2 0 | 2.11 | 1.7 |
49.88 | 1.07 | 3 1 1 | 1.83 | 4.6 |

Table 4. Composition and electronic state of the organometallic synthesized CdSe QDs

Elements BE KE FWHM Raw height RSF Atomic Atomic Mass

(eV) (eV) (eV) (cps) mass conc (%) conc.(%)
C 1s
1 284.50 1202.24 1.32 825.0 0.28 12.01 50.04 23.08
2 286.18 1200.54 1.44 192.0 0.28 12.01 11.65 5.37
3 287.56 1199.24 0.99 140.0 0.28 12.01 8.49 3.92
IJSER © 2015 http://www.ijser.org
International Journal of Scientific & Engineering Research, Volume 6, Issue 1, January-2015
ISSN 2229-5518
1971
O 1s
1 | 531.19 | 955.44 | 1.97 | 443.5 | 0.78 | 16.00 | 9.59 | 5.89 |
2 | 533.58 | 953.14 | 2.35 | 241.1 | 0.78 | 16.00 | 5.21 | 3.20 |
Cd 3d 1 | 404.95 | 1081.74 | 0.86 | 2079.4 | 6.62 | 112.42 | 5.31 | 22.94 |
2 | 411.72 | 1075.04 | 0.89 | 1444.1 | 6.62 | 112.42 | 3.69 | 15.94 |
3 | 405.81 | 1080.74 | 0.70 | 291.0 | 6.62 | 112.42 | 0.74 | 3.21 |
4 | 412.60 | 1074.14 | 0.70 | 142.0 | 6.62 | 112.42 | 0.36 | 1.57 |
Se 3d 1 | 53.56 | 1433.14 | 1.09 | 133.0 | 0.85 | 78.98 | 2.60 | 7.88 |
2 | 54.46 | 1432.24 | 1.09 | 118.0 | 0.85 | 78.98 | 2.31 | 7.00 |

Table 5. Composition and electronic state of hydrothermal autoclave synthesized CdSe QDs

Elements BE KE FWHM Raw heigth RSF Atomic Atomic Mass
(eV) (eV) (eV) (cps) mass conc (%) conc.(%)

O 1s
1 531.32 955.54 1.87 399.0 0.78 16.00 8.41 4.83
2 533.22 953.24 2.11 214.0 0.78 16.00 4.51 2.59
C 1s
1 284.50 1202.24 1.25 836.0 0.28 12.01 49.42 21.34
2 286.32 1200.34 1.30 196.0 0.28 12.01 11.59 5.01
3 288.01 1198.74 1.30 153.0 0.28 12.01 9.05 3.91
Cd 3d
1 405.07 1081.84 0. 86 2433.0 6.62 112.42 6.06 24.49
2 411.77 1075.04 0.80 1647.0 6.62 112.42 4.10 16.58
3 405.74 1080.74 0.78 275.0 6.62 112.42 0.68 2.77
4 412.40 1074.14 0.92 316.0 6.62 112.42 0.79 3.18
Se 3d
1 53.79 1432.94 1.08 182.0 0.85 78.98 3.47 9.84

2 54.74 1431.94 0.96 101.0 0.85 78.98 1.92 5.46

Table 6. Composition and electronic state of low temperature synthesized CdSe QDs
Elements BE | KE | FWHM | Raw heigth RSF Atomic | Atomic | Mass |
(eV) | (eV) | (eV) | (cps) mass | conc (%) | conc.(%) |

IJSER © 2015 http://www.ijser.org
International Journal of Scientific & Engineering Research, Volume 6, Issue 1, January-2015
ISSN 2229-5518
1972
O | 1s 1 | 531.10 | 955.54 | 1.65 | 409.0 | 0.78 | 16.00 | 8.77 | 5.13 |
| 2 | 533.21 | 953.24 | 1.98 | 200.0 | 0.78 | 16.00 | 4.29 | 2.51 |
C | 1s 1 | 287.64 | 1198.64 | 1.33 | 114.0 | 0.28 | 12.01 | 6.86 | 3.01 |
| 2 | 284.52 | 1202.24 | 1.23 | 857.0 | 0.28 | 12.01 | 51.57 | 22.63 |
| 3 | 286.15 | 1200.34 | 1.39 | 201.0 | 0.28 | 12.01 | 12.10 | 5.31 |
Cd | 3d 1 | 405.07 | 1074. 14 | 0. 93 | 2411.0 | 6.62 | 112.42 | 6.11 | 25.10 |
| 2 | 411.77 | 1080.74 | 0.92 | 1818.1 | 6.62 | 112.42 | 4.61 | 18.93 |
| 3 | 406.03 | 1075.04 | 0.94 | 126.0 | 6.62 | 112.42 | 0.32 | 1.31 |
| 4 | 412.97 | 1081.84 | 0.94 | 179.0 | 6.62 | 112.42 | 0.45 | 1.86 |
Se | 3d 1 | 53.69 | 1433.14 | 1.23 | 150.0 | 0.85 | 78.98 | 2.91 | 8.39 |
| 2 | 54.71 | 1432.14 | 1.35 | 104.0 | 0.85 | 78.98 | 2.02 | 5.82 |

Discussion
Optical absorption peaks of the synthesized CdSe QDs shown in Fig. 3 depicted specific wavelength produced by the interaction between electromagnetic radiations with the QDs. The peaks determine the absorption capability of the QDs to absorb electromagnetic radiation (Charles et al., 2013). The absorption of light energy (photon) by the QDs atoms (optical absorption) and re-emitting of the light energy is fundamentally an interesting property that support their application as optical and electrical material. The optical absorption spectra of the organometallic synthesized CdSe QDs obtained in the wavelength range 200-800 nm. The wavelength of optical absorption peaks is a function of reaction time. Each absorption peak depicted a sample CdSe QDs (six samples) that were grown in 1 min. (10 sec. interval). The QDs of CdSe has different bandgap (Table 1), different particle sizes and as a result absorbs different spectral wavelengths (Ping et al.
2012; Charles et al., 2014). The ability of the QDs to absorb and emit photon energy is important criteria in determining their application. Therefore, the growth behavior can be attributable to the injection of TOP:Se that generated highly activated Se monomer in the solute that produced CdSe QDs of different optical absorption wavelength.
The optical absorption peaks and emission peaks are important characterization depicting the ability of the materials to absorb and reemit electromagnetic radiation (McArthur et al. 2010). Various absorption and emission peak obtained from various synthesis methods indicates the suitability of the synthesized QDs for application such as absorber layer of quantum dot sensitized solar cell and light emitting devices (Charles et al., 2014). Six samples withdrawn at 10 secs and three samples at 20 mins. interval lettered 1-6 and 1-3 absorbs and emit spectral energy at different wavelength corresponding to different PL intensity as shown in Fig. 4.
IJSER © 2015 http://www.ijser.org
International Journal of Scientific & Engineering Research, Volume 6, Issue 1, January-2015
ISSN 2229-5518
1973
Study has shown that CdSe nanocrystals prepared using TOP as surfactant has excess Cd (Taylor et al. 2001). The excess Cd found where found at the two Se dangling bonds at each Se surface site. The excess Cd could be either as a result of the initial Cd used in the synthetic reaction mixture or as a result of the surface passivating ability of the OA ligand (Taylor et al. 2001). Therefore the excess Cd could be due to the stabilization of Cd dangling bonds by the passivating OA (Shim & Guyot-Sionnest, 1999). Dangling bonds from unpassivated Cd and Se surface atoms is consistent with the optical absorption peak at 740 nm and the excitation peak at 683 nm of the organometallic synthesized CdSe QDs and the surface morphology image was revealed by AFM analysis.
The AFM microstructure images of the quantitatively analyzed CdSe QDs presented in Fig. 5 shows two-dimension (2D) and three-dimensional (3D) images to clearly understand the morphology of the samples based on which the surface roughness profile where determined. The microstructure image obtained depicts visual representation AFM surface topographic imaging illustrated using a histogram. The dark background images depicted a shadow casted on the sample due to the position and intensity of the light shining on the AFM image to provide a high frequency structure image of the CdSe QDs.
TEM analytical measurements shown in Fig. 6 depicted (i) cross-sectional image, QDs particle sizes (ii), and particle size orientation (iii) of CdSe QDs particle sizes corresponding to bandgap energies ranging between 1.67 nm and 2.60 nm. The dark dots depicts CdSe QD images obtained at 100 kV with a magnification of 100000 x. Average QD particle size obtained were 2.4,
1.9 and 3.7 nm for organometallic injection synthesis at 195 oC, low temperature synthesized sample at 95 oC and hydrothermal autoclave synthesized at 195 oC. The bright spots depicted the contrast of the QDs images. The physical determination of the particle sizes and cross-sectional view obtained directly using the TEM using a beam of electrons which detect and collects information on the electron image formed and magnified it on the phosphor screen which is coupled to a digital camera provided the visual TEM images.
The FESEM images of the synthesized CdSe QDs shown in in Fig. 7 were obtained at an operating voltage of 3 kV at a magnification of 10.00 kX using average scan area of 4.1 mm shown in Fig. 7 depicted the microstructure images of the surface view of the crystalline orientation in the CdSe QDs. The surface morphology synchronized with the bright spot depicting the QDs images while the contrast of the samples is relative to shade casted on the sample background.
XRD analysis of the purified CdSe QDs annealed at 350 oC is shown in Fig. 8. Information that was extracted from the CdSe QDs samples were obtained at a diffraction angle 2 Theta from
10o to 80o. The ICDD reference file number of the synthesized CdSe QDs is 088-2346. Other peaks obtain at Braggs reflection of 1 1 0, 1 0 1, 2 0 0, 2 2 0, 2 1 1, 2 2 0, 3 1 0 and 3 0 1 hkl plane (Å)
belongs to SnO2 with ICDD reference file number of 046-1088 and 041-1443 respectively. The
SnO2 found in the CdSe QDs was from the fluorine doped tin oxide (FTO) substrate that was used for the analysis. Result obtained from XRD analysis shows that the intended samples (CdSe QDs)
was formed at the same h k l plane. However, a slight difference where in the FWHM and lattice spacing where recorded. The FWHM of the crystal were calculated using quantitative phase analysis of Topas software as shown in Table 3.
Elemental analysis based on the basic interpretation of wide scan survey data collected by scanning the analyzer through a full range of accessible kinetic energies dependent on the photon energy lead to quantitative determination of the surface elemental composition reported in Table
4, 5 and Table 6. To a first approximation, quantification of the data was achieved by the application of elemental and transition dependent matrix factors during data processing to
IJSER © 2015 http://www.ijser.org
International Journal of Scientific & Engineering Research, Volume 6, Issue 1, January-2015
ISSN 2229-5518
1974
eliminate the need for the use of external calibration standards. This refinement takes into account the attenuation length of the photoelectron and lead to the improvements in quantification accuracy. The XPS analysis explains the elemental composition and the electronic state of the elements present in the CdSe QDs samples including the FWHM of the width of the peak at the half height position. The atomic mass and concentration of the detected element, relative sensitivity factor (RSF) of the standardized signal intensity describes the electronic state of the element on the surface of the synthesized CdSe QDs. Since the surface chemistry of QDs is in hold of its performance, it was of interest to determine whether there are impurities. No impurity was detected on the surface of CdSe film. Thus, the absence of phosphorus indicated that the CdSe crystals were either not capped or poorly capped by TOP thus, the bonding of the of CdSe QDs and selenium dioxide formation is explained by the following reaction:
CdSe + Se + C + air (2O2) → CdSe + SeO2 + CO2
Conclusion
Ultra-small QDs of CdSe has been successfully synthesized via organometallic injection technique, low temperature method and hydrothermal autoclave method. Particle size of the energetic QDs absorb electromagnetic energy between 400 nm to 740 nm spectral wavelength corresponding to different bandgap energy. Particles sizes of the CdSe QDs uniquely depends on the synthesis method thus; method of preparation is fundamental to the application of QDs since their particle sizes is in hold of their properties.
Therefore the three synthesis techniques provides ideal pathway for resolving uncertainties confronting the development of solid state materials especially the tunability of the materials in their nano-scale to vary their properties at relatively lower temperature. The infinitesimal size of the CdSe QDs causes individual dot to fluoresce with a specific particle size relative to their emitted color which best describes their optical and electrical properties transition.
Synthesis reported in this paper were achieved at a relatively lower temperature than previously reported from 350 oC down to 195 oC and 95 oC respectively for CdSe QDs. Using a low-cost materials and convenient synthesis techniques is set to reduce the cost of devices and aid in boosting their competitive innovation at various scientific setting.
Economically viable synthesis techniques reported in this paper were modified in a way to easily decompose the pyrophoric organometallic complexes at lower temperatures. This aid in controlling of the particle size of QDs which was ascribed to synthesis temperature and time prior to quenching of the nucleation growth. The unique properties of CdSe QDs reported are customizable and provide an alternative pathway to enhance the performance of technological application that depends on it through their ability to absorb different spectral wavelength using different particle sizes.
References
Murray, C. B., Norris, D. J. & Bawendi, M. G. 1993. “Synthesis and characterization of nearly monodisperse CdSe semiconductor nanocrystallites”. Journal of the American Chemical Society
115: 8706–8715
IJSER © 2015 http://www.ijser.org
International Journal of Scientific & Engineering Research, Volume 6, Issue 1, January-2015
ISSN 2229-5518
1975
Alivisatos, A. P. 1996. Semiconductor Clusters, Nanocrystals, and Quantum Dots. Science 271:
933-937.
Bawendi, M.G. & Bulovic, V. 2010. Colloidal PbS Quantum Dot Solar Cells with High Fill Factor. ACS Nano 4: 3743-3752.
Peng, X. G., Manna, L., Yang, W. D., Wickham, J., Scher, E., Kadavanich, A. & Alivisatos, A. P.
2000. Shape control of CdSe nanocrystals. Nature, 404 (6773): 59-61.Boatman et al. (2005)
Boatman, E. M., Liesensky, G. C. & Nordell, K. J. 2005. “A Safer, Easier, Faster Synthesis for
CdSe Quantum Dot Nanocrystals”. Journal of Chemical Education 82: 1697-1699.
Huang, H., Xu, L., Chen, H., Huang, X., Chen, K. & Feng, D. 2009. Organometallic synthesis and quantum size effect of CdSe nanocrystallites. Acta Physica Sinica 8-40
Byrappa, K. & Yoshimura, M. 2007. Handbook of Hydrothermal Technology, Noyes Publications, New Jersey, USA.
Eastman, M. Besser, A. Chen, Y. X. & Jiao, J. 2011. Hydrothermal synthesis of core/shell
ZnO:Mn/Mn3O4 nanowires. Journal of Physical Chemistry C 115: 10979–10984.
Wang, J., Han H. 2010. Hydrothermal synthesis of high-quality type-II CdTe/CdSe quantum dots with near-infrared fluorescence. Journal of Colloid and Interface Science 351: 83–87.
Isaac, S., Xin, Y., Emily, J. C., Nicholas, M. M., Gerald, T. M., Olga, K. & Anna, C. B. 2013. Harnessing Fluid-Driven Vesicles To Pick Up and Drop off Janus Particles. ACS Nano 7 (2):
1224-1238.
Srivastava, P. & Singh, K. 2012. Synthesis of CdSe nanoparticles by solvothermal route: Structural, optical and spectroscopic properties. Advanced Materials Letters 3 (4): 340-344.
Ping, Z., Guoxing, H. & Minhao, Z. 2012. Optimal spectra of white light-emitting diodes using quantum dot nanophosphors. Optics Express 20 (8): 9122-9134.
Charles Ahamefula Ubani, M. Y. Sulaiman, Z. Ibarahim, N. B. Ibrahim, M. Y. Othman C. H. Lim. Effect of Oxygen On Size Controlled Synthesis of CdSe QDS Journal of Fundamental Sciences ISSN 1823-626X Vol. 9, No. 2 (2013).
McArthur, E. A., Morris-Cohen, A. J., Knowles, K. E. & Weiss, E. A. 2010. Charge Carrier- Resolved Relaxation of the First Excitonic State in CdSe Quantum Dots Probed with Near- Infrared Transient Absorption Spectroscopy. Journal of Physical Chemistry B 114-514.
Charles A. U., Sulaiman, Zahari, I., Ibrahim, N. B., Othman, M. Y. & Lim, C. H. 2014. Morphological distinction on CdSe QDs synthesized via auto clave and organometallic route. Advanced Materials Research 895: 481-489.
Taylor, J., Kippeny, T. & Rosenthal, S. J. J. 2001. A Brief History of CdSe Synthesis. Journal of
Cluster Science 12(4): 571–582.
IJSER © 2015 http://www.ijser.org
International Journal of Scientific & Engineering Research, Volume 6, Issue 1, January-2015
ISSN 2229-5518
1976
Shim, M. & Guyot-Sionnest, P. J. 1999. Synthesis, Surface Studies, Composition and Structural Characterization of CdSe, Core/Shell, and Biologically Active Nanocrystals. Journal of Chemical Physics 111(15): 6955–6964.
IJSER © 2015 http://www.ijser.org