the seed side view. 3D image of the seed is constructed from these two images.
International Journal of Scientific & Engineering Research, Volume 4, Issue 7, July-2013 18
ISSN 2229-5518
Mrs. Sunanda. V. Nikam Prof. M.N.Kakatkar
Sinhgad College of Engineering, Pune Sinhgad College of Engineering, Pune nikam_chitra@yahoo.in mnkakatkar@gmail.com
,
Abstract— The Seed property measurement is one of the important areas in agriculture and seed research sector. The advanced technology is being used for automatic measurement of the physical parameters. In image analysis, 2-d images is usually captured by single camera and used to identify seed and measure seed parameters. Two cameras have been use to capture two views of the seed, top and side view. From these images 3d image is reconstructed and the physical properties of the seed e.g. seed volume, seed surface are computed. Image processing algorithms are implemented to measure various parameters like seed length, width, surface area, volume, shape factor, roundness . The camera setup is prepared with 2 cameras, one for top and one another for side image of the seed. The L shaped backlight is used as constant background light source for both cameras to reduce the shadow effects. To calibrate both the cameras, and for getting size of seed square grid is used. This reduces the camera lens distortion. The setup is designed in to measure parameters of multiple seeds at a time. The seed mapping algorithm is developed to map the seeds from both the views.
Index Terms— CCD camera, Backlight, auto calibration. 3-d
—————————— ——————————
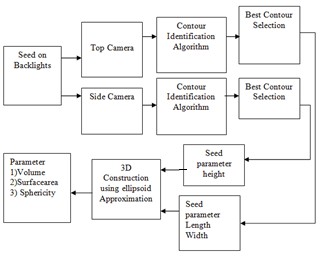
Agriculture is prime sector in India. These days the farming land is being used for other developing sectors. Hence there is a need to use technology for agriculture to increase the production. Indian govt. is concentrating on this sector. The latest technology is being used. There are many organizations and universities involved in agriculture research and development .Study of seed is one of most important in this research since the crop growth is the mostly depend on the seed. To increase the productivity, seed properties need to be studied. There are physical, chemical and other properties in which research is being done. Physical properties like seed length, width, height, volume, surface area, roundness, sphericity are measured to find the seed quality. These properties are mostly measured manually. The technology is now being used to make this automatic which saves the time and give more accurate analysis. following figure1 shows block diagram of seed analyzer.
2. MATERIALS AND METHODS
To analyze various seed properties, the seed image analyzer system uses the 2 CCD cameras. One camera captures the top view of the seeds and another CCD camera is used to capture
the seed side view. 3D image of the seed is constructed from these two images.
1. BLOCK DIAGRAM
The parameters are computed for each seed. To get the proper images the backlight is used. Backlight is the constant light source which is required for proper seed identification. Wherever possible, backlight images are taken by using the charged coupled device (CCD) camera and its flexible zoom
IJSER © 2013 http://www.ijser.org
International Journal of Scientific & Engineering Research, Volume 4, Issue 7, July-2013 19
ISSN 2229-5518
lens system. In cases where seed color is important, top-light images are also an option. To minimize reflections on shiny seeds, shadows, cloudy day illumination is available.
Segmentation :First step in seed analysis is identification of the seeds. Different techniques are used for image object identification, gray level segmentation [2], color segmentation, edge detection etc. These methods work well under controlled light environment. For seed analysis the backlight is used to highlight the seeds. The other lights are not controlled. Seeds of various colors, shapes and sizes make it difficult to get the results with any segmentation method. Defocused areas in the image makes seed edge edges blurred. The contour based methods are also used for seed identification [12]. The novel algorithm of multilevel fast edge detection contours is proposed for seed segmentation. The gray intensity and the colors vary. Multilevel edge detection algorithm identifies contours of the intensities. The image is formed by pixels. Each pixel has the brightness value which is called as the intensity / luminance. For color or gray image this is the luminance value. If we mark all the pixels of luminance 10 which has neighbor pixel with luminance value higher than 10, this there will be closed line. This is the intensity / luminance contour. When lines are identified at all luminance variations from 0 – 255, this will create various contours in the image. Figure 2.1 shows seed image. There will be many contours at the seed edge since at the edge the intensity changes from white to black. To identify the seed, single boundary contour of each seed need to be identified.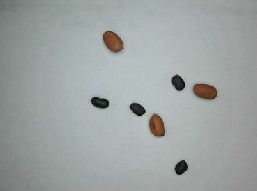
Figure 2.1: Seed Image
Figure 2.2 Multilevel edge detection(contours)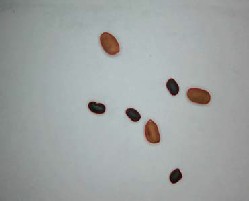
Figure 2.3: Best contour selected.
All the enclosing contours are identified and the best contour can be selected using criteria like edge gradient, contour shape etc. The contour which outlines the seed boundary will have highest edge gradient.
Region labeling:-In this an image is separated into several that are connected and that have same gray levelare grouped to- gether to form one region. Segmentation algorithms are based on one of 2 basis properties of gray level or intensity values. First are discontinuities. It is based on abrupt change in intensi- ty and image is subdivided such as edge of image. Second is similarity. It is subdivided into regions that are similar accord- ing to some predefined criteria’s applicable to both static and dynamic images.
Edge detection (Label outlining):-Labeled objects are used to outline the objects i.e. detect the edges of the object. In this step one of the edge points is identified scanning object bounding box 3 X 3. The other edge points are scanned by following the boundary points. In scanning the direction of the edge is used. Initially all the directions are searched to find the next point. Figure 2.3shows: Best contour selected edge of seed.
IJSER © 2013 http://www.ijser.org
International Journal of Scientific & Engineering Research, Volume 4, Issue 7, July-2013 20
ISSN 2229-5518
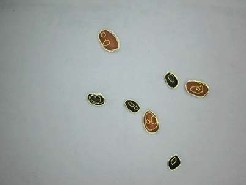
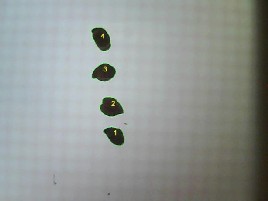
The seed images captured from top camera and side camera are shown in Fig 3.1 and fig 3.2. The multilevel edge detection algorithm identifies the seeds from both the images. The seed mapping algorithm is used to map the seeds from both the images. First in top image the identified seeds are scanned and labeled from bottom to top. To map the same seed from the side image the algorithm scans the seed from left to right in side image. When this finds the same count of the seeds, it maps seeds one to one from both the images and links the information of the seeds to measure the 3d feature. The identified and mapped seeds are shown in Figure 3.1shows top view of seeds. Figure 3.2 shows side view of seeds and figure3.3 and figure 3.4 shows seed detection.
Figure 3.1: Seed top view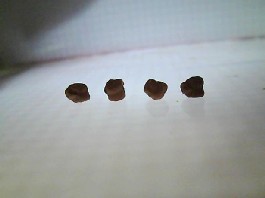
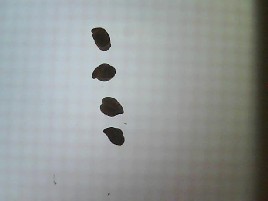
Figure 3.2: Seed Side view
Figure 3.3: Seed detected in top view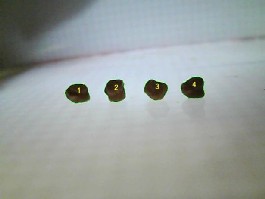
Figure 3.4: Seed detected in side view
To construct the 3d parameters from the two images the
assumption is made that seed is made by the joining the elliptical slices of variable sizes, where each slice has a thickness of a pixel size. The Number of slices is the number of pixels on the horizontal axis (seed length). The major axis diameter of each ellipse “a” is width of the seed at the slice position on horizontal axis. The minor axis diameter “b” is the height of the seed at the slice position on horizontal axis. Figure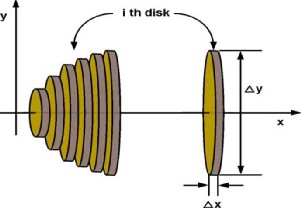
3.5 shows the sketch of the 3d approximation of the seed.
Figure3.5:Connected elliptical slices making the complete seed.
IJSER © 2013 http://www.ijser.org
International Journal of Scientific & Engineering Research, Volume 4, Issue 7, July-2013 21
ISSN 2229-5518
Volume evaluation using image-processing. The outline images of each seed as shown in Fig. 2.3 were usedto calculate volume using the disk technique (Riddle, 1979). The volume of eachcylindrical disk (Vi) shown in Figure 3.5 is equal to the crosssectional area of each ellipse (Ai) times the length of the disk (pixel). Eq. (1) shows the cross-sectional area of aellipticaldisk and Eq. (2) shows the volume of the same seed.
Elliptical disc area
Ai=π(a*b)/4 (1)
Where
i – each elliptical disc
a – Major axis diameter at the disc position
b – Minor axis diameterat the disc position
The program developed in VC++ considered each disk as having a thickness of 1pixel and used an algorithm to determine the major and minor diameters of each disk. The area of each disk was then summed to estimate the total volume as shown in Eq. (2). Finally, the same conversion factor was used to estimate the volume of each Seed.
Seed Volume
Vi=∑Ai (2)
Surface area of each seed is the computed as the summation of perimeter of each ellipse.
(3). Surface area = ∑ pi.
4.1: Roundness – To measure roundness the trace of the seed is done on the graph paper and the area under the trace is meas- ured by measuring the squares within it. The area of the clos- est circle in the seed area is also computed. The ratio of these two gives the roundness .Measuring Roundness with calipers is slow and tedious. Seed property analyzer calculate Round- ness with equation,
Roundness = (W/L +T/L +T/W)/3
4.2 :Sphericity – The Sphericity is computed by finding the length width and the thickness of the seed. The Sphericity is computed by formula
Sphericity = √b*c/(a*a) (1)
a - Longest intercept (Length)
b - Longest intercept normal to a (width)
c - Longest intercept normal to a and b (thick- ness)
In another paper this is measured as
Sphericity (Փ) = (LWT) ^1/3/L (2) L – Length , W – Width , T - Thickness
4.3 Surface Area – The surface area is computed by paper foil. The paper foil is wrapped on the seed and the surface of the paper is measured by the putting this on the graph paper and
computing the squares.Surface area can also be computed as
S=Π Dg^2 (3) Dg – Geometric Diameter
4.4 Volume – In current method, 20 seed samples are put in the water inside measuring cylinder. The difference of water levels before and after immersing the seeds gives the volume of the 20 seeds and then the average volume is computed. Volume can computed as
V = ΠB^2L^2/6(2L-B) (4)
4.5 Geometric mean Diameter – Geometric mean diameter Dg is computed as
Dg = (LWT)^1/3 (5)
4.6 Arithmetic Mean Diameter - Arithmetic Mean Diameter Da is computed as
Da =(L+W+T)/3. (6) Aspect Ratio – The aspect Ratio is calculated as
a = W / L
IJSER © 2013 http://www.ijser.org
International Journal of Scientific & Engineering Research, Volume 4, Issue 7, July-2013 22
ISSN 2229-5518
RESULT
Table 1. shows seed parameter like Length, Breadth , Height

,Volume ,Roundness , Spericity,Arithmetic Mean diameterand Geometric mean diameter of image shown in figure3.3 and figure3.4
Seed_Analysis_Report
Date:04/23/13
Time:22:04:09
[1]Irfan S. Ahmad, Research Associate, John F. Reid, Professor, Marvin R. Paulsen, Professor “Color Classifier For Symptomatic Soybean Seeds Using Image Processing ” Department of Agricultural Engineering, and James B. Sinclair, Professor, Department of Crop Sciences, University of Illinois at Urbana-Champaign, Urbana 61801
[2] “Computerised Seed Imaging: A New Tool To Evaluate Ermination
Quality”Antonio Dell’Aquila Institute of Plant Genetics, Via Amendola
165/A, 70126 Bari, Italy.
[3]NavaphattraNunak andTaweepol Suesut2 “Measuring Geometric Mean
Diameter Of Fruits And Vegetables Using Light Sectioning Method”
Height
Volume Surface_ Projcted
Arithmatic
Geometric
School of Food Engineering,2 School of Instrumentation and Control
Seed_ Length Breadth (mm*m (mm*mm Area(m _Area(m Aspect_ Roundness Sphericity
Mean
Mean
Engineering,Faculty of Engineering, King Mongkut’s Institute of
no.
(mm)
(mm)
m) *mm)
m*mm)
m*mm)
Ratio
Diameter
(mm)
Diameter
(Size)(mm)
Technology Ladkrabang, LatKrabang, Bangkok, 10520 Thailand .Received
28 September 2007; Accepted 16 February 2009
1 17.9 13.68 8.128 254.6 148.4 180.8 0.764 90.4464 0.7028 13.2373 12.57998
2 16.66 13.85 8.993 188.5 138.7 182.1 0.831 92.6375 0.7656 13.1657 12.75325
3 16.9 12.99 9.609 202.6 136 170.6 0.769 91.0744 0.7589 13.1661 12.82483
4 17.21 15.13 7.696 203.1 143 198.8 0.879 90.2647 0.7325 13.3476 12.60922
Table 1. seed parameter
This analysis can be used as a powerful tool to comprehen- sively characterize seed samples. Different cameras and wave length ranges including fluorescence modes create completely new possibilities for a swift and efficient non- destructive assessment of seed samples and individual seeds. A number of techniques for seed quality evaluation and sorting are based on the detection of various physical and physiological properties of seeds, and, more recently, the greatest efforts have focused on producing sophisticat- ed non-destructive methods. The declining cost and in- creasing speed and capability of computer hardware of image processing and its integration with controlled envi- ronmental condition systems have made computer vision more attractive for use in automatic inspection of crop seeds.
New algorithms and hardware architectures have been de-
veloped, and the availability of appropriate image analysis
soft-ware tools suggests that the use of machine vision sys- tems is becoming convenient in a seed biology laboratory. The speed of operation of a machine vision system must allow rapid image processing and recording of measure- ments. Data may be further processed statistically and dis- played graphically, and a database may be developed to integrate image analysis.
[4].B.G. Armstrong1, M. Weiss1, 2, R.I. Grieg1, J. Dines3, J. Gooden1, 4 and G.P. Aldred1“Determining Screening Fractions And Kernel Roundness With Digital Image Analysis ”1, Institute of Food and Crop Science, niversity of Ballarat, Ballarat, VIC, 3353, Australia 2 Weiss Enterprises, Branford, CT, 06405, USA 3 Allied Mills, Toowoomba, Qld, 4350, Australia
4 Joe White Maltings, elbourne, VIC, 3000, Australia
[5]Majid Rashidi1 and Mohammad Holami.“ Determination of Seed Volume Using Ellipsoid Approximation and Image-processing Methods”, Department of Agricultural Machinery, Faculty of Agriculture, Islamic Azad University, Takestan Branch, Iran 1Corresponding author’s e-mails: majidrashidi81@yahoo.com; m.rashidi@aeri.ir
[6] EartGose, Richard Johnsonburg and Steve Joust, “Pattern Recognition
and Image Analysis”,Prentice-Hall of India-2003.
[7] Robert J Schalkoff, “Pattern recognition : Statistical ,Structural and neural approaches”, John Wiley
[8] Milan Sonka Vaclav Hlavac Roger Boyle, “Image Processing, Analysis, and Machine Vision”, Second Edition, Thomson Publication
[9] RafelGonzallez and R. Woods,” Digital Image Processing”, Second edition
[10]Bryan Catanzaro, Bor-Yiing Su, Narayanan Sundaram, Yunsup Lee, Mark Murphy, Kurt Keutzer“Efficient, High-Quality Image Contour Detection ” Eecs Department, University of California at Berkeley 573
Soda Hall, Berkeley, CA 94720
IJSER © 2013 http://www.ijser.org