International Journal of Scientific & Engineering Research, Volume 3, Issue 10, October-2012
ISSN 2229-5518
Risk Management in Energy Industries of India
Ankit Tiwari, Assistant Professor, Oriental University Indore, India
Abstract—Considering the increased complexity of energy projects as companies are entering a new technological era marking the end of "easy oil", there is a growing concern about the real preparedness of companies to deal with the new risks they are facing. T he potential severity of those risks due to the important damages caused to the environment and their possible impact on populations of India. Furthermore, the motoring of risk management is important for our country so as to do more research for future development.
Index Terms—Central Electricity Authority (CEA), Ministry of Power (MoP) and Government of Uttaranchal (GoU).
—————————— ——————————
T hough most energy companies have now put in place a risk management organization and rigorous risk control sys- tems, mostly to comply with new laws and regulations, the lessons drawn from the recent past indicate that it did not re- sult in much improved safety performance. In fact compliance is not enough; it does not guarantee that risks are effectively under control. Most accidents are explained by transgression of safety rules and procedures, excessive risk taking or simply risk blindness. It demonstrates that risk management rules and procedures may exist but are not always taken seriously enough within organizations. Why is it so? Partly because ef- forts made in this domain are not reflected in the value of the company but rather have a negative impact on usual financial performance indicators.
More or less, preventive measures aiming at reducing the risk exposure of the company have a cost, and therefore contribute to the deterioration of performance indicators, whereas there is usually no clear assessment of their positive impact. Hence there is an incentive to postpone or just ignore safety measures. For instance postponing an expensive maintenance programme may be the solution to achieve a targeted return on equity or preserve the level of operating cash-flows for the current year, yet it may prove dangerous. Would the resulting increased risk exposure due to poor maintenance be identified and reported the decision might be different.
![]()
On the exhibit below we indicate the components of the "net risk exposure" for a company which is made of contingent assets and liabilities. Prospective losses can be treated as con- tingent liabilities for a value equal to the expected losses1; on the other side guarantees acquired from insurers or resulting from contractual agreements with other parties should be seen as "contingent assets" compensating for a part of expected losses. The difference is the net risk exposure.
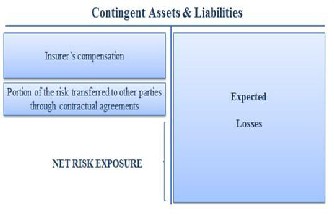
Figure.1
Developing an efficient risk management programme would indeed reduce expected losses and/or increase guarantees and hence increase the equity value. If investors are well informed on a perfect market, this risk reduction would be reflected in a "marked to market" value of the firm. But indeed rather than perfect information ambiguity dominates. Moreover financial analysts who are expected to provide investors with relevant information do not seem to pay much attention to the issue as anyone can observe when reading their notes. Yet, when po- tential losses can represent billions of Rupees - as it is the case for energy companies exposed to the risk of fatalities and se- vere environmental damages - it might be a good way for- ward. In particular, any attempt to value the quality of risk management, would be a good move. A risk management per- formance indicator would inform stakeholders about the probability and severity of potential accidents, have an influ- ence on conditions negotiated with business partners, on the cost of debt and eventually on the share price. Undoubtedly companies would regard such an indicator seriously
Plutonium is a man-made waste product of nuclear fission, which can be used either for fuel in nuclear power plants or for bombs.
IJSER © 2012
International Journal of Scientific & Engineering Research Volume 3, Issue 10, October-2012
ISSN 2229-5518
In the year 2000, an estimated 310 tons (620,000 pounds) of civilian, weapons-usable plutonium had been produced.
Less than 8 kilograms (about 18 pounds) of plutoni-
um is enough for one Nagasaki-type bomb. Thus, in the year 2000 alone, enough plutonium was created to make more than 34,000 nuclear weapons.
The technology for producing nuclear energy that is shared among nations, particularly the process that turns raw uranium into lowly-enriched uranium, can also be used to produce highly-enriched, weapons- grade uranium.
The International Atomic Energy Agency (IAEA) is responsible for monitoring the world’s nuclear facili- ties and for preventing weapons proliferation, but their safeguards have serious shortcomings. Though the IAEA is promoting additional safeguards agree- ments to increase the effectiveness of their inspec- tions, the agency acknowledges that, due to meas- urement uncertainties, it cannot detect all possible di- versions of nuclear material. (Nuclear Control Insti- tute)
On March 11, 2011, a strong earthquake hit off the coast of Japan. The resulting tsunami caused melt- downs at multiple reactors at the Fukushima Daiichi nuclear power plant. For more information on the ac- cident at Fukushima.
On April 26, 1986, the No. 4 reactor at the Chernobyl
power plant (in the former U.S.S.R., present-day Ukraine) exploded, causing the worst nuclear acci- dent ever.
30 people were killed instantly, including 28 from radiation exposure, and a further 209 on site were treated for acute radiation poison- ing.
The World Health Organization found that
the fallout from the explosion was incredibly far-reaching. For a time, radiation levels in Scotland, over 1400 miles (about 2300 km) away, were 10,000 times the norm.
According to the book Chernobyl: Consequenc-
es of the Catastrophe for People and the Environ- ment, 985,000 deaths can be attributed to the Chernobyl accident between 1986 and 2004.
The accident cost the former Soviet Union more than three times the economic benefits accrued from the operation of every other Soviet nuclear power plant operated between
1954 and 1990.
In March of 1979, equipment failures and human er- ror contributed to an accident at the Three Mile Island nuclear reactor at Harrisburg, Pennsylvania, the worst such accident in U.S. history. Consequences of
the incident include radiation contamination of sur- rounding areas, increased cases of thyroid cancer, and plant mutations.
According to the U.S. House of Representatives Sub-
committee on Oversight & Investigations, "Calcula- tion of Reactor Accident Consequences (CRAC2) for US Nuclear Power Plants” (1982, 1997), an accident at a US nuclear power plant could kill more people than were killed by the atomic bomb dropped on Nagasa- ki.
All the steps in the complex process of creating nucle- ar energy entail environmental hazards.
The mining of uranium, as well as its refining and en- richment, and the production of plutonium produce radioactive isotopes that contaminate the surround- ing area, including the groundwater, air, land, plants, and equipment. As a result, humans and the entire ecosystem are adversely and profoundly affected.
Some of these radioactive isotopes are extraordinarily long-lived, remaining toxic for hundreds of thou- sands of years. Presently, we are only beginning to observe and experience the consequences of produc- ing nuclear energy
Nuclear waste is produced in many different ways.
There are wastes produced in the reactor core, wastes
created as a result of radioactive contamination, and
wastes produced as a byproduct of uranium mining, refining, and enrichment. The vast majority of radia- tion in nuclear waste is given off from spent fuel rods.
A typical reactor will generate 20 to 30 tons of high-
level nuclear waste annually. There is no known way
to safely dispose of this waste, which remains dan- gerously radioactive until it naturally decays.
The rate of decay of a radioactive isotope is called its
half-life, the time in which half the initial amount of atoms present takes to decay. The half-life of Plutoni- um-239, one particularly lethal component of nuclear waste, is 24,000 years.
The hazardous life of a radioactive element (the
length of time that must elapse before the material is considered safe) is at least 10 half-lives. Therefore, Plutonium-239 will remain hazardous for at least
240,000 years.
There was a proposal to dump nuclear waste at Yucca
Mountain, Nevada, a site that is considered sacred by the Western Shoshone.
The plan was for Yucca Mountain to hold all
of the high level nuclear waste ever produced from every nuclear power plant in the US.
IJSER © 2012
International Journal of Scientific & Engineering Research Volume 3, Issue 10, October-2012
ISSN 2229-5518
However, that would completely fill up the site and not account for future waste.
Transporting the wastes by truck and rail would be extremely dangerous.
Repository sites in Australia, Argentina, China, southern Africa, and Russia have also been consid- ered.
Though some countries reprocess nuclear waste (in essence, preparing it to send through the cycle again to create more energy), this process is banned in the U.S. due to increased proliferation risks, as the repro- cessed materials can also be used for making bombs. Reprocessing is also not a solution because it just cre- ates additional nuclear waste.
India has immense economically exploitable hydropower po- tential of over 84,000 MW at 60% load factor (148700 MW in- stalled capacity), with Brahmaputra, Indus and Ganges basins contributing about 80% of it. In addition to this, small, mini and micro hydropower schemes (with capacity less than 3
MW) have been assessed to have 6781.81 MW of installed ca- pacity. Of this enormous hydro potential, India has harnessed only about 15% so far, with another 7% under various stages of development. The remaining 78% remains un-harnessed due to many issues and barriers to the large scale develop- ment of Hydropower in the subcontinent.
Various studies have established the ideal Hydro thermal power mix for India at to be at 60:40. The present mix of 75:45 is creating much problem in the Indian power system with country facing energy shortage of 9.3% and peaking shortage of 12.8%. The total requirement ending XI plan is set to be
206000 MW. The current installed thermal and hydropower
capacity stands at 66% and 26% of the total power generated
with 83272 and 32726 MW respectively. Remaining 8% of
10091 MW is achieved from other forms including wind and
nuclear. The current captive generation amounts to 14636
MW.
India’s power system is divided into five major region name- ly, the Northern region, Western region, Southern region, Eastern region and North-Eastern region, with each region facing separate issues. While the Eastern and North-Eastern regions are power abundant, the Northern and Western re- gions have greater power demands. The hydropower potential is largest in NE region with 98% of it still untapped. Northern, Eastern, Western and Southern regions have 79%, 77%, 23% and 33% untapped hydropower potential respectively.
Table 1: List of Hydro Electric Stations with capacity above 3
MW
Northern | 78 | 234 | 11070.30 |
Western | 45 | 117 | 6588.80 |
Southern | 92 | 286 | 11004.35 |
Eastern | 26 | 82 | 2424.10 |
North Eastern | 15 | 42 | 1094.70 |
Total | 256 | 761 | 32182.25 |
The Central Electricity Authority (CEA) and Ministry of Pow- er (MoP) are the nodal agencies involved in power sector planning and development at the central level. Being a concur- rent subject under the Indian Constitution, electricity is gener- ated, transmitted, maintained and developed both by central and state authorities, with the primary role with the states. With the central policy providing the overall direction for de- velopment, State determines the power generation, distribu- tion and management systems. The development of water resources lies with the State Government. Since hydropower development involves water resources, the responsibility of its development stays primarily with the State agencies.
The power sector in India is still largely public with 89% share in the total installed capacity.
Hydropower has immense benefits and has been brought for- ward as a preferred option for power generation over the last decade. The reasons for these can be summed as follows:
Abundant potential of hydropower development in
India as discussed above
With relative independence from international market like oil prices, hydropower involves no extra foreign exchange outgo
Environment friendly
Hydropower projects support socio economic devel- opment of remote areas as the project site is devel- oped
Hydropower is cost effective and renewable form of energy
It has additional benefits like irrigation, flood control, tourism etc.
Even with these benefits, Hydropower has had slow devel- opment in India especially in last few decades. This has pri- marily been due to:
Long gestation period
Time consuming process for project clearances
Until recently, the national focus has been on thermal generation
Highly capital intensive and absence of committed funds
IJSER © 2012
International Journal of Scientific & Engineering Research Volume 3, Issue 10, October-2012
ISSN 2229-5518
Poor financial health of State Electricity Boards (SEBs)
Technical constraints due to complex geological na- ture of the projects
Inter-state disputes as Water is a state subject
Absence of long tenure loans makes it difficult for private investors
Advance against depreciation is disallowed
14% return on equity (ROE) is not attractive enough for investors
Dearth of competent contracting agencies to construct the project site
The national focus on thermal generation has been shifting towards hydropower development. To this effect, Govern- ment of India introduced a national policy on Hydropower development in 1998, in which hydropower has been accepted a national priority with emphasis on un-harnessed potential especially in the NE region.
The Government of India set up a National Committee in 1987 and a Standing Committee in 1998 to oversee the progress on hydropower development.
This section derives largely from the report submitted by the Standing Committee on Energy (2005-06) - Hydro power: a Critique which discusses the actions taken by the Government on the recommendations made by the Committee in the forty second report on hydro power in India.
To expedite early execution of hydro projects, banka- ble Detailed Project Report (DPR) based on detailed survey should be prepared to avoid geological uncer- tainties. Survey & investigation and analysis of geo- logical, geo-morphological, geo-electrical, hydrologi- cal data etc. should be done at the time of preparation of a DPR itself in order to minimize the impact of risks. It is, therefore, necessary to expedite survey and investigations with the latest state of the art technolo- gy and prepare a shelf of projects for execution. The quality of DPRs should be of high standard which should infuse confidence in the national/international developers to take up the execution of projects with- out loosing time in rechecks etc at the same time, con- tract monitoring as distinct from project monitoring should be emphasized and land acquisition and infra- structure development be settled and completed be- fore the start of the project.
Renovation and Modernization (R&M) has been rec- ognized world over as a well proven cost effective technique for improving the performance/efficiency of older power plants. The useful life of the plants can be increased by R&M and the plants yield benefits in the shortest possible time at a reasonable cost. GoI in its policy on hydropower development, 1998 has laid
stress on need for renovation and modernization of hydro power plants. Accordingly, Government of In- dia set up a Standing Committee to identify new hy- dro R&M schemes to be undertaken for implementa- tion under Phase-II.
The Pump Storage potential should be harnessed as these are essential in optimizing energy generation from base load thermal stations and in meeting peak load and system contingencies. Only 2.45% of total identified potential of 94,000 MW Pump Storage Schemes had been harnessed and another 2.5% are under construction. New exclusive program/action plan for PSS should be launched, to tap the vast po- tential.
Contingency Plan for Hydro Projects affected by Nat- ural Calamities need to be prepared and made public
National Policy on Rehabilitation and Resettlement
(R&R) should be finalized and made public.
There is a need to setup single window clearance for hydro projects. Various authorities such as the Cen- tral Electricity Authority (CEA), the Ministry of Fi- nance, Ministry of Environment and Forests, etc. are involved in the appraisal of a hydro power project be- fore it is certified for development. It will be desirable to have a single window dispensation/authority so that a project is cleared without many hassles. Any hydro project submitted for clearance should receive all the statutory/non-statutory clearances/approvals within six months of submission of the proposal. The certification of commercial viability should be given within 15 days, especially to private developers. The Techno-Economic, MoEF and CCEA clearances should be given within 1, 2 and 2 months respective- ly. The Ministry of Power should have a set of hydro projects cleared from all the angles. MoEF should also be involved in the appraisal process.
There are long delays on account of land acquisition for the project. The process of land (both private and Govt.) acquisition for a project differed from State to State as per Land Acquisition Act. The Government should amend Land Acquisition Act and include hy- dro power projects in the priority list and the State Governments should be persuaded to provide land to the project authority in agreed time frame to facilitate shifting of Project Affected Persons (PAPs).
The hydro projects which involve lesser risk element and entail lesser capital investment can be considered for development in the Private Sector. Public Sector can take up (a) Multi purpose Projects (b) Projects In- volving inter-State issues and in inter-State river sys- tems, (c) Projects involving cooperation with neigh- boring countries and (d) Projects for complementary
IJSER © 2012
International Journal of Scientific & Engineering Research Volume 3, Issue 10, October-2012
ISSN 2229-5518
peaking with regional benefits (e) Projects in the
North-Eastern Region etc.
There is also a need to off-load indirect cost compo- nents on hydro project. Many hydro projects are lo- cated in troubled areas and infested by militancy and terrorist activities. There is an urgent need to amend the present policy of the Government in regard to charging the entire security expenditure from concept and until commissioning - on the project cost. How- ever, the recurring expenditure incurred on security, once a project goes on stream could to be charged on the project developer.
The cost of access roads should not be included in the project cost, as development of hydro projects triggers economic and commercial activities around the pro- ject site and results in economic benefit to the State. Inclusion of R&R, flood moderation costs, along with the provision of 12% free power to the State in the capital cost of the project needed reconsideration as the provision did not apply to thermal power pro- jects.
Although the Government has planned to achieve
50,000 MW of additional power by the end of
11thPlan period, the incentives such as bene-
fits/concession in custom duties and local lev- ies/taxes on project components are being denied for projects even up to 250 MW resulting in low invest- ments in new power schemes.
A premium as well as lease rent @ 10% is charged where forest land is diverted for a hydro power pro- ject. This needs to be discussed with the State Gov- ernments as land is a subject matter.
Uttaranchal has an estimated hydropower potential of 20,236
MW against which only about 1,407MW has been harnessed
so far. The Government of Uttaranchal (GoU) has introduced separate policy guidelines for development of hydropower projects of capacity up to 25MW and 25-100 MW. The policy promotes Small Hydro Power (SHP) projects with installed capacity of up to 25MW through IPP. The main issues from the policy document are discussed as follows:
Lack of Detailed Project Reports (DPRs) and technical data
Lack of bankable DPRs of the projects for development in the private sector before their allotment makes it very difficult for the private investors/ developers to take investment deci- sions.
Similarly technical data on availability of water at the diver- sion site of the project should be made available to the devel-
oper before project allocation. Currently, river discharge ob- servations are not made available to the developers on pretext of confidentiality and are made available to the concerned government department only after the approval of the Minis- try of Water Resources, GOI. Considerable time is lost in get- ting the approval. It is suggested that the states should organ- ize measurement of hydrological and meteorological data of all identified sites of hydroelectric projects through Central Water Commission or other dependable agencies. The data collected should be made available to the developers allowing for better assessment of river hydrology and reduced hydro- logical risk.
Project Allotment on the basis of premium
Allotment for projects above 100 MW is made on the basis of the highest bid received from the developers after short list- ing. The premium paid by the developers increases the tariff, making hydropower expensive. It is suggested that the pro- moters should be selected on the basis of their competence and experience and not alone on the basis of premium.
Upfront fee
The developers are charged an upfront fee of INR 5 lacs per MW by the state. This increases the cost of electricity generat- ed by Hydro power making implementation of Electricity Act
2003 difficult.
Land procurement and development Cost
The policy on land provision for hydropower differs from state to state. While in Uttaranchal the land is available at market price for project development, Uttar Pradesh govern- ment provides land at INR 100 per acre. This difference in land cost makes hydro power development very difficult in few states as compared to others. It is suggested that the land for project development should be acquired by the state and handed over to the project developer.
The state should provide for the cost of approach roads, reset- tlement and rehabilitation of the project affected people in- stead of loading the cost on the project.
Payment Security
The states with hydro potential are generally power surplus making hydropower power sale financially less lucrative. It is suggested that the State should guarantee to buy power from developers at the rates fixed by the Regulatory Commission. They should also be allowed to sell the power independently, if so desired by them.
Back loading the free power
Being capital intensive, the tariff in hydroelectric projects is high during initial years of project operation. If free power is back loaded, the tariff during the initial years will be reduced, thus making hydropower more competitive compared to oth- er sources of power.
IJSER © 2012
International Journal of Scientific & Engineering Research Volume 3, Issue 10, October-2012
ISSN 2229-5518
The total identified potential in HP is 20386.07 MW (as per hpseb.com on 22nd August 06). Out of this 6045.07 MW has been harnessed so far and 2720.5 MW is under execution. For Which DPR is ready for 3011.50 MW, projects for 3671.50 MW are Under Investigation and 4187.50 MW of schemes are yet to be investigated. The main issues related to Hydropower development in the state are as follows:
Purchase Rate of Power by State
In Himanchal Pradesh the purchase rate of power was fixed as INR 2.50 in 1997-98 for small hydro. Since then, the cost of steel, cement and labor has increased considerably. However, the purchase rate for hydropower has not been revised by the state. It should be revised at the earliest.
Local Area Development
In HP 1.5% of the project cost is realized from the developers for local area development. This unnecessarily increases the tariff. As stated above, the local area development should be paid from the revenue of free power received by the State.
Fishery Department Compensation
Compensation at the rate of INR 5 lac per MW and 1 lac per km of breeding area lost due to project is payable by the de- veloper. It is suggested that the developer should not be made liable for this.
Charges for Augmentation of Transmission System of HPSEB
It is understood that Himachal Pradesh State Electricity Board is going to charge INR 40 lac per MW from developers for augmentation of transmission system beyond interconnection point.
Utility-scale solar energy environmental considerations in- clude land disturbance/land use impacts; potential impacts to specially designated areas; impacts to soil, water and air re- sources; impacts to vegetation, wildlife, wildlife habitat, and sensitive species; visual, cultural, paleontological, socioeco- nomic, and environmental justice impacts, and potential im- pacts from hazardous materials.
Solar power facilities reduce the environmental impacts of combustion used in fossil fuel power generation, such as im- pacts from green house gases and other air pollution emis- sions. Unlike fossil fuel power generating facilities, solar facili- ties have very low air emissions of air pollutants such as sulfur dioxide, nitrogen oxides, carbon monoxide, volatile organic compounds, and the greenhouse gas carbon dioxide during operations. In addition to these benefits of solar development, construction and operation of solar facilities creates both direct and indirect employment and additional income in the regions
where the development occurs. However, there are also some adverse impacts associated with solar power facilities that must be considered in BLM's process of granting solar right- of-way authorizations and DOE's process of developing envi- ronmental guidance for solar facilities. Potential adverse im- pacts to various resources associated with the construction, operation, and decommissioning of solar power plants are briefly outlined below. These impacts and mitigation measures for solar facilities are addressed in detail in the Solar Energy Development Programmatic EIS.
4.1 Land Use Impact
All utility-scale solar energy facilities require relatively large areas for solar radiation collection when used to generate elec- tricity at utility-scale (defined for the Solar PEIS as facilities with a generation capacity of 20 MW or greater). Solar facili- ties may interfere with existing land uses, such as grazing, wild horse and burro management, military uses, and miner- als production. Solar facilities could impact the use of nearby specially designated areas such as wilderness areas, areas of critical environmental concern, or special recreation manage- ment areas. Proper decisions can help to avoid land disturb- ance and land use impacts.
Construction of solar facilities on large areas of land requires clearing and grading, and results in soil compaction, potential alteration of drainage channels, and increased runoff and ero- sion. Engineering methods can be used to mitigate these im- pacts.
Parabolic trough and central tower systems typically use con- ventional steam plants to generate electricity, which common- ly consume water for cooling. In arid settings, any increase in water demand can strain available water resources. Use of or spills of chemicals at solar facilities (for example, dust sup- pressants, dielectric fluids, herbicides) could result in contam- ination of surface or groundwater.
The construction and operation of solar facilities generates particulate matter, which can be a significant pollutant partic- ularly in any nearby areas classified as Class I under Preven- tion of Significant Deterioration regulations (such as national parks and wilderness areas).
The clearing and use of large areas of land for solar power facilities can adversely affect native vegetation and wildlife in many ways, including loss of habitat; interference with rainfall and drainage; or direct contact causing injury or death. The impacts are exacerbated when the species affected are classi- fied as sensitive, rare, or threatened and endangered.
IJSER © 2012
International Journal of Scientific & Engineering Research Volume 3, Issue 10, October-2012
ISSN 2229-5518
Because they are generally large facilities with numerous high- ly geometric and sometimes highly reflective surfaces, solar energy facilities may create visual impacts; however, being visible is not necessarily the same as being intrusive. Aesthetic issues are by their nature highly subjective. Proper siting deci- sions can help to avoid aesthetic impacts to the landscape.
Cultural and paleontological artifacts and cultural landscapes may be disturbed by solar facilities. Additionally, socioeco- nomic impacts (both positive and negative) may be associated with solar facilities. For example, solar energy development could provide new employment opportunities, but an influx of workers could disrupt public services. These impacts may be disproportionately experienced by minority or low-income populations, thus resulting in environmental justice issues.
Photovoltaic panels may contain hazardous materials, and although they are sealed under normal operating conditions, there is the potential for environmental contamination if they were damaged or improperly disposed upon decommission- ing. Concentrating solar power systems may employ materials such as oils or molten salts, hydraulic fluids, coolants, and lubricants, that may be hazardous and present spill risks. Proper planning and good maintenance practices can be used to minimize impacts from hazardous materials.
Concentrating Solar Power (CSP) systems could potentially cause interference with aircraft operations if reflected light beams become misdirected into aircraft pathways. Operation of solar facilities, and especially concentrating solar power facilities, involves high temperatures that may pose an envi- ronmental or safety risk. Like all electrical generating facilities, solar facilities produce electric and magnetic fields. Construc- tion and decommissioning of utility-scale solar energy facili- ties would involve a variety of possible impacts normally en- countered in construction/decommissioning of large-scale industrial facilities. If new electric transmission lines or related facilities were needed to service a new solar energy develop- ment, construction, operation, and decommissioning of the transmission facilities could also cause a variety of environ- mental impacts
Wind is the movement of air across the surface of the Earth, from areas of high pressure to areas of low pressure. The sur- face of the Earth is heated unevenly by the Sun, depending on factors such as the angle of incidence of the sun's rays at the surface (which differs with latitude and time of day) and whether the land is open or covered with vegetation. Also, large bodies of water, such as the oceans, heat up and cool down slower than the land. The heat energy absorbed at the Earth's surface is transferred to the air directly above it and, as warmer air is less dense than cooler air, it rises above the cool air to form areas of high pressure and thus pressure differen-
tials. The rotation of the Earth drags the atmosphere around with it causing turbulence. These effects combine to cause a constantly varying pattern of winds across the surface of the Earth
Wind energy is an intermittent resource Cannot func- tion as base-load capacity (although it maybe deserv- ing of some capacity credit in many interconnected grid settings)
Wind projects are not competitive with least cost al-
ternatives in most markets
The current tight global turbine supply market is pushing prices higher
Limited number of experienced sponsors
Inadequate regulatory frameworks
Large investment requirements – costly
Pricing regimes don’t always cover service provision
costs
Implicit or explicit subsidies needed
Absence of creditworthy off-takers and shortage of long term debt financing, even where tariff levels ap- pear attractive.
In a fully deregulated electricity market prevailing
electricity prices too low to allow wind power pro- jects to function effectively
Investor risk perceptions lead to high return require- ments, which may not fit with politically acceptable pricing policies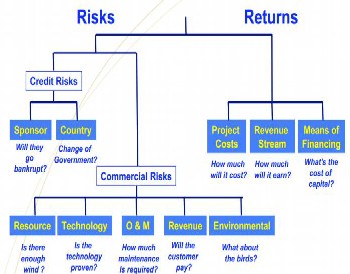
Figure.2
Common to other renewable options, geothermal energy faces market penetration barriers and obstacles such as:
lack of resource information
IJSER © 2012
International Journal of Scientific & Engineering Research Volume 3, Issue 10, October-2012
ISSN 2229-5518
perceived high cost
small base of experienced professionals and equipment
high upfront costs
geographic distance from population centers and trans- mission infrastructure
The largest single user of bio-energy is the domestic sector, followed by industries. Increased shortage of wood fuels has forced many users to shift to substantial use of agricultural residues. Bio energy users are faced with limited options of accessible and affordable fuels. A major constraint to effective planning and management in rural areas is the insufficiency of data and environmental information. The data are essential for the formulation of essential policies and strategies for local energy (bio energy) production and use. Government plan- ning institutions, both centralized and decentralized, often display a lack of interest in traditional fuels including bio en- ergy. the most direct effect of neglecting bio energy plan- ning have lead to severe scarcities and drudgery for weaker groups, over-exploitation of local resources. Energy plan for a region should include bio-energy plans and be linked to ar- ea-based planning and/or rural development planning. De- centralization allows close interaction between planning and implementation, whether in projects, programmes or policies at large. Experiences have shown that such interaction is vital for successful interventions which address local and site-specific issues like bio energy. The interventions in bio- energy sector could be supply-oriented(aiming at increas- ing, redistributing or substituting supply), or demand orient- ed (aiming at managing demand by conservation or other measures which enhances rational consumption), or both. Severity of the energy crisis (bio-energy) in several blocks of India demands for implementing area based micro-level integrated energy plan through least cost (and improved efficiency) mix of different sources of energy. Energy saving devices and alternate devices / technologies should be intro- duced, taking in to consideration the suitability and potential of the area. The land use pattern is to be analyzed to identify potential areas for energy plantations with the species ac- ceptable to the local people.
Recommendations in this regard are:
1. Include regional energy where relevant as one of the
key elements in the overall strategy for sustainable development. Integrate programmes for food, water, energy and social development.
2. Establish regional centers of excellence for renewable
energy, to provide training, technology support,
and resource databases appropriate to the regional needs.
3. Develop and implement regional demonstration pro-
grammes as showcases of the best elements of re- newable technologies.
4. Gather, review and publicize success stories involving renewable energy, to give realistic examples of what has been done and is possible.
I decided to try and write a research paper about Risk associ- ated with various power plants operating in India. I thank the Ministry of Environment and Forests, Government of India and Oriental University Indore for sustained support in our research endeavor.
[1] Batsstone, R., Smith, J.E., Wilson, D.C. (Eds.): The Safe Disposal of Hazardous Wastes - The Special Needs and Problems of Developing Countries, World Bank Technical Paper Number 93, Vol. I, II, III, Washington D.C., 1989.
[2] Tharun, G., Thanh, N.C., Bidwell, R. (Eds.): Environmental Manage- ment for Developing Countries, Vol. 2 (Waste and Water Pollution Control - Evaluation and Decision Making) and Vol. 3 (Environmen- tal Assessment and Management), Asian Institute of Technology Continuing Education Center Series, Bangkok 1983.
[3] Ramachandra, T.V. and Madhu M. Kumar., 2000. Landuse and land
cover analyses - Mapping and Monitoring, Conference: National Conference on Eco-friendly Technologies for Sustainable Devel- opment, 27-29, March 2000. Organized by PSG College of Arts and Science, Coimbatore.
[4] Pramod S.Dabrase and Ramachandra, T.V., 2000. Integrated Renew- able Energy System - Perspectives and Issues, Conference : Mil- lennium International Conference on Renewable Energy Technol- ogies, 9-11, Feb 2000, Chennai, Organized by IIT, Chennai.
[5] Aggarwal R.K., Chandel S.S., 2004 Review of Improved Cook stoves Programme in Western Himalayan State of India, Biomass and Bio- energy;27:131 – 144
IJSER © 2012