The research paper published by IJSER journal is about Respiratory Sound Analysis using MATLAB 1
ISSN 2229-5518
Respiratory Sound Analysis using MATLAB
Pankaj B. Gadge, Bipin D. Mokal, Uttam R. Bagal
Abstract — Bronchitis, pneumonia and many other pulmonary diseases cause respiratory disorders. The respiratory sound signal can be processed by using several techniques for diagnostic information. Computerized analysis of respiratory sound can facilitates the detection of changes in respiratory sound & storing the record of the measurement made from patient. This may help for diagnosis of respiratory disorders and treatment for a patient suffering from various respiratory diseases. Most of the respiratory sound energy is concentrate below 200 Hz. Respiratory sound frequencies overlaps heart sound frequencies. Suppression of heart sound was done by using frequency domain and adaptive signal filtering method. The respiratory sound signals are classified based on peak energy of signal in 40Hz – 160Hz.
Index Terms—Respiratory sound disorder, Heart sound signal, Respiratory sound signal
—————————— ——————————
Bronchitis, pneumonia and many other pulmonary diseases causes respiratory disorders. Characterization of the respiratory sound signal may help for diagnosis and monitoring of respiratory disorder. Diagnosis of respiratory disorder by auscultation is subjective process depend on the individuals hearing, experience and ability to differentiate between the sound pattern [1], [2], [3]. The limitation of it can be overcome by using digital signal processing techniques [3], [4]. The quantification and analysis of noise free respiratory sound signal may be possible for better diagnosis. An interference of cardiac sound signal into respiratory sound signal is called artifacts. Artifact suppression is needed for automatic diagnosis of respiratory disorder. Recording of respiratory sound signal and signal processing techniques are needed for automatic diagnosis of respiratory sound disorder. The artifact suppression was done by using frequency domain and adaptive filtering technique. The characterization of respiratory sound signal for diagnosis of respiratory disorder was done by spectral analysis and power density spectrum.
Respiratory sounds originate in the large airways where air velocity and turbulence induce vibrations in the airway walls. These vibrations are then transmitted through the lung tissue and thoracic wall to the surface where they may
————————————————
![]() Bipin D. Mokal is currently pursuing masters degree program in
Bipin D. Mokal is currently pursuing masters degree program in
Biomedical engineering in University of Mumbai, India, PH-9594964504. E-mail: bipin.mokal@gmail.com
![]() Uttam R. Bagal is currently working as an assistant professor in
Uttam R. Bagal is currently working as an assistant professor in
department of Biomedical Engineering, MGM’s College of Engineering and
Technology, University of Mumbai, India, PH-02227423403. E-mail:
be heard readily with the aid of a stethoscope. Respiratory sounds can be classified into two categories, either normal or abnormal (adventitious).
expiration with louder inspiration phase. Respiratory sounds are normally heard over the trachea and larynx [5].
generated in certain pathological conditions of airways or
lungs. Abnormal sounds may resemble a musical wind instrument. Identification of abnormal respiratory sound can be used for the diagnosis of respiratory disorders. Sometimes more than one abnormal sound is simultaneously present. Further diagnosis is needed for separation of these sounds [5].
The sound was picked up by using microphone. The transducer was placed on the throat region. The signal was amplified and fed to computer through audio input. Combination of Adaptive and frequency domain Filtering
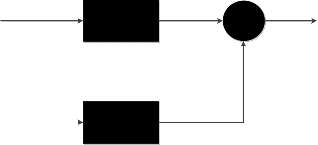
There are three main components of the combination method of adaptive and frequency domain filtering, the input or primary signal, the noise signal (heart signal & other muscle artifact) or reference signal and filtered output signal. In this technique the recorded signal during normal breathing is a primary input and the signal recorded with breath holding is a reference input signal. respiratory sound is considered as a primary signal analysis, partial overlap between respiratory signal and heart signal and provide the primary input for adaptive noise cancellation technique. The heart sound signal acquired from sensor is taken as reference input and contaminated respiratory signal is taken as primary input. The noise signal contain heart signal and other high frequency noise To remove the high frequency noise FIR filter is applied to both the signal. The
uttambagal@gmail.com
IJSER © 2012 http://www.ijser.org
The research paper published by IJSER journal is about Respiratory Sound Analysis using MATLAB 2
ISSN 2229-5518
output is the signal which is determined by subtracting reference signal from primary signal.
Symbols (b(n) = breath sounds, m(n) = heart sound and other high frequency noise, e(n) = de-noised breath sounds[5].
The recorded signal and band pass filtered signals and signal after applying combine method of adaptive and
Primary Input x(n)=b(n)+m(n)
Reference Input
m(n)
FIR Filter
FIR Filter
+ Output
e(n)
-
frequency domain filtering are shown in following figure.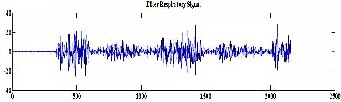
Fig 3.1 Combination method of adaptive and frequency domain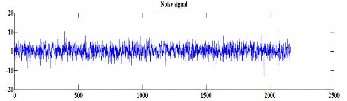
The above technique was implemented in MATLAB.
Recordings were taken from ten randomly selected subjects. Respiratory sound analysis instrument was used for recording the respiratory sound signal. A microphone based developed sensor used for recording, the sensor placed on the lower part of the throat for recording of signal with and without breath holding. Two signals was taken one signal with breathing (Respiratory signal) and other is signal without breathing (Noise signal)
The processing and analysis of respiratory sound signal is difficult due the interference of heart sound. Combination method of adaptive filtering & frequency domain filtering was used for removal of heart sound signal and other artifacts. The processing of signals was done in MATLAB Signals were recorded with and without breath holding consecutively. In MATLAB FFT was plotted to observe different frequency range of the signal according to that 40-
160 Hz selected. Then applied band pass filter for (40 -160) Hz to remove undesired frequency harmonics while saving the original information. After band pass filtered applied to the signal with breath holding remaining signal is heart signal. Then the signal recorded with breath holding was subtracted from the signal without breath holding. This way removal of sound artefacts is achieved.
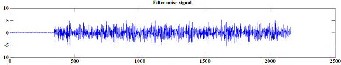
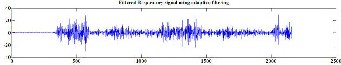
Power spectrum density verses frequencies of filtered respiratory sound signal was plotted. Peak of the waveform was found as the maximum value of power density. The corresponding frequency was calculated. Depending upon this frequency the abnormalities in respiratory sound signal decided.
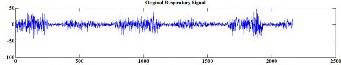
Fig 6.1 Typical Respiratory Sound Signal a. Original Respiratory Signal b. Filtered Respiratory Signal c. Noise Signal d. Filtered Noise Sig nal e. Filtered Respiratory Signal After Applied Combination Method of Adaptive and Frequency Domain Filtering
The noise suppressed respiratory sound signal from 10 different subjects certain frequency range for abnormalities in respiration sound signal was decided. For analysis of respiratory sound after adaptive and frequency domain filtering graph of power distribution over the frequency range was plotted. For normal subject the peak power was observed above 130 Hz. For fine crackles sound signal the maxima was observed in the range of 60-138 Hz. The maximum power was observed below 60 Hz for pleural sound.
IJSER © 2012 http://www.ijser.org
The research paper published by IJSER journal is about Respiratory Sound Analysis using MATLAB 3
ISSN 2229-5518
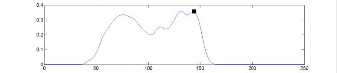
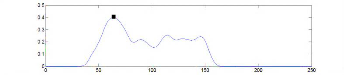
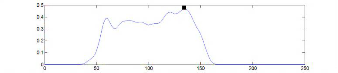
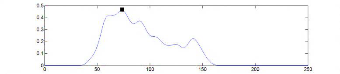
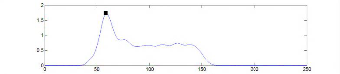
Fig 6.1 Power Distribution over the Range of Frequency (Subject 1) Fig 6.2 Power Distribution Over the Range of Frequency (Subject 2) Fig 6.3 Power Distribution over the Range of Frequency (Subject 3)
Fig 6.4 Power Distribution over the Range of Frequency (Subject 4)
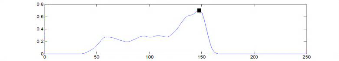
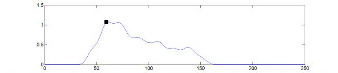
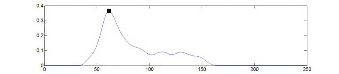
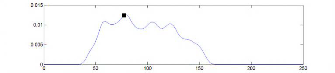
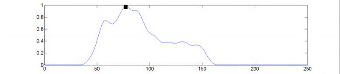
Fig 6.5 Power Distribution over the Range of Frequency (Subject 5) Fig 6.6 Power Distribution over the Range of Frequency (Subject 6) Fig 6.7 Power Distribution over the Range of Frequency (Subject 7) Fig 6.8 Power Distribution over the Range of Frequency (Subject 8)
Fig 6.9 Power Distribution over the Range of Frequency (Subject 9)
Fig 6.10 Power Distribution over the Range of Frequency (Subject 10)
The effective suppression of the heart sound signal was observed in combination method for noise filtering (Adaptive plus Frequency domain Filtering). After getting clear signal the power verses frequency plot is considered for respiratory sound analysis. From these graphs variations of relative frequency of maximum power was observed which is relative to the visual observations made from sound signal. Hence depending on position of maxima the respiratory sound is classified for indicating state of subject as normal or abnormal.
[1] A. R. A. Sovijarvi, J. Vanderschoot, and J. E. Earis, “Standardization of Computerized Respiratory Sound Analysis,” Eur Repair Rev, vol 10 (77), pp. 58, 2000.
[2] J.E. Earis, B. M. G. Cheetham, “Current Methods used for Computerized Respiratory Sound Analysis,” Eur Repair Rev; vol 10 (77), pp. 585-590, 2000.
[3] Z. M. K. Moussavi, “Respiratory Sound Analysis,” IEEE
Engineering in Medicine & Biology Magazine 0739-5175, 2007.
[4] Z. M. K. Moussavi, “Separating heart sound from lungs
sounds,” IEEE Engineering in Medicine & Biology Magazine,
2007.
[5] Z. M. K. Moussavi, “Fundamentals of Respiratory Sound
Analysis,” Morgan & Claypool, First Edition.
[6] W. F. Ganong, “Review of Medical Physiology (Seventeenth
Edition), New Jersey, Prentice Hall, 1995.
[7] Guyton & Hall, ”A textbook of Medical Physiology”, Tenth
Edition, printed in India at Gopsons Paper Ltd., Noida 201 301. [8] Johnson, L.R.,”Essential Medical Physiology (Second Edition).
Philadelphia, Lippincott Williams & Wilkins, 1998. [9] MedicineNet.com, article.htm.
[10] T.E. Ayoob Khan, Dr. P. Vijayakumar, ”Separating Heart sound from lung sound using LavView”, International Journal of Computer and Electrical Engineering, Vol. 2, No. 3, June, 2010
1793-8163.
[11] Rahman Jamal, Mike Cerna, John Hanks Designing Filters
Using the Digital Filter Design Toolkit.
[12] Emmanuel. C. Ifeachor, Barrie. W. Jervis, Digital Signal
Processing
[13] Edward P. Cunningham, Digital Filtering An Introduction, John Wiley & Sons, Inc.1995.
[14] Haykin S, Adaptive Filter Theory, 2nd Edition, United Stated of American: Prenticem Hall, Inc. 1991
[15] Krister Landernas, Implementation of Digital Filters Using Digital-Series Arithmetic’s, Department of electronics, Licentiate thesis No. 23, 2004
[16] http://www.dsptutor.freeuk.com/dfilt2.htm Accessed on 2008-
11-22
[17] http://www.intersil.com/data/AN/an9603.pdf Accessed on
IJSER © 2012 http://www.ijser.org
The research paper published by IJSER journal is about Respiratory Sound Analysis using MATLAB 4
ISSN 2229-5518
2008-11-21
[18] Nicholas John Loy, An Engineer’s Guide to FIR Digital Filters,
Prentice Hall, 1988
[19] Cedric Keip, Design of a Finite Impulse Response Filter Coefficients Computation tool using Evolutionary Strategies and Extension to Filter Bank Design, 2004
[20] Terrell, Trevor J. Introduction to Digital Filters. Second Edition,
London: Macmillan, 1980
[21] Thomas J. Cavicchi, John, Digital Signal Processing, Wiley & Sons, Inc 2000
[22] http://dualist.stanford.edu/~ee265/www
Sept2006/docs/digital_filters.pdf Accessed on 2008-11-22
IJSER © 2012 http://www.ijser.org