= ∕ (1)
where V = the measured voltage, I = the source current and
International Journal of Scientific & Engineering Research Volume 2, Issue 10, October-2011 1
ISSN 2229-5518
Resistivity Measurements of Conductors and
Semiconductors of Different Geometrical Shapes
Using Van der Pauw Technique
Amir J. Majid
Abstract— The resistivity of conductive and semi-conductive materials, are determined using an algorithmic computation approach of Van der Pauw technique. Different geometrical shapes, such as bulk, surface, bars, wafers, are used are implemented. The four-point method has been extended to multi-point measurement of surface and volume geometrical shapes, with consequently rearranging the equations derived in Van der Pauw technique. It is proposed that the multi-point measurements derivations can be applied using a multiplexer (MUX) and a de-multiplexer (de-MUX) digital circuits, and further on, embedded microprocessors and microcontrollers.
Index Terms— resistivity, Van der Pauw, conductors, semiconductors, shapes, geometries, equation derivations, digital, MUX, de-MUX
—————————— ——————————
o measure the resistivity of low resistance materials such as contacts, foils, bars rods and superconductors, very sensitive voltmeter with a current source or a micro- ohmmeter are required. The measurement is subject to addi- tional erroneous sources including lead resistance, non-ohmic
contacts, thermoelectric EMFs and device heating.
Semiconductors, on the other hand, have high resis-
tance and can induce significant noise sources such as Johnson
noise. It must also be noted that high resistance measurements
are subject to a loading errors from the meter input imped-
ance, as well as the impedance of the connecting cable. This requires extra efforts to reduce errors such as the use of very high input resistance meters as well as guarding cables and wires used.
Other noise sources are magnetic fields and ground loops arising from leakage currents due to insulated materials in the circuit measurement. In order to measure voltages from high-resistance sources accurately, the insulation leakage re- sistance of the test fixtures, test leads, and measuring voltme- ter must be several orders of magnitude higher than the The- venin equivalent resistance of the circuit under test, depend- ing on the accuracy and resolution required. This is due to the shunting effects of insulators, which makes detecting inferior insulation in test-ups difficult.
Temperature and humidity effects on noise and insulation can also generate erroneous measurements. High temperature can increase Johnson voltage noise, whereas high humidity can degrade the function of insulation
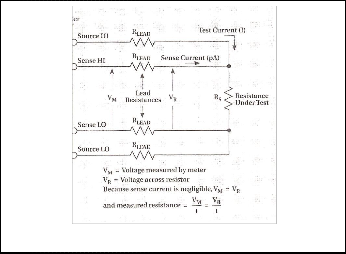
Due to the limitations of a typical two-wire method in which a test current is forced through the test leads and the resistance being measured, and the voltage drop across sample resis- tance is measured; the 4-wire (Kelvin) connection method [1], [2], [3], [4], is generally preferred, as depicted in Fig. 1. It can be seen that some small current may flow through the sense leads, but generally can be ignored for smaller length leads. The resistivity is calculated as follows:
= ∕ (1)
where V = the measured voltage, I = the source current and
k = sample material and shape constants.
————————————————
Amir J. Majid, College of Engineering, Ajman University of Science & Technology, Fujairah, The UAE
Fig. 1. The four-point method is used for rmeasuring resistance.
IJSER © 2011 http://www.ijser.org
International Journal of Scientific & Engineering Research Volume 2, Issue 10, October-2011 2
ISSN 2229-5518
(3a)
Van der Pauw technique [5], [6], implements the four-wire method to reduce thermoelectric EMFs effect. It is particularly useful for measuring very small samples because the dimen- sions of the sample and the spacing of the contacts are unim- portant. This technique uses four isolated contacts on the boundary of a flat, arbitrary shaped sample. A total of eight
Q and f are related as follows:
(3b)
(4)
measurements, are made around the sample, [7], as illustrated in Fig. 2.
It is noted that fA and fB =1 for perfect symmetry. It is as- sumed that if ρA and ρB are not within 10% of one another, the sample is not sufficiently uniform to determine resistivity ac- curately. Finally, the average of ρA and ρB is used.
.
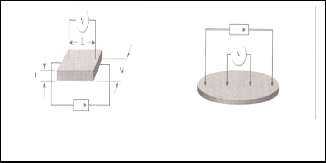
It has been assumed that to apply Van der Pauw technique, the sample must be flat, continuous, homogenous sample with the probe contacts placed uniformly on the sample perimeter, as depicted in Fig. 3. Different computations are carried on volume and surface resistivity measurements, as well as for conductors and semiconductors, [8], [9]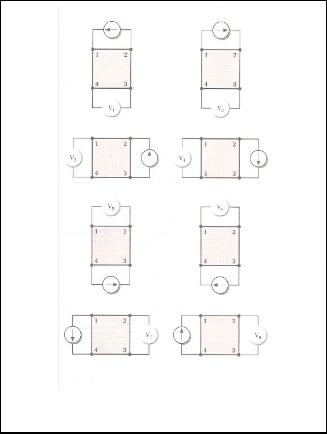
Fig. 3. Volume and surface resistivity measurements using four contacts
Fig. 2. Van der Pauw technique, derived for sample resistivity measurement.
Two values of resistivty; ρA and ρB, are then computed as fol- lows:
– (2a)
– (2b)
where: ρA and ρB are resistivities in ohm-cm
ts is the sample thickness in cm
V1-V8 represent the voltage measurements by the voltmeter
I is the current through the sample in amperes,
fA and fB are geometrical factors based on sample symmetry, and are related to the two resistance ratios
QA and QB as shown in the following equations
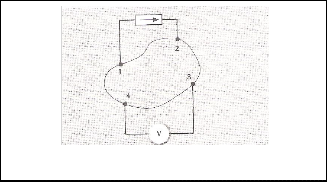
In this method four arbitrary points or contacts are applied on the sample, in which a constant current source across one pair of contacts is forced through the sample, and the voltage drop is measured on a second pair, as shown in Fig. 4. This is re- ferred as constant current method. It is also possible to apply constant voltage source on one pair and measure the current on another, which is termed as constant voltage method. The process is repeated 8 times in Van der Pauw technique in a special convection, to get an average resistivity value.
Fig. 4. Four contacts measurement of an arbitrary sample.
IJSER © 2011 http://www.ijser.org
International Journal of Scientific & Engineering Research Volume 2, Issue 10, October-2011 3
ISSN 2229-5518
Referring to (2), (3) & (4), it is apparent that V2 and V4 mea- surements are accumulated together for a certain shape con- stant fA, as if current source I was injected from contact points
1 and 3, whereas V1 and V3 measurements are taken with op- posite polarities to remove thermal EMFs effects. The same
justification is applied for V5, V6, V7 and V8 for another shape constant fB. By inspection, more-than-four contacts can be used with algorithmic computations based on the same method.
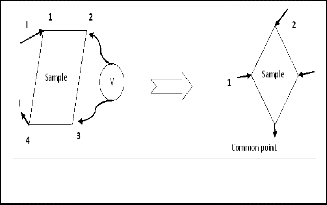
Instead of sourcing currents into alternate pairs of contacts, one contact is assumed to be a common point for all current sources injected through the other contacts. Voltage drops across contacts other than the injected current ones, are then measured, as illustrated in Fig. 5, in which the square- shaped sample is converted into a triangle-shaped one, with a common point contact.
lected, the more accurate calculations can be reached, due to the elimination of thermal voltage and temperature coeffi- cients, and also improving the averaging process. In general, there are N equations needed for N-point contacts measure- ment.
As an alternative approach; a number of four-point measurements are conducted on different contacts of an N- contact sample. The final resistivity value is the mathematical average of all computations carried on these measurements. As an example, consider Fig. 6, which shows the arrangements of sample resistivity measurements for different number of contacts. In Fig. 6a, currents are sourced through contacts 1, 2,
3, and 4 and voltage drops across other contacts are measured. So, it can be stated that with I injected in contact 1 and the common point, V23 and V34 are measured. Similarly, when I injected through contact 2, V34 and V41 are measured. Also, for I injected in 3, V12 and V24 are measured, and finally for I in- jected in 4, V12 and V23 are measured. This is in parallel with four-point measurement of Fig. 6b, where for example, with I injected in 1 and V23 is measured, and when injected in 2, V13 is measured, and also with I injected in 3, V12 is measured. Final- ly, current sources are reversed and the measurements are repeated.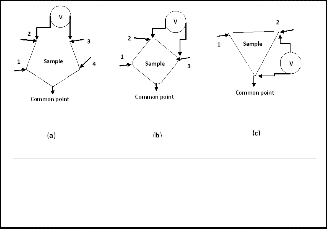
Fig. 5. Converting a four-point contacts sample arrangement to three-point contacts.
In this arrangement, there will be 6 measurements instead of 8, with three geometric factors fA, fB and fC. V2, V4 and V6 are measured as shown in the figure with V1, V3 and V5 are meas- ured with the corresponding currents injected in opposite di- rection. Van der Pauw equations will be modified as follows:
A = rrfA tS ( 2 − 1 ) ∕ 2 ln 2 (5a)
B = rrfB tS ( 4 − 3 ) ∕ 2 ln 2 (5b)
C = rrfC tS ( 6 − 5 ) ∕ 2 ln 2 (5c)
with Q values:
QA = ( 6 − 5 )/ ( 4 – 3 ) (6a) QB = ( 2 – 1 )/ ( 6 – 5 ) (6b) QC = ( 4 – 3)/ ( 1– 1 ) (6c)
The average resistivity value is (ρA + ρB + ρC)/3
This arrangement can be extended to more-than-four contacts, thus generalizing Van der Pauw technique to any number of contacts measurements. The more contacts are se-
Fig. 6. Different contact arrangement; five-point (a), four-point
(b), three-point (c), where current is injected through contacts 1,
2, 3 or 4 and voltage is measured across opposite contacts.
When three contacts are selected, as shown in Fig. 6c, the above equations formulation can still hold; with currents injected into one contact and a common point contact, and the voltage is measured across the third contact and the common. If only two contacts are selected, then the 2-point measure- ment [2], is implemented at the pair of contacts. It employs ohm’s law in applying current through the two points, and measuring the voltage drop across them, then averaging the computations with current direction reversed to cancel ther- mal induced EMFs.
The sample thickness determines whether volume or bulk resistivity measurement, or surface resistivity measurement is required. To differentiate between surface and bulk resistivity, the current has to pass either on the surface or the bulk of sample material, (Fig. 3). In the former, resistivity is calculated
IJSER © 2011 http://www.ijser.org
International Journal of Scientific & Engineering Research Volume 2, Issue 10, October-2011 4
ISSN 2229-5518
as:
= (KV /t) / (7)
where ρ = volume resistivity in ohm-cm
KV = test cell constant for volume resistivity based on cell geometry in cm2
t = sample thickness in cm
And in the latter, it is calculated as
(] = KS / (8)
where KS = test cell constant for surface resistivity based on
cell geometry.
Due to arbitrary shape geometry of a sample, Van der Pauw technique can be applied on each contact pair for the computa- tion of the different geometry factors, f’s; based on sample symmetry (f=1 for perfect symmetry). It is assumed that, for proper formulations, these geometric factors should be within
10% to each other, and therefore contacts positions are selected accordingly. As stated, the more contacts points selected for measurement, the more accurate is the calculation.
For uniform shape geometries, the geometry factor ρ used in Van der Pauw method is the same for any contacts measure- ment, and so any two pairs of contacts can be used for the computation, and accordingly, only one set of equations is used as
= (rrftS ⁄ln 2) ∕ (9)
As an alternative approach for the calculation of bulk or vo- lume resistivity of an arbitrary three-dimensional shape object, the sample can be sliced into a number of equally spaced shapes, each having a uniform geometry factor ρ, in which (9) is applied. Implementation of any number-of-contacts compu- tation algorithms, whether four or more, may be applied on each slice, and then mathematically averaged. Each differen- tial element is treated as a separate geometry with equal uni- form resistivity. It is tobe noted that for this arrangement, any point contact is also sliced in the same way.
One application of this treatment, is earth resistivity measurement, in whicht the resistivity of bulk earth volume can be computed by considering it as a uniform surface with measurements applied on any location contacts pairs. The process can be applied on nearby contacts at different dis- tances, and then averaging all computations for a final result.
It can be noticed that computerized calculations are needed for general shape geometries, due to numerous computations ap- plied. With the wide usage of embedded microcomputers and microcontrollers, it is more efficient to employ more genera- lized measurement techniques.
Random distribution of contact pairs are located on the periphery of any generalized shape geometry, where con- stant current sources are applied and voltage drops are meas- ured. Due to the elaborated measuring process, a digital form of measurements is needed.
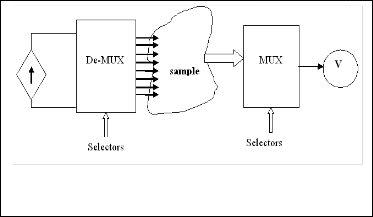
In this technique [10], [11], [12], the analog current source is selected and de-multiplexed to 2N contact points for sourcing currents, using 1-2N De-Multiplexer (de-MUX). N selectors are used for the selections. The corresponding voltages, in general, measured at 2M digital contact points, are consequently se- lected to one value with the help of 2M-1 Multiplexer (MUX), and M selectors, as depicted in Fig. 7. Normaly N=M.
Fig. 7. The use of multiplexers and de-multiplexers in multi-point contacts measurements is implemented for digitized computations.
As an example, 1-8 de-MUX is used with 3 selectors to direct the sourced current to one of the 8 point contacts, and the vol- tage at any other point contact is selected with a normaly 8-1
MUX and 3 selectors.
With the use of embedded computers [13], such as microcon- trollers, the functions of MUX and de-MUX, for multi-point measurement technique, can be conducted with ease. All re- quired calculations are then computed in the embedded pro- cessor with the help of a source program written in Basic, C or Assembly. Figure 8 depicts the use of one or more ports of microcontroller for the calculation of resistivity of any general shape geometry
IJSER © 2011 http://www.ijser.org
International Journal of Scientific & Engineering Research Volume 2, Issue 10, October-2011 5
ISSN 2229-5518
Currents are sourced from one outlet port; port A, and then redirected to one point contact using a 1-8 de-MUX, and the voltage at any other point contact is selected with a 8-1 MUX. The voltage is converted to a digital value with an analog-to- digital (ADC), before inputed in the inlet port; port B. All computations are carried out in the source program efficiently. The selectors, themselves, are outputted from the microcon- troller ports. It is noticesd that only one port can be used for the measurements through the source program.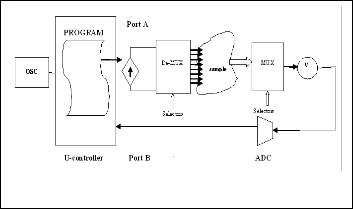
The procedure can be repeated and the resistivity result av- eraged for computation improvement, using the microcontrol- ler timer or oscillator.
Fig. 8. Microcontroller implementation of resistivity measurement.
[1] RA. Witte, Electronic Test Instruments (Analog and Digital Measurements); PP.
70-72, Prentice Hall, 2nd Edition, 2202
[2] DA. Bell, Electronic Instrumentation and Measurements, PP. 163-184, DHI, 2nd
Edition, 1997
[3] “Two-point and Four-point Method for Measuring Small Resistances”,
http://www.sciencebuddies.org/science-fair- projects/project_ideas/Elec_p025.shtml?from=Home
[4] “Four-technical Sensing”, http://en.wikipedia.org/wiki/Four-terminal- sensing
[5] M.S. Daluz, “The Van der Pauw Method of Measurements in High-TC Superconductors”, Materials Science-Polans, Vol. 27, No. 2, 2009
[6] “Van der Pauw Methos”,
http://en.wikipedia.org/wiki/Van_der_Pauw_method
[7] Keithley; Low Level Measurements, PP. 4.18-4.49 & 3.16-3.24, Keithley 5th
Edition,
[8] M..S. Da Luz, “The Van der Pauw Method of Measurements”, Materials
Science – Poland, Vol. 27, No. 2, 2009
[9] P.G. Muzykov, “A Method of Measuring Specific Resistivity and Hall Ef-
fects of Discs of Arbitrary Shape”, Journal of Electronic Materials: High re-
sistivity measurement of Sic wafers using different techniques
[10] JJ. Carr, Elements of Electronic Instrumentation and Measurements, PP.142-148
& 571-576 & 392-401, Prentice Hall, 3rd Edition, 1996
[11] A. Majid, “MEMS AD/DA Converters”, ICM2006 18th international confe-
rence on microelectronics, 16-19 December 2006, KFUPM, Dhahran, KSA [12] A. Majid, “Electrostatic and Electromagnetic Fields Actuators for MEMS
AD/DA Convertors”; Arabian Journal for Science and Engineering, KSA,
May 2007.
[13] A. Majid, “An Innovative Method of Measuring Semiconductors Resistivity
Using Van der Pauw Technique”, IJSER, submitted for publication.
The Van dr Pauw technique for bulk and surface resistivity measurement has been expanded for different geometric shapes, such as arbitrary 3-D shape, both for conductors and high resistance material. Computational algorithms are gene- ralized for any number of contacts measurements, such as more-than-four and less-than-four point contacts. The more points contacts used, the more accurate is the computation for an arbitrary shaped geometry. This procedure is therefore suitable for larger samples applications such as earth resistivi- ty measurement.
1-2N de-multiplexer and 2N-1 multiplexer are used to practically implement for this technique; for example 1-8 de- MUX and 8-1 MUX. Embedded computers, such as microcon- trollers, can simplify the measurements procedure by using input and output ports, controlled by a source program writ- ten in Basic, C or Assembly.
IJSER © 2011 http://www.ijser.org