International Journal of Scientific & Engineering Research, Volume 5, Issue ŝ, Ju¢-2014
ISSN 2229-5518
Requirements Definitions Of Real-Time System Using The BEHAVIORAL PATTERNS ANALYSIS (BPA) Approach: Intelligent Transportation System
Dr. Assem El-Ansary, CEO Emergent Technologies USA, Inc. assem_elansary@yahoo.com
170
Abstract—This paper illustrates the event-oriented Behavioral Pattern Analysis (BPA) modeling approach in developing an Intelligent Transportation System (ITS).
The Event defined in BPA is a real-life conceptual entity that is unrelated to any implementation.
The major contributions of this research are:
The Behavioral Pattern Analysis (BPA) modeling methodology. Validation of the hypothesis that the Behavioral Pattern Analysis
(BPA) modeling methodology is a more effective alternative to Use Case Analysis (UCA) in modeling the functional requirements of Human-Machine Safety-Critical Real-time Systems.
The development of an interactive software tool (DECISION), which is based on a combination of the Analytic Hierarchy Process (AHP) and the ELECTRE Multi-Criteria Decision Making (MCDM) methods. The DECISION software tool was used to process the assessment results of the case studies.
Index Terms—Analysis, Intelligent Transportation System, modeling methodology, software modeling, event-oriented, behavioral pattern, use cases
xperience reports problems with Use Cases such as
[1] lack of a formal specification, lack of atomicity
which has made the measurement of a project’s task
complicated, and a problem with the phrase use case
itself.
A major problem in the use case approach is its tendency to focus on the solution rather than the problem. Jacobson defined use case as ‚a behaviorally related sequence of transactions in a dialogue with the system‛
[2]. The processing of transactions, or operations, or use cases is what the machine does. It is part of the solution, not part of the problem [3].
The concluding statement of the ‚Question Time! About Use Cases‛ Panel of the OOPSLA’98 Conference by Ian Graham [4] was ‚There is a need for another modeling methodology with a sound theoretical basis and a precise definition.‛ This need is what this research problem area is about.
In addition to the problems with the use cases [3][4]
that were described briefly above, several additional problems were identified during this research [5], [6]. The following is a discussion of these problems:
The types of interactions are: interactions among users, interactions between users and the system, and interactions among the different components of the system. Yet, use cases describe only the users’ interaction with the system.
Using natural language in use cases description, with the absence of any semantic structure such as alternation or repetition, increases the risks of ambiguity, incompleteness, and inconsistency.
In conclusion, if the analyst misinterpreted or neglected some structural or behavioral aspects, the resulting conceptual model will not be a good representation or understanding of the real world. The resulting software solution system built from the model may not demonstrate the correct behavior or may ungracefully terminate. The end result might be the loss of opportunities in using business systems, serious damages in embedded systems, or the loss of lives in using a safety-critical system.
In the BPA modeling methodology, the BPA Behavioral Pattern, which is the template that one uses to model and describe an event, takes the place of the Use Case in the UML Use Case View. The BPA Behavioral Patterns are temporally ordered according to the sequence of the real world events.
2 ILLUSTRATING BPA THROUGH THE INTELLIGENT TRANSPORTATION SYSTEM (ITS)
Intelligent Transportation Systems (ITS) [7] is the application of computer, electronics, and communication technologies and management strategies in an integrated manner to provide traveler information to increase the
IJSER © 2014
International Journal of Scientific & Engineering Research, Volume 5, Issue ŝǰȱ ¢ȬŘŖŗŚ
ISSN 2229-5518
171
safety and efficiency of the road transportation systems.
This paper mainly describes ITS user services, ITS
architecture and ITS planning. The various user services offered by ITS have been divided in eight groups have been briefly described. The ITS architecture which provides a common framework for planning, defining, and integrating intelligent transportation systems is briefly described emphasizing logical and physical architecture.
As reported by Commission for Global Road
Safety(June 2006) , the global road deaths were between
750,000 to 880,000 in the year 1999 and estimated about
1.25 million deaths per year and the toll is increasing
further.
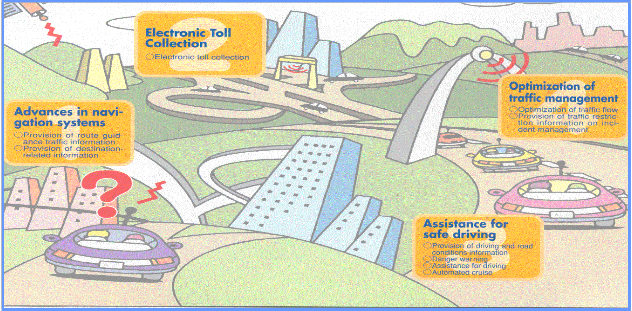
ITS improves transportation safety and mobility and enhances global connectivity by means of the integration of advanced communications technologies into the transportation infrastructure and in vehicles. Intelligent transportation systems encompass a broad range of wireless and wire line communication based information and electronics technologies to better manage traffic and maximize the utilization of the existing transportation infrastructure. It improves driving experience, safety and capacity of road systems, reduces risks in transportation, relieves traffic congestion, improves transportation efficiency and reduces pollution.
Fig. 1 ITS many applications in highway transport
Some of the user services offered by ITS are shown in Fig. 2. The eight groups are described as follows:
1. Travel and traffic management
2. Public transportation operations
3. Electronic payment
4. Commercial vehicle operations
5. Advance vehicle control and safety systems
6. Emergency management
7. Information management
8. Maintenance and construction management.
Figure 2. ITS user services
The main objective of this group of services is to use real time information on the status of the transportation system to improve its efficiency and productivity and to mitigate the adverse environmental impacts of the system. This group of user service is further divided in 9
IJSER © 2014
International Journal of Scientific & Engineering Research, Volume 5, Issue 6, June-2014
ISSN 2229-5518
172
integrated sharing user services:
i) Pre-trip information:
This user service provides information to the travelers about the transportation system before they begin their trips so that they can make more informed decisions. The travelers can access this information through computer or telephone systems at home or work and at major public places. The information include real time flow condition, real incidents and suggested alternate routes, scheduled road construction and maintenance tasks, transit routes, schedules, fares, transfers, and parking facilities.
ii) En-route driver information:
This user service provides travel related information to the travelers en route after they start their trips through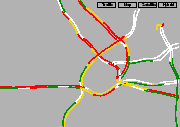
variable message signs (VMS), car radio, or portable communication devices. Fig. 2 shows the various congested and non-congested routes shown on display screen. VMS indicating different routes and travel time is shown in Fig. 3.
Figure 3. Showing congested routes

Figure 4. VMS showing routes and travel times
iii) Route guidance:
This service provides information to the travellers with
a suggested route to reach a specified destination, along with simple instructions on upcoming turns and other maneuvers. The benefits of this service are reduced delay and drivers stress levels particularly in an unfamiliar area.
iv) Traveler Services Information
This service provides a business directory of information on travel-related services and facilities like
the location, operating hours, and availability of food, lodging, parking, auto repair, hospitals, gas stations and police facilities. This also makes reservations for many
of these traveler services.
v) Traffic Control
This service collects the real time data from the transportation system, and uses it to determine the optimum assignment of right-of-way to vehicles and pedestrians. This helps in improving the flow of traffic by giving preference to transit and other high occupancy vehicles or by adjusting the signal timing to current traffic conditions.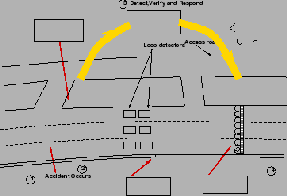
vi) Incident Management
Figure 5. Incident management
This service aims to improve the incident management and response capabilities of transportation and public safety officials, the towing and recovery industry, and others involved in incident response. Advanced sensors (close circuit TV cameras), data processors and communication technologies are used to identify incidents quickly and. Fig. 5 shows the occurrence of incident and its detection by the center
and decision implemented responding to the incident on a highway pertaining to incident management.
vii) Travel Demand Management
This user service develop and implement strategies to reduce the number of single occupancy vehicles while encouraging the use of high occupancy vehicles and the use of more efficient travel mode.
viii) Emissions Testing and Mitigation
The main objective of this service is to monitor and implement strategies to divert traffic away from
sensitive air quality areas. This also used to identify vehicles emitting pollutants exceeding the standard values and to inform drivers to enable them to take corrective action.
ix) Highway Rail Intersection
This service is to provide improved control of highway and train traffic to avoid or decrease the
IJSER © 2014
International Journal of Scientific & Engineering Research, Volume 5, Issue ŝǰȱ ¢ȬŘŖŗŚ
ISSN 2229-5518
173
severity of collisions between trains and vehicles at highway-rail intersections.
This group of service is concerned with improving the public transportation systems and encouraging their use.
i) Public Transportation Management
This user service collects data through advanced communications and information systems to improve the operations of vehicles and facilities and to automate the planning and management functions of public transit systems. This offers three tasks:
To monitor the location of transit vehicles, by identifying deviations from the schedule.
To maintain transportation schedules and to assure transfer connections.
To enhance security of transit personnel by providing access management of transit vehicles.
ii) En-Route Transit Information
This service is intended to provide information on expected arrival times of the vehicles, transfers, and connections to travellers after they begin their trips to modify their trips underway.
iii) Personalized Public Transit
The aim of this service is to offer public transport facility to travellers by assigning or scheduling vehicles by
1. diverting flexibly routed transit vehicles.
2. assigning privately operated vehicles on demand which include small buses, taxicabs, or other small, shared-ride vehicles.
Under this service, travellers provide information of their trip origin and destination to service station.
iv) Public Travel Security
This user service creates a secure environment for public transportation operators and support staff and monitors the environment in transit facilities, transit stations, parking lots, bus stops and on-board transit vehicles
and generates alarms when necessary.
This user service allows travellers to pay for transportation services with a common electronic payment medium for different transportation modes and functions. Toll collection, transit fare payment, and parking payment are linked through a multi-modal multi-use electronic system.
The aim is to improve the efficiency and safety of commercial vehicle operations. This involves following services:
i) Commercial Vehicle Electronic Clearance
This service allows enforcement personnel to electronically check safety status, vehicle's credentials, and size and weight data for the commercial vehicles before they reach an inspection site.
ii) Automated Roadside Safety Inspection
At inspection station the safety requirements are checked. Advanced equipment is used to check brake, steering and suspension performance and also the driver's performance pertaining to driver alertness and fitness for duty.
iii) On-board Safety Monitoring
This service monitors the driver, vehicle, on-board sensors and cargo and notify the driver, carrier, and, also the enforcement personnel, if an unsafe situation arises during operation of the vehicle.
iv) Commercial Vehicle Administrative Processes
This service allows carriers to purchase credentials such as fuel use taxes, trip permits, overweight permit, or hazardous material permits automatically.
v) Hazardous Materials Incident Response
This user service provides immediate information regarding the types and quantities of hazardous materials present at incident location to the emergency personnel so that timely action could be taken in case of accidents.
vi) Freight Mobility
This service provides information to the drivers, dispatchers, and transportation providers, enabling carriers to take advantage of real-time traffic information, as well as vehicle and load location information, to increase productivity.
This user service aims to improve the safety of the transportation system by supplementing drivers' abilities to maintain vigilance and control of the vehicle by enhancing the crash avoidance capabilities of vehicles. Following user services are included in this group:
i) Longitudinal Collision Avoidance
This is achieved by implementing rear-end collision warning and control, Adaptive Cruise Control (ACC), head-on collision warning and control, and backing collision warning to the drivers.
IJSER © 2014
International Journal of Scientific & Engineering Research, Volume 5, Issue ŝǰȱ ¢ȬŘŖŗŚ
ISSN 2229-5518
174
ii) Lateral Collision Avoidance
This service provides to the drivers the lane change/blind spot situation display, collision warning control and lane departure warning and control.
iii) Intersection Collision Avoidance
The system tracks the position of vehicles within the intersection area.
iv) Vision Enhancement for Crash Avoidance
Reduce crashes due to lack of visibility by in vehicle sensors capable of capturing an image of driving environment.
v) Safety Readiness
Provide drivers with warnings regarding their own
driving performance, the condition of the vehicle, and the condition of the roadway as sensed from the vehicle.
vi) Pre-Crash Restraint Deployment
This service helps in reducing the number and severity of injuries caused by vehicle collisions by anticipating an imminent collision and by activating passenger safety systems prior to the actual impact.
vii) Automated Vehicle Operations (AVO)
This service provides a fully automated vehicle-
highway system in which instrumented vehicles operate on instrumented roadways without operator intervention.
This service has two functions:
i) Emergency notification and personal security – This is to provide travellers the ability to notify appropriate emergency response personnel regarding the need for assistance due to emergency or non- emergency situations on the occurrence of an accident.
ii) Emergency vehicle management –
This user service is to reduce the time from the receipt of an emergency notification to the arrival of the
emergency vehicles at incident location thereby reducing the severity of accident injuries.
This service is aimed to provide the functionality needed to store and archive the huge amounts of data being collected on a continuous basis by different ITS technologies.
This user service is aimed to provide the functionality needed for managing the fleets of maintenance vehicles, managing the roadway with regards to construction and maintenance and safe roadway operations.
The ITS Architecture provides a common framework for planning, defining, and integrating intelligent transportation systems. It specifies how the different ITS components would interact with each other to help solving transportation problems. The ITS architecture should be common and of specified standards throughout the state or region so that it can address solution to several problems while interacting with various agencies.
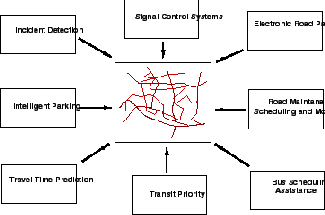
The logical architecture defines a set of functions (or processes) and information flows (or data flows) that respond to the user service requirements. It describes
the lower end interaction of different components of ITS. Processes and data flows are grouped to form a particular functions. These are represented graphically by data flow diagrams (DFDs). Fig. 6 shows the interaction of Manage Traffic process with other processes. Each process is broken down into more sub processes. The sub process is further broken into sub process which are called process specifications (P-specs) lowest level. These p specs are required to be performed to fulfill user services requirements.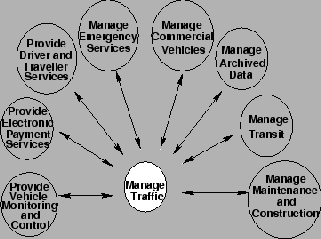
Figure 6. High level ITS logical architecture
The functions from logical architecture that serve the same need are grouped into sub systems. With these subsystems a physical entity is developed to deliver functions. The data flow of logical architecture are also
IJSER © 2014
International Journal of Scientific & Engineering Research, Volume 5, Issue ŝǰȱ ¢ȬŘŖŗŚ
ISSN 2229-5518
175
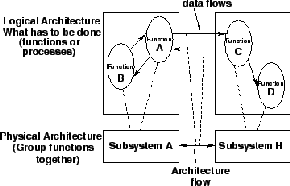
combined to define interface between subsystems. Fig. 7 shows the functions A and B of logical architecture assigned to subsystem A in physical architecture. Both the architecture forms the core of ITS.
Figure 7 Assigning function from logical to the physical architecture
The subsystem represent aggregation of functions that serve the same transportation need and closely correspond to physical elements of transportation management system.
i) Equipment packages
In order to provide more deployment oriented perspective to the ITS architecture an equipment package is developed. In this similar functions of a particular subsystem are grouped together and implemented by a package of hardware and software facilities.
ii) Market package
The market package defines a set of equipment
packages that are required to work together to provide a
given transportation service. Most market packages are made up of equipment packages from two or more subsystems. These are designed to address specific transportation problems and needs. Fig. 8 shows surface street control market package.
traffic management. The various signal control systems dynamically adjusted control plans and strategies based on current traffic conditions and priority requests.
Transportation planning helps in shaping a well balanced transportation system that can meet future demands. Transportation planning is an iterative process which include problem identification, solution generation, analysis, evaluation and implementation. This can be integrated with ITS using computers, communication systems and software. As planning is normally made for long period, installing ITS facilities needs to be updated and one should ensure that the equipment and technologies are compatible for future improvement and expansion. The steps in traditional transportation planning are as follows:
1. Establish goals and objectives
2. Inventory existing conditions
3. Analyze existing conditions
4. Long range/ short range element
5. Forecast land use, population/employment
6. Forecast future travel/trips
7. Develop and evaluate alternative transportation plans
8. Prepare recommended plans and programs
ITS transportation planning process differs from the traditional transportation planning process. ITS has the unique capability to integrate different modes of transportation such as public auto, transit, and infra- structural elements through communications and control.
The following is an outline of the BPA functional requirements development procedure (Fig. 9 and Fig
10):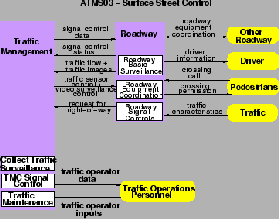
Figure 8. Surface street control market package
This package provide the central control and monitoring equipment, communication links and the signal control equipment that support local street control or arterial
1. Identify the problem at the highest level of abstraction (e.g. The Mission Statement and Operating Requirements).
2. Identify the scope of the requirements
(problem) from the Originating Requirements.
3. Analyze the Originating Requirements to identify the Critical Constraints (e.g. Safety)
and/or the Utility Requirements.
4. Decompose the scoped problem (from step2) into Main Events based on the Mission and Operating Requirements (Step I).
5. Using the identified Main Events, draw the High Level Event Hierarchy Diagram which is constructed in several levels whose top level includes the highest main event (Fig. 11).
IJSER © 2014
International Journal of Scientific & Engineering Research, Volume 5, Issue ŝǰȱ ¢ȬŘŖŗŚ
ISSN 2229-5518
176
6. Decompose these identified Main Events into smaller and simpler events represented as Episodes (Composite Events) with clear boundaries1.
An Episode Boundary at this stage may be marked with Location / Loci of Control
and Effect.
7. Add additional levels to the Event Hierarchy
Diagram (Event Hierarchy Sub-Diagrams) Fig.
12, 13, 14, 15, and 16. For complex problems, it is often helpful to extract these sub-diagrams and analyze them. Detailed level event hierarchy diagrams are drawn as necessary.
Decomposition Heuristics at this stage is ‘ One Agent and One Location’
8. For each identified main event (from step 4)
Thread Diagrams for identified critical events as necessary.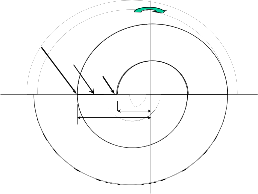
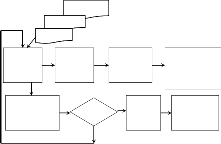
The figure below illustrates the BPA iterative and incremental development process. The figure shows the start with the Originating Requirement and Steps 1 to 3, then Steps 4 to 7, then Step 8, then Refine and come-up with the Derived Requirements which covers any Missing Requirements as explained in Steps 9 and 10. After that we re-iterate as explained in Steps 11 and 12.
Begin Refinement
draw an Event Thread Diagram which
represents the events’ sequence (Fig. 17)
Missing
Requirements
Start
Step 11 Step 12
Starting with the Main Events, as initial composite events, recursively decompose
Steps
Steps
1-3
Originating
Requirements
Steps
4-7
Step 8
the composite events into Basic Events
The Event Decomposition Heuristics at this stage is ‘ One Agent, One Location, One Motion Direction, and One Time Interval’.
Group Basic Events by their Location / Loci of Control and Effect. Draw a frame box around these Basic Events
9. Refine and transform the above Basic Events into their corresponding BPA Behavioral Patterns which describes the which, who, when, and where of each of the basic events (Fig. 18)
10. Using the Event Thread Diagrams from step 8, draw the Temporal/Causal Constraint Diagrams by adding the temporal constraints (time order as illustrated in Fig. 19 and Fig 20) alongside the associations and identifying the enable/causal relationships (Enable is what makes it ready, and Causal means making something happen) in each corresponding Event Thread Diagram (Fig. 21).
11. Using the Critical Constraints (e.g. Safety), identify the critical events, identify all possible ways of each critical event’s failure, and draw the Critical Event Analysis Diagram (Fig. 22).
12. Using the BPA Event Patterns and the Critical Event Analysis Diagrams, identify any missing requirements that are necessary to satisfy the critical constraints. One develops a Derived Requirements document and get users
approval on this document.
13. Using the Missing Requirements (from step
12), refine the Event Hierarchy Diagram (from step 6), the Thread Diagrams (from step 8), and the Temporal Constraint Diagram (from step
10) as necessary. Draw additional Event
9-10
Derived
Requirements
Fig. 9 The BPA Modeling Process
14. Using the BPA Behavioral Patterns (from step
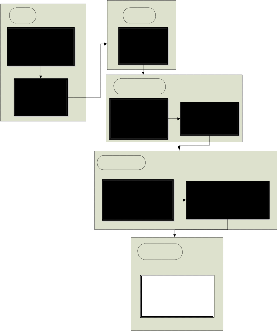
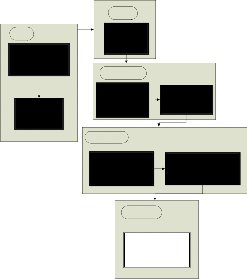
9), identify the candidate Classes from the Event Roles (Participants) and Instrument. Draw the Class Diagram (Fig.10).
15. To illustrate the relationship between Events and States, optionally, using the BPA Behavioral Patterns, draw the Event/State History Chart (Optional – not shown) that includes the States before and after each Event for each identified Class whose instance is a participant in that Event.
The above procedure illustrates the BPA functional requirements development procedure. Fig. 9 depicts the flow of the modeling activities (Steps 1 to 14) for the BPA procedure.
IJSER © 2014
International Journal of Scientific & Engineering Research, Volume 5, Issue ŝǰȱ ¢ȬŘŖŗŚ
ISSN 2229-5518
177
Event Hierarchy Diagram Steps 4,5,6
Step 1 Mission
Step 2 Originating
Requirements
Step 3 Critical
Constraints
Event Thread Diagram Step 7
BPA Behavioral Pattern Step 8
Temporal/Causal Constraints Event Thread Diagram
Step 9
Event Hierarchy (Fig. 10) is used to model the events at different levels of abstraction (event decomposition). A general problem with decomposition is when to stop the decomposition. The decomposition heuristic used in
an Event Hierarchy Diagram (EHD) is one agent and
Critical Event Analysis Diagram Step 10
Refine diagrams Step 12
Missing Req’ts? Step 11
Yes
No Class Diagram Step 13
Event / State History Chart
Step 14
one location. Using this heuristic, the leaf events in an Event Hierarchy are usually Simple Sequence Events. In other words, a leaf event is usually a set of Basic Events (atomic events) sequenced into episode1 . The
Fig. 10 Requirements Development Procedure
Maintain Intelligent Transportation

episode is marked with a location boundary. The following is the ITS detailed Event Hierarchy Diagram:
Improve Commercial Vehicle Operations
Manage Travel and Traffic
Offer Electronic
Payment
Advance Vehicle Control and Safety Systems
Manage
Information
Enforce Commercial Vehicle Electronic Clearance
Offer Automated Roadside Safety Inspection
Provide On-board
Safety Monitoring
Enable Freight
Mobility
Offer Commercial Vehicle Administrative Processes
Improve Public Transportation Operations
Improve
Commercial Vehicle Operations
Manage Emergency Services
Manage Maintenance and Constrution

Fig. 11 Event Hierarchy – ITS

Manage Travel and Traffic
Fig. 14 Event Hierarchy – ITS – Improve Commercial Vehicle
Operations
Provide Pre-trip
Information
Provide Route
Guidance
Control Traffic
Manage Travel
Demand
Control Highway
Rail Intersection
Improve Advanced Vehicle Control and Safety System
Provide En-route driver information
Provide Traveler
Services Information
Manage Incidents
Test Emission and
Mitigation
Fig. 12 Event Hierarchy – ITS Manage Travel and Traffic
Longitudinal Collision
Avoidance
Intersection
Collision Avoidance
Offer Safety
Readiness
Manage Public
Transportation
Lateral Collision
Avoidance
Vision Enhancement for Crash Avoidance
Provide Pre-Crash
Restraint
Improve Public
Transportation
Operations
En-Route Transit
Information
Offer Personalized Public Transit
Provide Public Travel
Security
Deployment
Fig. 13 Event Hierarchy – ITS - Manage Public Transportation

Fig. 16 Event Hierarchy – ITS – Improve Advanced Vehicle
Control and Safety System
Manage Emergency
Provide Emergency Notification and Personal Security
Offer Emergency
Vehicle Management
In BPA, as per step 8, an Event Thread Diagram (ETD – Fig. 16) is drawn for each main event, and optionally drawn for any other event, subordinate to main event, depending on its complexity or its critical nature.
Fig. 15 Event Hierarchy – ITS – Manage Emergency
Using the identified main events, the high level EHD diagram (or the first level in a detailed EHD diagram) is drawn. Each main event is then decomposed further until one arrives at leaf events, each of which has one location or one locus of effect and control and one agent. In order to model the sequence of events (and show the location / loci of control and effect view, or the temporal
/ causal constraints), one uses the event thread diagrams as shown in the next subsections.
A Basic Event is defined as an event that cannot be decomposed into another set of events (atomic event). The heuristic used in decomposing is one agent, one location, one time interval, and one motion direction if the event involves any motion. The ETD, which one draws for an event, shows the sequence of the basic events of that event.
IJSER © 2014
International Journal of Scientific & Engineering Research, Volume 5, Issue ŝǰȱ ¢ȬŘŖŗŚ
ISSN 2229-5518
178
Road Toll Booth
Offer
c1: Prepared c2:
Effect
Manage Travel and
Traffic
Electronic
Payment
f1: Provided f1:
Improve Public Transportation Operations
Commercial
Vehicle
Improve Commercial Vehicle Operations
Transportation
Center
Manage Emergency
Advance Vehicle Control and Safety Systems
Date/Time (WHEN?)
t: Before Trip
Place (WHERE?) Location
l: Traveller Route
Path
Motion
m: N/A
Services Manage Information
Construction
Site
Manage Maintenance and Construction
Fig. 17 Event Thread Diagram for ITS
As explained in step 8, the research goal is to develop a requirements definition mechanism (BPA Pattern – Fig.
6)) that describes the What, Who, How, When, Where and Why.
BPA BEHAVIORAL PATTERN - EXAMPLE
Event (WHAT?) Manage Travel and Traffic
1. Provide Pre-trip Information 2. Provide En-route
Driver Information
3. Provide Route Guidance 4. Provide Traveller
Service Information
5. 6.
Agent a: Intelligent Transportation System
Information
Direction
d: N/A
Rationale (WHY?)
Goal g: Manage Travel and Traffic
Mental State bdi:
Caused-By e’: Route Guidance
End;
Fig. 18 BPA Pattern – ITS Manage Travel and Traffic
The key intuitions motivating the introduction of time are:
Events take time. Yet, in most of the popular Object-Oriented Modeling methodologies such as OMT and UML, time is neglected in the event definition.
Multiple events may occur at the same time, and could be unrelated, cooperating, or interfering with each other.
Events may have temporal constraints. They may overlap, start or finish together, occur together, or disable (disjoint) each other. BPA uses the time intervals’ relations that are described in the Interval Algebra framework [8] to model the temporal relationships between events. In this Interval Algebra framework, seven basic relations can hold between time intervals. Fig. 7 and Fig.8 illustrates these basic relations for arbitrary events x and y.
Fig.7 illustrates the Interval Algebra Relations.
Affected p: | Traveller | |
Initial State: Final State: | Uninformed Informed with |
Traffic
Modality (HOW?) Instrument
i: Reports and Communications
Circumstances
Manner
m: Critical
Condition
IJSER © 2014
International Journal of Scientific & Engineering Research, Volume 5, Issue ŝǰȱ ¢ȬŘŖŗŚ
ISSN 2229-5518
179
REL SYM MEANING
x before b y
x meets m y
x o overlap
s y
x starts s y
x during d y
x f finishes
y
x equals eq y
x y
The following is a list of reasons of possible failures in
x y responding to events:
x does not handle
Event rate exceeding the system’s capacity
y Unsuccessful detection and acquisition of all events
x Non-capturing of all information triggered by event
Failure across man-machine interface
y Failure of Software, Hardware, or Human.
x
The ability to provide requirements specification for safe
y
methodologies. Neither a safety analysis (anterior
x analysis) nor accident analysis (posterior analysis) can be achieved efficiently without event analysis. As will
be explained below, the BPA modeling methodology provides the Critical Event Analysis (defined below) as
x an efficient solution to this problem.
y {s,b,a,d,m,o,f}
Toll Booth
Fig. 19 Time Interval Algebra – Temporal Relations
Road
Electronic
Payment
The introduction of the Enable10 / Cause relationships between events will enable the analyst to do cause effect analysis and reason about any possible failure of the
Manage Travel and Traffic
{s,b,a,d,m,o,f}
Improve Public Transportatio n Operations
Commercial
Vehicle
Improve Commercial Vehicle Operations
Transportation
Center
{s,b,a,d,m,o,f}
{s,b,a,d,m,o,f}
Advance Vehicle Control and Safety Systems
{s,b,a,d,m,o,f}

system.
b Before m Meets
Manage Emergency Services
{s,b,a,d,m,o,f}
Manage Information
{s,b,a,d,m,o,f}
Temporal
Relations
o Overlaps
d During
s Starts
f Finishes eq Equals i Inverse
Construction
Site
Manage Maintenance and Construction
Fig. 20 Time Interval Algebra - Temporal Relations Notation
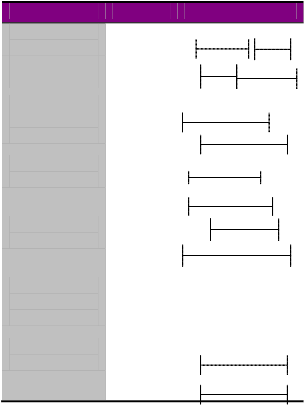
In the Temporal Constraint Diag., as described in steps
9, and 10, the temporal relations that are displayed in Fig. 21 are written alongside the sequence relationships to represent the possible timing at which these events can occur.![]()
10 ‘Enable’ is defined in the American Heritage Dictionary as: “..To supply with the means, knowledge, or opportunity; make able: a hole in the fence that enabled us to watch; techniques that enable surgeons to open and repair the heart.”
Fig. 21 ITS Temporal Constraint Diagram
The requirements should correctly reflect the critical properties of the environment in which software is to work. In order to gain as much confidence as possible in the software for a critical system, the analyst should perform a ‘Critical Event Analysis’. The Critical Event Analysis procedure includes the following steps:
IJSER © 2014
International Journal of Scientific & Engineering Research, Volume 5, Issue ŝǰȱ ¢ȬŘŖŗŚ
ISSN 2229-5518
180
Accidents
OR
NOT NOT
The UCA and the BPA modeling methodologies were used to define the requirements and model the following safety-critical real-time-systems:
(1) The Therac-25 Medical Device System [9]
Emergency
System
Safety
System
(2) The Production Cell System [10]
(3) The Railroad Crossing System [11].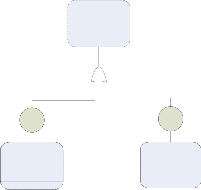
Fig. 22 Critical Analysis Diagram – ITS
Identify Critical Events
For each critical event, identify all possible ways in which it may fail
Capture these possible failure modes using the
undesired event notation
Study each undesired related state to find out how to achieve protection against such possible failure.
There were no missing requirements that required generating a Derived Requirement Document.

The resulting Class Diagram is shown in Fig. 23.
Maintenance Construction
m
Emergency Services
The first application was used, as a proof of concept, in a pilot case study. The last two applications were distributed as part of the case studies material to compare the UCA versus the BPA modeling methodologies using the pre-mentioned effectiveness criteria.
The effectiveness metrics categories used in this research include:
1. System Effectiveness represented by safety
2. Requirements Engineering Process Effectiveness represented by the CMM [12] and CMMI repeatability
3. Definition of Requirements Effectiveness represented by the ANSI (NIST) / IEEE Std 830-1984 [13] for systems specifications:
Unambiguous
Complete
Consistent.
Modifiable.
Traceable
Information
m
manages
1
checks
manages manages
m
Safety
System m
A Multi-Criteria Decision Making (MCDM) Tool,
1 1 1
named as DECISION, was developed by this researcher
Intelligent 1
maintains plans of
Control
Transportation
1
1
responsible
for
m
Travel and Traffic
1
offers
improves
m System
to evaluate the assessment results. The Decision tool
uses a combination of the Analytic Hierarchy Process (AHP) and the ELECTRE Pairwise Comparison approaches. Pairwise Comparisons is the process in
m m which experts rate a set of objects, events, or criteria, by
1 m
Public
has
Electronic
Payment
Commercial Vehicle Operations
comparing only two at a time. Most people are reliable estimators using pairwise comparisons because they
Transportation
has
1
only have to consider two things at a time [14]. The
selected approaches, AHP and ELECTRE, are popular and have strong theoretical basis [15], [16].
Vehicle
Control
Fig. 23 Class Diagram – Intelligent Transportation System
Each SME was provided with a case study kit that contains the instructions, an application, an overview
IJSER © 2014
International Journal of Scientific & Engineering Research, Volume 5, Issue ŝǰȱ ¢ȬŘŖŗŚ
ISSN 2229-5518
181
and a step by step procedure describing how to analyze and model requirements using the UCA and BPA modeling methodologies, two analyses of the given application; one using the UCA modeling methodology and the other using the BPA modeling methodology, explanation of the evaluation method (Pairwise Comparison) and the effectiveness criteria The set of questions presented clearly in a table format (Evaluation Forms).
The number of SMEs depends on the number of the controlled variables. The controlled variables are:
The applications.
The set of the SMEs.
The SMEs’ software engineering experience:
o Structured Analysis
o Use Case Analysis / UML.
i) AHP Results
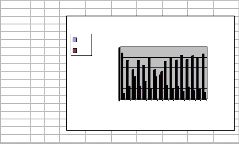
The summary of the assessment results using AHP is illustrated in Fig. 24 in a column chart format.
In most of the popular object-oriented development modeling methodologies state diagrams are used to model the behavior. By using state diagrams, one is focusing on an individual object’s response to specific events rather than objects interaction. Hence, objects interaction must be reconstructed from the analysis of groups of diagrams. Such a task is at least complex and error-prone. By describing the requirements in terms of events, represented by the behavioral patterns, this perceived problem is reduced.
There is a need for a multi-agent systems analysis and design method that is powerful enough to model interaction patterns involving autonomous agents.
In these systems, analysts should perform a ‘Safety Analysis’. Using BPA, one identifies and documents the critical events during the requirements definition stage.
BPA UCA SME 5C1 0.89 0.11
SME 4C1 0.75 0.25
SME 1C1 0.57 0.43
SME 8C2 0.75 0.25
SME 7C2 0.66 0.34
SME 3C2 0.8 0.2
BPA UCA
Evaluation of the BPA versus UCA
1
0.8
0.6
GOD says [KORAN][TORAH], ‚ … Whoever rescues a single life earns as much merit as though he had rescued the entire world.‛ If the use of the BPA Modeling methodology may save one life, the
Effectiveness
0.4
0.2
0
1 3 5 7 9 11 13 15
Subject Matter Experts (SMEs)
significance of this modeling methodology is
immeasurable.
Fig. 24 AHP Results
The above results give an indication of about 93.8 % approval rate for the thesis hypothesis with about three times overall effectiveness for BPA over UCA.
ii) ELECTRE Results

Fig. 25 shows that there is 87% approval rate for the thesis hypothesis.
Subject Matter Experts
UCA is more
[1] Graham, Ian, Migrating to Object Technology, Addison- Wesley, Reading, Massachusetts, 1995.
[2] I. Jacobson, Christeron, M., and Overgaard, Object- Oriented Software Engineering: A Use Case Driven Approach, Addison-Wesley, Massachusetts, 1992.
[3] Jackson, Michael, Software Requirements & Specification, A Lexicon of Practice, Principles and Prejudices, ACM Press, Addison-Wesley, Reading, Massachusetts, 1995.
[4] Martin, Fowler, and Cockburn, Question Time! About Use Cases, OOPSLA’98 Proceedings, ACM Press, New York, NY, 1998.
[5] El-Ansary, Assem I., Behavioral Pattern Analysis: Towards
13%
87%
87%
effective than BPA
BPA is more effective than UCA
a New Representation of Systems Requirements Based on
Actions and Events, in Proceedings of the 2002 ACM Symposium on Applied Computing, ACM, New York, NY,
Fig. 25 ELECTRE Results
2002.
[6] El-Ansary, Assem I., Behavioral Pattern Analysis: Towards a New Representation of Systems Requirements Based on Actions and Events, Doctoral Thesis, George Mason University, 2005.
IJSER © 2014
International Journal of Scientific & Engineering Research, Volume 5, Issue ŝǰȱ ¢ȬŘŖŗŚ
ISSN 2229-5518
182
[7] M A Chowdhary and A Sadek. Fundamentals of Intelligent
Transportation systems planning. Artech House Inc., US,
2003.
[8] Allen, J. F., Maintaining Knowledge about Temporal
Intervals, Communications of ACM, 26, 1983, pp 832-843
[9] Leveson, Nancy, Safeware, Addison-Wesley, Reading, MA,
1995.
[10] Lewerentz, Claus, and Lindner, Thomas, Formal
Development of Reactive Systems, Springer-Verlag, NY,
1995.
[11] Heitmeyer, Constance and Mandrioli, Dino, Formal Methods for Real-Time Computing: An Overview, in Formal Methods for Real-Time Computing, John Wiley & Sons, Inc., NY, 1996.
[12] Humphrey, Watts, Software Process Maturity Framework, Addison-Wesley, MA, 1989.
[13] IEEE and ANSI, ANSI/IEEE Std 830-1984, IEEE Guide to Software Requirements Specification, in System and Software Requirements Engineering, IEEE Computer Society Press, Los Alamitos, California, 1990, pp 170-192.
[14] Saaty, Thomas L., Decision Making for Leaders,
Wadsworth, Inc., 1982.
[15] Meyer, M., and Booker, J., Knowledge Based Systems Vol.
5, Eliciting and Analyzing Expert Judgment, A Practical
Guide, Academic Press, 1991.
[16] Bui, Tung X., Co-oP, A Group Decision Support System for Cooperative Multiple Criteria Group Decision Making, Springer-Verlag, 1987.
IJSER © 2014