Inte rnatio nal Jo urnal o f Sc ie ntific & Eng inee ring Re se arc h, Volume 3, Issue 10, Oc to be r 2012
ISS N 2229-5518
Reproduction of Images by Gamut Mapping and
Creation of New Test Charts in Prepress Process
Jaswinder Singh Dilawari, Dr. Ravinder Khanna
With the advent of digital images the problem of keeping picture visualization unif ormity arises because each printing or sca nning device has its ow n color chart. So, universal color prof iles are made by ICC to bring unif ormity in various types of devices . Keeping that color prof ile in mind various new
color charts are created and calibrated w ith the help of standard IT8 test charts available in the market. The main objective to color reproduction is to produce the identical picture at device output. For that principles for gamut mapping has been designed.
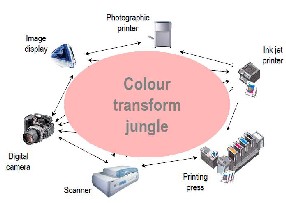
When an image is printed using differ ent devices or scanner s then pr oblem of r endering of color s arises. This can be clear ly pictur ed in figur e 1(© Fuj iFilm 2002)
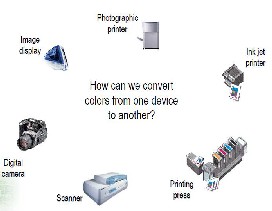
Figure 2: Color rendering problem due to various devices
Figure 1: Each device sees color diff erently
To avoid this common profile by ICC has been made. ICC pr ofile is a data file describing the color characteristics of an imaging device [1]. Figure 2 visualizes the pr oblem in pr inting of image fr om differ ent devices.
Ja swinder Singh Dilawa ri is a Ph.D Resea rch Schola r a t Pacific
Academy of Higher Educa tion and Resea rch
University,Uda ipur,Ra ja sthan (India ), Ph-9896348400, E-ma il-
dila wa ri.ja swinder@gma il.com
Dr. Ravinder Khanna is currently working a s Principa l in Sachdeva
Engineering College for Girls, Mohali, Punja b (India). Ph -
7814930123,E-ma il -ra vikh_2006@yahoo.com
The pr imary purpose of use of this file is to maintain color consistency in images viewed, displayed or printed on var ious devices. ICC pr ofile mainly converts images form RGB to CMYK because digital images used by pr epress department ar e in RGB color format that has to be converted to CMYK color format befor e printing [2]. Figur e 3 shows the wor king of ICC profile. The pr ofiles contain information about separation, black start, black width, total ink coverage. A device is character ized by the color chart used in that device. By using the common format for character ization of color units it is easier to determine the color gamut of device and to optimize the image to pr oduce high image quality. Var ious color gamut ar e available in the mar ket which per form well for all type of images whether that is low key tone image, high tone image or middle tone image [3]. Various methods had been adopted for
IJSER © 2012
Inte rnatio nal Jo urnal o f Sc ie ntific & Eng inee ring Re se arc h, Volume 3, Issue 10, Oc to be r 2012
ISS N 2229-5518
pr oducing color charts so that image quality in printing can be impr oved.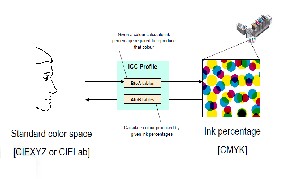
Figure3: Working of ICC prof ile
Accor ding to a paper published in TAGA 2003, Montr eal, Canada a new color chart has been developed based on technical and visual image category analysis. This paper describes that image categor ization using the adapted color charts improves the analysis of r elevant image information w ith r egard to both image gradation and detail r epr oduction. This new color chart pr eserves the image information even in low key ar eas and gives the better image fidelity to the original image [4]. Each scanner holds differ ent color gamut. IT-8 test charts ar e used to corr elate these scanners [5]. Color separation is used to control the amount of black, cyan, magenta and yellow needed to pr oduce the differ ent tones in conversion fr om RGB to CMYK. GCR (Gray Component Replacement) and UCR (Under Color Removal) ar e the two main color separ ation techniques. These separation techniques can be optimized for differ ent paper stocks in order to achieve a good tone distr ibution. The total amount of ink used in a printing process must normally be reduced in order to avoid printing pr oblems such as slurring and quality pr oblems such as lack of image detail [6]. To combine the gray scale image in the pr int a novel spectral imaging technique is used. Just like conventional color imaging, IMI exploits the interaction betw een the illuminating light and colorants used for pr inting and the manner in which the eye adapts to illumination [7][8]. Selection of color gamut also depends upon the display device because it color gamut then decide the pow er consumption, r esolution and view ing angle of that display device.
New test charts used for output character ization of output ar e cr eated by evaluating tone steps. A new set of color values
was used to create an image-adapted test chart, differ ent fr om the gamma and gr adation values normally used. Spectral measur ements wer e made on the new test charts, and new output pr ofiles w er e calculated and applied in the RGB-to-CMYK conver sion for the specific image category aimed for . The advantage of producing your own test chart is that it is possible to achieve a better match to the originals being scanned. A validation print was made w ith the new separation values applied to the specific image category aimed for . The new image adapted color chart is cr eated by judging the bor ders of the L* values for the differ ent images of differ ent categories. Differ ent images used to j udge L* values border ar e shown in figur e 4.
High Key Normal Key Low Key
Figure 4: Diff erent types of images used to f ind L* values
The distribution of the L*-value in the thr ee types of images indicates the borders that may exist between these images, Figur e 5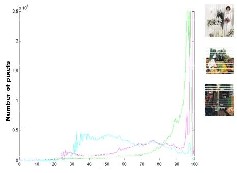
Figure 5: Distribution of L*-value for high-key, normal-key and low -key images. The peak f or high L-values in the normal-key image is caused by the w hite background. The graph w as created in Matlab (Enoksson,
2001).
IJSER © 2012
Inte rnatio nal Jo urnal o f Sc ie ntific & Eng inee ring Re se arc h, Volume 3, Issue 10, Oc to be r 2012
ISS N 2229-5518
These images ar e further processed in matlab and their histograms ar e studied as shown in figur e 6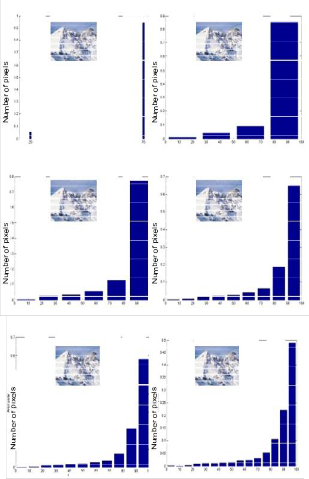
Figure 6: The steps made in the Matlab analysis. Number of pixels in diff erent steps of L* scale in high-key image. The steps made it possible to f ind the borders betw een the images
The studies of the thr ee image categories (high-key, low- key, normal-key) r evealed that the bor ders in the L*-scale for high-key images w er e 100-60, for nor mal-key images
60-40, and for low-key images 40-0, Figur e 7 [9]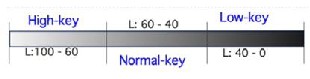
Figure 7: Border range of L* values for different images
This border information is used to develop new adapted color chart. An example of new image color chart developed by above L* values is shown in figur e 8.
Figure 8: An example of the new image-adapted test chart
These developed color charts ar e than compar ed with available color charts in the mar ket and different tonal values fr om figur e 6 is used for that pur pose [10].
The analysis of borders of L* values gives rise to the adoption of IT-8 Test charts. Ther e ar e sever al vendors pr oducing IT8- tar gets for scanner characterization [11]. The tar gets follow a certain pattern based on ISO standar dization values in LCH (ISO 12641-1997).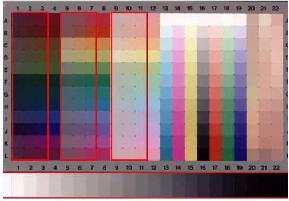
Figure 9: The scanner target consists of a total of 264 colors. The red frames show the standardized values.
Tw elve separ ate hue angles ar e defined at thr ee separate lightness levels. For each specific hue angle and luminance level, ther e ar e four differ ent chr oma values. The highest chroma value is defined as the maximum chr oma which can be generated on a given medium w ith no change in the hue
IJSER © 2012
Inte rnatio nal Jo urnal o f Sc ie ntific & Eng inee ring Re se arc h, Volume 3, Issue 10, Oc to be r 2012
ISS N 2229-5518
angle and lightness level. A further 84 patches pr ovide additional tone scales w hich ar e not defined by any ISO- standar d. Seven tone scales ar e defined for the color s cyan, magenta, yellow , r ed, gr een and blue (no ISO standar d defined). Each tone scale is built-up in twelve steps starting fr om the low est chr oma value and keeping the hue angle stable. Each vendor has defined an optimal tone scale for their own specific output media.
The last three columns in the test chart ar e vendor-specific. Her e the vendor manufactur ing a tar get was allowed to add any featur e they deemed w orthwhile. Each vendor has chosen to use this ar ea differ ently[12][13]. Kodak has chosen the image of a model and several skin tone patches; Agfa and Fuji have both chosen to have patches of special colors in this area (McDowell, 2002).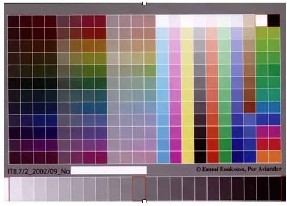
The color charts in a color gamut varies even using a single setting. So to capture an image more accurately with a certain color gamut, scanner color gamut has to be large enough so that image color gamut falls in that. So refer ence r eading of IT8 test chart is must to customize own color chart to improve the scanning picture quality. In customized color charts, customized color patches can be added for specific color values as shown in figure 10.
Figure 10: The customized IT.8 target f or scanners
The obj ective in color r epr oduction is to pr oduce an identical color appearance. Doing so does not usually mean pr oducing an exact match of tr istimulus values as color appearance is affected by many other var iables, such as the state of adaptation or the over all viewing conditions. Any mapping that solves the pr oblem must r elate thr ee gamuts: that of the sour ce device, that of the destination device, and
that of the image. Each device has own color gamut so a gamut tr ansformation must takes place befor e ima ge r epr oduction. The gamut transformation is done such that transfor mation only changes the tr istimulus value pr eserving the appear ance of the image. To accomplish this, the transformations ar e based on widely accepted graphic arts and psychophysical pr inciples, which ar e the most pr ecise definition availab le of w hat it means to “pr eserve the appear ance” of an image. W e summar ize the pr inciples as follows:
(1) The gr ay axis of the image should be pr eserved. (2) Maximum luminance contrast is desirable.
(3) Few colors should lie outside the destination gamut. (4) Hue and satur ation shifts should be minimized.
(5) It is better to incr ease than to decr ease the color
satur ation [14].
The transformation of gamut keeping above r ules in mind should begin with elem entary transformation. These transfor mations ar e combined and adjusted until the image gamut fits pr oper ly into the destination gamut. The combination and adj ustment, which must include human aesthetic j udgment, ar e per formed interactively . To judge this visualization tools ar e r equir ed. The suggested tools ar e:
(1) Tools for true 3-D visualization of the pr oblem ar eas in the gamuts, including interpenetrating, solid, shaded 3-D models of the image and destination gamuts. Our exper ience suggests that useful 3-D visualization tools need sophisticated lighting controls, and a pr ecise mechanism for or ienting and moving light sources and the view point. The impor tance of concavities in gamut sur faces suggests the use of shadows or of curvatur e encoding techniques like those r eported by Forr est [15]. Car eful false-color ing of the gamut sur faces may help to or ient the observer . Transpar ency would be useful for simultaneous view ing of the sour ce and destination gamuts which necessarily inter sect.
(2) An inter active tool to indicate sour ce image pixels corr esponding to a selected color in a gamut disp1a.y and its converse.
(3) Automatic and simultaneous highlighting of all out-of- gamut colors, both in gamut displays and in the sour ce image.
(4) Interactive feedback showing changes in a gamut display w hen tr ansformation par ameter s ar e varied.
IJSER © 2012
Inte rnatio nal Jo urnal o f Sc ie ntific & Eng inee ring Re se arc h, Volume 3, Issue 10, Oc to be r 2012
ISS N 2229-5518
(5) Interactive tools for defining gamut mapping transfor mations. Specifying tr anslation distances, scaling, and r otation factors by pointing at positions in gamut plots would b e very useful [7] [8].
These tools pr ovide visualization whether image gamut fits pr oper ly into the destination gamut.
To avoid color r ender ing in different devices new color charts ar e cr eated and gamut mapping is done. Cr eation of new color charts depend upon the bor der of L* values. To define a shar p boundary for low key image, high key image and middle key image based on L* values is almost impossible. So color charts created although wor k better for low key images but not for high key images so effectively. Gamut mapping found to be more effective because transformation of gamuts starts fr om elementary transformation and pr inciples of human visual system are taken into consideration.
[2] Av iande r Pe r “The c harac te rizatio n o f input de v ices by luminanc e and c hro minance ” V I.Po lyg rafic ky se minar, 2003, Pardubice , Czec h Re public , 10 page s
[3] Eno ksso n Emmi “Image Re pro duc tio n Prac tices” TAGA 2004, San
Anto nio, USA,Tag a Procee dings 2004, pp 318 -331
[4] Gaurav S harma, Ro be rt P. Loce, S teve n J. Harring to n, Y. (Julie t) Zhang , “Illuminant Multi ple xe d Imag ing : S pecial Effec ts using GCR”, IS&T/S ID Eleve nth Co lo r Imag ing Co nfe re nce
[5] M. C. S to ne, W. B. Cowan, and J. C. Be atty ,"colo r g amut mapping and printing o f dig ital c o lo r imag es”, ACM Transac tio ns o n Graphics , Vo l. 7, No. 4, Oc t. 1988
[6] FORRES T, A. R. On the re nde ring o f surfac es. In Procee dings o f the
1979 S ZGGRAPH Co nfe re nce. Co mput. Graph. 13,2 (Aug. 1979), 253 -
259.
[7] J. Mo rov ic , “Gamut mapping ,” in Dig ital Co lo r Imag ing Handbook,
G. S harma, Ed. Boc a Rato n, FL: CRC, 2003, c h. 10.
[8] J. J. Mc Cann, “Co lo r g amut mapping using spatial co mpariso ns,” in
Proc . SPIE, Co lo r Imag ing : Dev ice -Inde pe nde nt Co lo r, Co lo r
Hardc o py , and Graphic Arts V I, Re ine r Esc hbac h, Gabrie l G. Marc u
Edito rs, 0277- 786X/01, vo l. 4300, pp. 126–130, 2001.
[9] R. Bala and G. S harma, “Sy ste m o ptimizatio n in dig ital c o lo r imag ing ,’’ IEEE Sig nal Proce ssing Mag., vo l. 22, no . 1, pp. 55–63, Jan.
2005
[10] A.U Ag ar, F.A Baqai, and J.P. Alle bac h, “Human v isual mo de l- base d co lo r halfto ning ,” in Dig ital Co lo r Imag ing Handboo k, G. S harma, Ed. Boc a Rato n, FL: CRC, 2003, c h. 7 .
[11]Z. Wang , E. P. S imo nce lli, and A. C. Bov ik, “Multisc ale struc tural similarity fo r image quality asse ssme nt,”in Proc 37th Asiloma r Conf on Signa ls, Systems andComputers, (Pac ific Grove , CA), IEEE Co mpute r Socie ty,Nove mbe r 2003.
[12]S. M. Lee , H. L. Kwo n, H. H. Han, G. G. Lee and B. B. Kang , A space v ariant luminanc e map base d co lo r image e nhanc e me nt, IEEE Transac tio ns o n Co nsume r Elec tro nic s, 56(4), 2636 -2643, 2010.
[13] R. Balasubramanian, “Re duc ing the cost o f loo kup table base d co lo r transfo matio ns,” J. Imaging Sci. Technol., vo l. 44, no . 4, pp. 321–
327, 2000.
[14] H.J. Trusse ll, “Applic atio ns o f se t the o re tic me tho ds to co lo r sy ste ms,” Color Res. Applica t., vo l. 16, no. 1, pp. 31 –41, Fe b. 1991.
[15] G. S harma, “Se t theo re tic estimatio n fo r proble ms in subtrac tiv e co lo r,” Color Res. Applica t., vo l. 25, no. 4, pp. 333–348, Oc t. 2000.
IJSER © 2012