
International Journal of Scientific & Engineering Research, Volume 4, Issue 12, December-2013 1032
ISSN 2229-5518
1Department of Physics, QIS College of Engineering and Technology, Ongole-523001, India
2Department of Physics, Sri ABR Government Degree College, Repalle-, India
3Display Materials Laboratory, Applied Physics Department, Faculty of Technology & Engineering, M.S University of Baroda, Baroda-390001, India
Email: sayana.1980@gmail.com
The present paper reports the Synthesis and Photoluminescence (PL) studies of the LaPO 4 phosphor doped with Eu (0.5), Tb (1.0) and Ce with
0.5, 1.0, 1.5, 2.0, 3.0, 4.0 and 5.0 mole percentages respectively. The phosphor was synthesized using the standard solid state diffusion reaction technique. The mixture was fired at 1200oC for 3 hours with heating rate of 5oC/min in a muffle furnace and the received cake is ground using mortar and pestle. The powder phosphors were characterized by X-ray diffraction, FTIR and scanning electron microscopy. The crystallinity and phase purity of the phosphor was confirmed by XRD studies. The Infrared spectra for the prepared solid nano powders were recorded in the range between 400 and 4000 cm-1 on a Fourier transform spectrometer. The particle morphology of the phosphor was characterized by SEM. The Photoluminescence properties of the materials were studied using Spectrofluorophotometer at room temperature. The Photoluminescence (PL) excitation spectra were recorded for different excitation wavelengths at 254 nm, 264 nm and 275 nm monitoring at 614 and 545nm. The PL emission of Eu(0.5),Tb(1.0) and Ce(0.5,1.0,1.5,2.0,3.0,4.0 and 5.0 mol%) doped LaPO 4 phosphor was recorded for different excitation
wavelengths. The PL emission peaks are found at 364, 381, 415, 438, 470, 488, 545, 589, 594, 614 and 622nm with good intensity.
Keywords: PhotoluminesIcence [PLJ], Rare Earth ionSs [RE ions], XRD, SoElid State Reaction [SS R].
Recently various phosphors like LaPO4 : Ce,Tb has been good commercial green phosphor materials have been actively investigated to improve their luminescent
properties and to meet the development of different display and luminescence devices. Inorganic compounds doped with rare earth ions form an important class of phosphors as they possess a few interesting characteristics such as excellent chemical stability, high luminescence efficiency, and flexible emission colors with different activators. As a new green luminescent material, LaPO4 Ce,Tb phosphor has been widely studied since it was found by different preparation methods [1,2].
These phosphors are widely used in displays and lighting devices. The useful applications of rare earth element compounds, especially lanthanide phosphate doped inorganic materials, have been touched upon broadly [5]. Over the past a few years, they have been applied in many fields, such as optical display panels, cathode ray tubes, optoelectronic, sensitive device, electronic and plasma display panels due to their special chemical and physical properties. Various solution-phase routes, including solid state reaction, sol-gel, precipitation, water oil micro emulsion, polyol-mediated process, ultrasonification, hydrothermal, and mechanochemical method, have been tried to lower the reaction temperature and obtain high- quality LaPO 4 based nanoparticles. However, the simple and mass fabrication of LaPO4 nanocrystals with narrow grain size distribution and uniform morphology still remains a challenge [3,4]. It appears that the best solution
both to control powder morphology and to produce low
cost thin films is the use of soft chemistry routes. We adopted the standard solid state reaction technique to prepare LaPO4 with good morphologies and fine crystal structures, and its emission intensity of luminescence was also studied [5,6]. The present paper reports the Photoluminescence (PL) of the LaPO4 phosphor doped with Ce, Eu and Tb rare-earth ions with different emission and excitation wavelengths, the doping concentration of Eu, Tb and Ce are 0.5, 1, 2, 3, 4 and 5 molar percentages respectively.
In the trivalent rare earth ions, the luminescence arises mainly due to transactions within the 4f shell. The efficiency of emission depends on the number of electrons in the 4f shell. The Tb3+ ion has 8 electrons in the 4f shell, which can be excited in the 4f-5d excitation band. The electron in the excited 4f7 - 5d state remains at the surface of the ion and comes under the strong influence of the crystal field resulting in the splitting of the excitation band. The excitation Spectra thus has multiple peaks. The excited ion in the 4f7 – 5d state decays stepwise from this state to the luminescent levels 5D 4 f 3 or 5d4 f 4 by giving up phonons
to the lattice. Luminescence emission occurs from either of these states, with the ion returning to the ground state. The emission line in the green region lying at 545 nm is due to the transition 5D 4 -7F 5.There are in fact multiple emission
lines at each of these due to the crystal field splitting of the ground state of the emitting ions [7,8].
IJSER © 2013 http://www.ijser.org
International Journal of Scientific & Engineering Research, Volume 4, Issue 12, December-2013 1033
ISSN 2229-5518
All the chemical reagents were analytically pure and used
without further purification. LaPO4 phosphor doped with
Eu, Tb and varying concentrations of Ce (0.5, 1.0, 1.5, 2.0,
3.0, 4.0 and 5.0 mol %) rare-earth ions prepared using solid state diffusion reaction method. Stoichiometric proportions of raw materials namely, Lanthanum Oxide (La 2 O 3), Diammonium Hydrogen Phosphate [(NH4) 2 H PO4), Cerium Oxide (CeO2), Europium Oxide (Eu2O 3) and Terbium Oxide (Tb4O7 ) of assay 99.9% were used as starting materials and grinded in an agate motor and pestle, mixed and compressed into a alumina crucible and heated at 1200oC for 3 hours with heating rate of 5oC/min in the muffle furnace [9, 10]. The prepared samples were again grounded in to powder for taking the characteristic measurements.
650
600
550
500
450
400
350
300
250
200
150
100
50
0
LaPO :Eu(0.5),Tb(1.0),Ce(2.0%)
16 18 20 22 24 26 28 30 32 34 36 38 40 42 44 46 48 50
2θ
All the phosphor samples were characterized by X-ray diffraction (Synchrotron Beam Indus -II), The Photoluminescence (PL) emission and excitation spectra were measured by Spectrofluorophotometer (SHIMADZU, RF-5301 PC) using 150 watts Xenon lamp as excitation source. The emission and excitation slit were kept at 1.5 nm, and recorded at room temperature. The Infrared spectra for the prepared solid nano powders were recorded in the
range between 400 and 4000 cm-1 on a Fourier transform
Fig.1: XRD of LaPO4 doped with Eu3+, Tb3+ and Ce3+
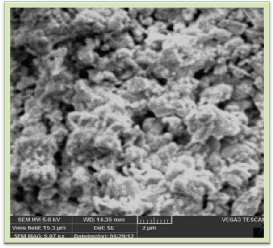
Figure 2 and 3 show SEM image of LaPO4 : Eu (0.5), Tb (1.0), Ce(2.0 mol%). From SEM images it is observed that the particles look irregular shape and agglomerated having
particle size of 1 micron to 5 microns.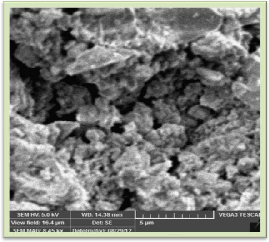
spectrometer. The particle morphology of the phosphor was characterized by SEM.
The crystallinity and phase purity of the phosphors were
firstly examined by XRD analysis. fig.1 shows the typical X-ray diffraction (XRD) patterns of synthesized samples of LaPO4 doped with Eu(0.5),Tb(1.0) and Ce(2.0 mol%). The
XRD patterns of the phosphor is in good agreement with the values from JCPDS no.35-731of LaPO4 , which conform the phosphor is in monazite LaPO4 with
monoclinic structure. All diffraction patterns were obtained using CuKα radiation (λ = 1.540598 Ao) at 40 kv and 30 mA, and divergence slit fixed at 1.52 mm. Measurements were made from 2θ = 15o to 50o with steps of 0.008356o. When crystallites are less than approximately 100 nm in size, appreciable broadening in X-ray diffraction lines occurs. The crystallite size of powder sample were calculated by using Scherer equation D= 0.9 λ / βcosθ Where β represents full width at half maximum (FWHM) of XRD lines (0.112), λ = Wavelength of the X-rays.(0.154 nm in the present case), θ = Braggs angle of the XRD peak. The calculated crystallite size for LaPO 4 : Eu (0.5), Tb(1.0)&Ce(2.0mol%) phosphors is 73.14 nm, and from the XRD study it conforms the formation of phosphor in single phase and matched with JCPDS card no 35-731 of LaPO4.
IJSER © 2013 http://www.ijser.org
International Journal of Scientific & Engineering Research, Volume 4, Issue 12, December-2013 1034
ISSN 2229-5518
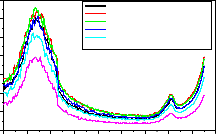
The excitation spectrum monitored with the emission of Tb3+ (545 nm) consists of a broad band peaking at 275 nm with two shoulders at 241, 264 nm, which correspond to the transitions from the ground state 2F5/2 of Ce3+ to the different components of the excited Ce3+ 5d states split by the crystal field [22]. Excitation into the Ce3+ band at 290 nm yields both the weak 5d–4f emission of Ce3+ (300–400 nm) and the strong emission of Tb3+ (488, 545, 583 and
622 nm, corresponding to 5D4 –7F 6,5,4,3 respectively), as shown in Fig. 6b. This indicates that an efficient energy transfer from Ce3+ to Tb3+ occurs in LaPO4 doped with
Eu(0.5), Tb(1.0) Ce (2) phosphor particles, as reported previously[11,12].
From the emission figures, as increase the excitation wavelength from 254 to 275nm, the emission peaks intensities decreased except 488 and 545 nm peaks, the intensity of 488 nm peak slightly increased and 545nm peak intensity is increased by two times which is shown in fig. 13 and table-3 for better comparison.
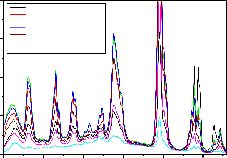
Fig-5:254nm Excitation spectrum of LaPO4:Eu3+,Tb3+,Ce3+ monitored at 614nm
70
In order to determine the chemical bonds of the present
3
60 2
4 1
1-Excitation for Ce(0.5 mol%)
2-Excitation for Ce(1.5 mol%)
3-Excitation for Ce(2.0 mol%)
4-Excitation for Ce(3.0 mol%)
studied phosphor FTIR analysis was carried out. Figure - 4
is the FTIR of the Eu, Tb and Ce doped LaPO4 phosphor, the main absorption around 3600 are assumed H-O-H
50 5-Excitation for Ce(4.0 mol%)
5 6-Excitation for Ce(5.0 mol%)
40
6
IJSE30 R
stretching followed by other bonds of C-H bending, C-O
stretching and CO-OH stretching. CO-OH and H-O-H stretching are due to absorbed CO2 and H2O molecules from atmosphere.
20
10
0
220 240 260 280 300 320 340 360 380 400
Wavelength(nm)
110
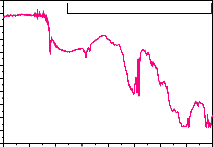
Fig:-4:FTIR of LaPO :Eu3+,Tb3+,Ce3+
LaPO :Eu(0.5),Tb(1.0),Ce(2.0 mol%)
3+ 3+ 3+
100 4
Fig-6:275nm Excitation spectrum of LaPO :Eu ,Tb ,Ce monitored at 545nm
90 600
80
500
1-Excitation for Ce(0.5 mol%)
2-Excitation for Ce(1.0 mol%)
4 3-Excitation for Ce(1.5 mol%)
3 4-Excitation for Ce(2.0 mol%)
70
60 400
50 300
40
200
30
20 100
10 0
5-Excitation for Ce(3.0 mol%)
5 6-Excitation for Ce(4.0 mol%)
7-Excitation for Ce(5.0 mol%)
2
6
1
7
0
4500 4000 3500 3000 2500 2000 1500 1000 500
Wavenumber(cm-1)
220 240 260 280 300 320 340 360 380
Wavelength(nm)
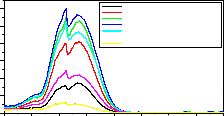
Fig-7:LaPO :Eu(0.5%),Tb(1.0%),Ce(0.5-5.0%) Emission spectrum for 254nm Ex
Figure 5 and 6 are the excitation spectra of LaPO4 doped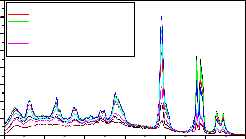
400
350
1-Emission of Ce(0.5 mol%)
2-Emission of Ce(1.0 mol%)
3-Emission of Ce(1.5 mol%)
545
4
with Eu(0.5), Tb(1.0) Ce (0.5 to 5%) when monitored at
614 and 545nm. From figure 6 it is observed that the
4-Emission of Ce(2.0 mol%)
300 5-Emission of Ce(3.0 mol%)
6-Emission of Ce(4.0 mol%)
3
5
589
excitation spectra consist of two absorption maxima at 264 and 275nm. Fig.7,8, 9, 10 and 11 are the emission spectra of LaPO 4 doped with Eu(0.5), Tb(1.0) and
250
200
150
7-Emission of Ce(5.0 mol%)
2
488
594
Ce(0.5,1.0,1.5,2.0,3.0,4.0 and 5.0 mol%) phosphor under different excitations at 254 and 275 nm wavelengths. The phosphor shows the PL peaks at 364, 381, 415, 438, 470,
100 364
50
0
381
415
438
470
6
1 614 622
7
488, 545, 589, 594, 614 and 622 nm with good intensity.
350 400 450 500 550 600 650
Wavelength(nm)
IJSER © 2013 http://www.ijser.org
International Journal of Scientific & Engineering Research, Volume 4, Issue 12, December-2013 1035
ISSN 2229-5518
Fig-8:LaPO :Eu(0.5%),Tb(1.0%),Ce(0.5-5.0%) Emission spectrum for 254nm Ex
400
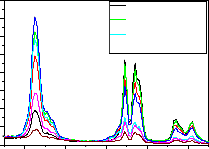
Fig-11:LaPO :Eu(0.5%),Tb(1.0%),Ce(0.5-5.0%) Emission specrum for 275nm Ex
200
350
300
250
545 1-Emission of Ce(0.5 mol%)
2-Emission of Ce(1.0 mol%)
4 3-Emission of Ce(1.5 mol%)
4-Emission of Ce(2.0 mol%)
5-Emission of Ce(3.0 mol%)
6-Emission of Ce(4.0 mol%)
5 7-Emission of Ce(5.0 mol%)
1-Emission for Ce(0.5 mol%)
2-Emission for Ce(1.0 mol%)
3-Emission for Ce(1.5 mol%)
4-Emission for Ce(2.0 mol%) 488
5-Emission for Ce(3.0 mol%)
6-Emission for Ce(4.0 mol%)
7-Emission for Ce(5.0 mol%)
545
4
3
5
2
200
150
6
100
1
50
7
0
589
594
614
622
100
50
364
381
415
438
470
2 589 594
6
614
622
540 560 580 600 620 0 7
Wavelength(nm)
350 400 450 500 550 600
Wavelength(nm)
Fig-9:LaPO :Eu(0.5%),Tb(1.0%),Ce(0.5-5.0%) Emission specrum for 275nm Ex
Fig-7,8 are the emission spectrum of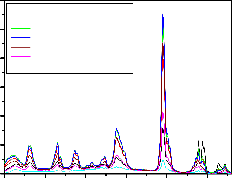
600
500
400
300
200
1-Emission for Ce(0.5 mol%)
2-Emission for Ce(1.0 mol%)
3-Emission for Ce(1.5 mol%)
4-Emission for Ce(2.0 mol%)
5-Emission for Ce(3.0 mol%)
6-Emission for Ce(4.0 mol%)
7-Emission for Ce(5.0 mol%)
545
4
3
5
2
LaPO4 :Eu(0.5),Tb(1.0) and Ce(0.5,1.0,1.5,2.0,3.0,4.0,5.0
mol%) under 254nm excitation wavelength. From the
graphs it is observed that the peaks at 364,381,415,438,470,
614,622nm with lower intensity and 488,545,589 and
594nm are with high intensity. As increasing the Ce concentration in LaPO4 : Eu(0.5),Tb(1.0) from 0.5 to 5.0 mol %, the 545nm peak intensity increases up to 2.0 mol% of Ce doping further increasing the Ce concentration the
545nm peak intensity gradually decreases. When
IJSER
100
0
364
381
415
438
470
488
6
1 589 594
614622
7
concentration of Ce is more than 2.0 mol% in
LaPO4 :Eu(0.5),Tb(1.0) the quenching effect started and maximum quenching at 5% of Ce ions in LaPO4 :Eu(0.5),Tb(1.0) is observed. The other major peaks
350 400 450 500 550 600
Wavelength(nm)
at 589nm and 594nm peaks intensity is gradually decreases
as Ce concentration increases and the remaining peaks at
364nm,381nm,415nm,438nm and 470nm peaks intensity
increases as Ce concentration increases up to 1.5 mol% and further increase of Ce decreases the PL intensity .
Fig-10:LaPO :Eu(0.5%),Tb(1.0%),Ce(0.5-5.0%) Emission specrum for 275nm Ex
600
545
1-Emission for Ce(0.5 mol%)
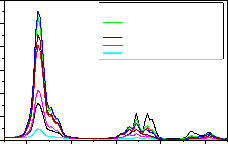
Fig-9,10,11 are the emission spectrum of
500
4 2-Emission for Ce(1.0 mol%)
3 3-Emission for Ce(1.5 mol%)
LaPO4 :Eu(0.5),Tb(1.0) and Ce(0.5,1.0,1.5,2.0,3. 0 , 4.0,5.0
5
400
2
300
200 6
4-Emission for Ce(2.0 mol%)
5-Emission for Ce(3.0 mol%)
6-Emission for Ce(4.0 mol%)
7-Emission for Ce(5.0 mol%)
mol%) under 275nm excitation wavelength. The same PL
pattern is observed like 254nm excitation except the emission intensity of 545nm increases by 60% when
compared to 254nm excitation when the Ce concentration is at 2%. However as Ce concentration increases the PL peak intensities of 364nm, 381nm, 415nm, 438nm and
1
100
7
0
589
594
614
622
470nm peaks increase marginally as Ce concentration increases up to 1.5 mol% and further decreased their
540 560 580 600 620
Wavelength(nm)
intensity when excited with 275nm. Table-1 and Table-2
are the emission intensities of various peaks, they are observed in LaPO4 : Eu(0.5),Tb(1.0) and Ce for different concentrations when excitation with 254 and 275nm. The same is shown in fig-12 for better comparison.
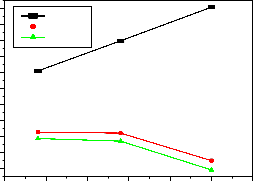
It is clearly observed that the PL emission intensity of
545nm, 589nm and 594nm peaks are affected with respect to excitation wavelengths, which is as shown in fig-13. From the figure 545nm peak’s intensity increased and
589nm, and the 594nm peak’s intensity decreased as increasing excitation wavelengths. Table-3 gives the
emission peak intensity for better comparison.
IJSER © 2013 http://www.ijser.org
International Journal of Scientific & Engineering Research, Volume 4, Issue 12, December-2013 1036
ISSN 2229-5518
S No | Peak Wavelength(nm) | Emission peak intensity for different Excitation wavelengths | ||
S No | Peak Wavelength(nm) | 254nm | 264nm | 275nm |
1 | 364 | 80 | 71 | 60 |
2 | 381 | 102 | 95 | 96 |
3 | 415 | 112 | 108 | 107 |
4 | 438 | 85 | 86 | 82 |
5 | 470 | 73 | 72 | 61 |
6 | 488 | 126 | 146 | 158 |
7 | 545 | 354 | 448 | 553 |
8 | 589 | 163 | 160 | 74 |
9 | 594 | 143 | 135 | 45 |
10 | 613 | 48 | 43 | 14 |
11 | 622 | 48 | 51 | 27 |
. Table-3: Emission peaks intensity for different Excitation wavelengths of LaPO4 :Eu(0.5),Tb(1.0) and Ce(2.0 mol %)
600
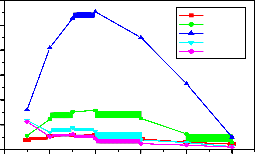
Fig-12:Variation of PL Intensity with Ce concentration for different emission peaks under 275nm Ex
Table-1 : Emission intensity for different peaks of
500
400
545nm
1-470nm
2-488nm
3-545nm
4-589nm
5-594nm
IJSER
LaPO4 :Eu(0.5),Tb(1.0) and Ce(0.5,1.0,1.5,2.0,3. 0 ,
4.0,5.0 mol%) under 254nm Excitation.
Table-2 : Emission intensity for different peaks of
LaPO4 :Eu(0.5),Tb(1.0) and Ce(0.5,1.0,1.5,2.0,3. 0 ,
4.0,5.0 mol%) under 275nm Excitation
300
200
100
0
488nm
594nm 589nm
470nm
0 1 2 3 4 5
Ce concentration(mol %)
550
Fig-13:Variation of emission intensity with Excitation wavelength for different peaks
1-545nm
500 2-589nm
545nm
450
3-594nm
400
350
300
250
200
150
100
50
589nm
594nm
250 255 260 265 270 275 280
Excitation wavelength(nm)
The excitation spectra of LaPO4 : Eu, Tb, Ce phosphor was recorded by monitoring the 5D0 7F 2 transition of Eu3+ at
614nm is shown in Fig. 5. The excitation spectra show broad absorption peak in the range 220-270nm. The
IJSER © 2013 http://www.ijser.org
International Journal of Scientific & Engineering Research, Volume 4, Issue 12, December-2013 1037
ISSN 2229-5518
prominent excitation band was observed at 254nm due to the transition of Eu3+ and this clearly indicates that in LaPO4 : Eu, Tb, Ce phosphor where in Eu stabilized as Eu3+ ion. . Fig. 7 and 9 are the emission spectra of LaPO4 : Eu, Tb, Ce phosphor at room temperature having 254 and
275nm excitation
Emission spectrum consists of emission peaks in the range of 550–650 nm, which result from 5D0 7FJ (J=1, 2) transitions of Eu3+ ion respectively. For an excitation wavelength of 254nm, the emission spectrum of LaPO4 : Eu, Tb, Ce consists of sharp emission lines at 589,594,614 and 622nm. The emission at 589nm and 594 nm originates
from the allowed magnetic dipole (MD) transition 5D0 7F 1. The 5D 07F 1 magnetic dipole transition emissions are split at 589 nm and 594 nm. The peak was observed at 614nm due to the electric dipole 5D0 7F 2 transition, which has the less emission intensity. From the emission spectrum it is clearly observed that the emission intensity of magnetic dipole was higher than that of electric dipole transition, due to this Eu3+ ions occupy a low symmetry site in LaPO4 : Eu, Tb, Ce host. Both magnetic dipole transition and electric dipole transitions are shown in the emission spectra. If the magnetic dipole transition 5D 07F 1 having the highest intensity then Eu3+ ions in host lattice occupies an inversion
centre [15,17]. If the emission intensity of magnetic dipole
the different doping concentrations of Ce, it can be observed that in the range of 0.5 – 5 mol% for doping concentrations the luminescent intensities originating from the Tb3+, 5D4 -7FJ (J = 6, 5, 4, 3) transitions increase with the increase of concentration, as a result, the luminescent intensity reaches maximum at 2 mol% of Ce3 When the concentration of Ce3+ increases more than 2 mol%, emission intensity decreases which is due to the concentration quenching and also Ce may be stabilizing in Ce4+ state. The decrease in the intensity with an increase in concentration was presumably due to the well- established theory of concentration quenching [9]. It can be seen from fig.9, a prominent and significant greenish yellow emission has been noticed for 1 mol% Tb3+, which implies that this concentration in LaPO4 :Eu, Tb, Ce phosphor could be found as a potential and efficient phosphor for decorative CFL lamps.
The absorption band of Ce4+ is expected to be an efficient killer. Therefore, it is likely that Ce4+ is present in the LaPO4 : Eu, Tb, Ce lattice when the Ce concentration is more than 3%. The absorption band of Ce4+ is ascribed to a second phase containing Ce4+. The Ce3+emission in La PO4 is double band, peaking at 250 and 275 nm, respectively resulting from the splitting of the ground states 2F5/2
and 2F7/2. It is assumed that the cerium atoms have a good
random distribution in the crystals, the inter-distance
IJSER
transition was lower than that of electric dipole transition, which indicates that Eu3+ ions occupied without an inversion symmetric centers in the host.
The excitation spectra of LaPO 4 : Eu, Tb, Ce extended from 250-280nm when monitored at 545nm which is shown as 6. The emission transitions in the wavelength range of 320–400 nm are characteristic of forbidden 4f-4f transitions within the Tb3+ configuration. The peaks with the position from 300 to 400 nm belong to the transitions between energy levels of the 4f8 configuration of Tb3+ (f–f transitions)[16,18]. Among these, the 381 nm transition has the maximum intensity compared to the other transitions.
The emission spectra of LaPO4 : Eu, Tb, Ce phosphors (x =
0.5 -5mol %) are compared in fig. 7,8,9,10,11. Each
spectrum could be divided into two parts. The emission between 400–450 nm is due to transitions from the 5D3 excited state. Above 480 -630nm, the emission peaks are originated from 5D4 excited states of Tb3+. The 5D 4 -7F J (J =
6, 5, 4, 3) characteristic emissions of Tb3+, at 415, 438, 488,
545 and 622 nm, correspond to the transitions of 5D3 to 7F5 , 7F4 and 5D4 to 7F 6, 7F 5, and 7F3, respectively. Under an ultraviolet lamp a strong greenish yellow luminescence is observed. The corresponding emission spectra of LaPO4 : Eu, Tb, Ce indicate narrow emissions
which arise from 4f-4f transitions within Tb3+ ions as shown in fig.9. Among the measured emission transitions, the green-emission transition 5D 4 -7F 5 at 545 nm has more intense in nature due to the nature of the dopant Tb3+ ion in the host matrix. Emission intensities from 5D 3 excited state decrease with the increase of the cerium concentration and show a maximum intensity at 545 nm when Ce is 2% when excited with 275nm. Comparing the emission intensities of
between Ce3+ and Ce4+ should also be in this range. It is known that the energy transfer between Ce3+ in La PO4 is through dipole-dipole interaction [5].
Based on the above discussions, we may conclude that the Ce4+ is an efficient killer for the Ce3+ emission and does play an important role in the luminescence process of LaPO4 :Eu, Tb, Ce . Since the energy transfer between Ce3+ and Ce4+ is an inter-valance charge transfer, the efficiency of this energy transfer depends not only on the concentration of the Ce4+ but also on the special distribution of the cerium atoms in the material. The energy transfer between Ce3+ and Ce4+ reduces the energy transfer probability between Ce3+ and Tb3+, and
subsequently reduces the emission intensity of Tb3+. The transfer of energy from sensitizer to an activator occurs without the appearance of a photon and is the primary result of the multipole interactions between the sensitizer and activator [19, 20].
The Cerium emission 5d (2D3/2) 4f(2F 7/2 and 2F5/2) involves pure electric dipole transitions but 4f 4f transitions in Tb3+ and Eu3+ have simultaneously a dipolar and a quadric polar character. Therefore two possible transfer mechanisms for Ce3+ Tb3+ energy transfer are dipole-dipole and dipole- quadrapole interactions may be present. In double phosphates, the presence of PO4 3- groups, in which P-O bonds are strongly covalent, leads to relatively weak crystal field at the rare earth sites. The covalent nature of Ce-O bond is sufficient to shift the Ce3+ emission in these phosphates towards the higher wavelength. This results are in overlapping of Ce3+ emission (330-470 nm) and Tb3+ excitation (250- 290) spectrum. Thus, it is possible to sensitize Tb3+ emission by Ce3+ emission. We got a strong intensity for 5D 4 7F5
IJSER © 2013 http://www.ijser.org
International Journal of Scientific & Engineering Research, Volume 4, Issue 12, December-2013 1038
ISSN 2229-5518
emission line of Tb3+ ions in LaPO4 : Eu(0.5%), Tb(1%), Ce
(2%)[22,23] .
From the above graphs it is observed that many peaks are with less intensity at 364,381,415,438,470,614,622nm and with good intensity 488,545,589,594nm. Out of these the two peaks at 364 and 470nm are due to electron transitions of Ce3+, 2D 3/2 (5d) → 2F5/2(4f) (364nn) and 2D3/2(5d)
→ 2F7/2(4f) (470nn). The peaks at 381,415,438,488 545
and 622nm are due to electron transitions of Tb3+, these
are 5D 3 → 7FJ (J=6,5,4), 5D 3 → 7F 6 , 5D 3 → 7F 5 , 5D 3
→ 7F4 and 5D 4 → 7FJ (J=6,5,4), 5D 4 → 7F6 , 5D 4 → 7F 5,
5D 4 → 7F 4 respectively. The emission peaks at 589 and
594nm are due to magnetic dipole component of Eu3+ transition of 5D 0 → 7F 1 and the PL emission peak at 614nm is due to electric dipole component of Eu3+ transition of 5D 0 → 7F2. Among these emission transitions, the green emission transition 5D4 → 7F5 at 545nm has been more intense due to the nature of the dopant Tb3+ ion in the host matrix, the red emission transition 5D 0 → 7F 1 at 589 and
594nm have more intense due to the nature of the dopant Eu3+ in the host matrix [21,23]. The presence of Eu (0.5%) in LaPO4 : Tb (1%), Ce(2%) sensitizes the basic emissions of Tb3+ as well as emits its own emissions in Eu3+ state.
The PL characteristics are concern the present studied phosphors can be used as phosphor in CFL’s. Because the results obtained are comparable with the commercially
Journal of Rare Earths, Vol. 27, No. 2, Apr.
2009, p. 182,
[2] Stouwdam J W, Hebbink G A, Huskens J, Veggel F C JM van, Lanthanide-doped nanoparticles with excellent luminescent properties in organic media. Chem. Mater.,
2003, 15: 4604.
[3] Albrand K R, Attig R, Fenner J, Jesser J P,
Moot D. Crystal structure of the laser material NdP5O14. Mater. Res. Bull.,1974,
9: 129.
[4] Buissette V, Moreau M, Gacoin T, Boilot J P, Chane-Ching J. Y, Le Mercier T. Colloidal synthesis of luminescent rhabdophane, LaPO4:Ln3+·xH2O (Ln=Ce, Tb, Eu; x≈0.7) nanocrystals.Chem. Mater.,
2004, 16: 3767.
[4] Kang Y C, Kim E J, Lee D Y, Park H D.
High brightness LaPO4: Ce,Tb phosphor particles with spherical shape. J. Alloys
Compd., 2002, 347: 266.
[5] Rao R P, Devine D J. RE-activated lanthanide phosphate phosphors for PDP
applications. J. Lumin., 2000, 87-89: 1260. [6] Xiu Z, Liu S, Lü M, Zhang H, Zhou G.
Photoluminescence of Eu3+-doped LaPO 4
nanocrystals synthesized by combustion method. Mat. Res. Bull., 2006, 41: 642.
[7] Gallini S, Jurado J R, Colomer M T.
Combustion synthesis of nanometric
available phosphors.
powders of LaPO4 and Sr-substituted
LaPO 4 .Chem. Mater., 2005, 17: 4154.
[8] Schuetz P, Caruso F. Electrostatically assembled fluorescent thin films of rare-
LaPO4 : Eu, Tb, Ce phosphors were successfully
synthesized by using solid state diffusion reaction method
at low temperature. The main peak in XRD pattern was found around 28.6o corresponding to a d- value of about
3.15Ao, followed by other less intense peaks corresponds to the monoclinic system of crystal structure of Lanthanum Phosphate. The calculated crystallite size for LaPO4 : Eu(0.5),Tb(1.0) & Ce(2.0mol%) phosphors is 73.14 nm,
and from the XRD study it conforms the formation of phosphor is mostly in single phase. This method is easy for the preparation of Eu, Tb and Ce doped LaPO4 phosphors and can be potentially applied to the synthesis of other high quality rare earth ions doped phosphate phosphor materials with micro/nano structure. LaPO4 : Eu, Tb, Ce phosphor powder was successfully synthesized using a modified solid state method. LaPO4 : Eu, Tb, Ce phosphor shows green, orange-red emission under 254nm excitation. The photoluminescence study shows that the emissions from
earth-doped lanthanum phosphate
nanoparticles.Chem. Mater., 2002, 14: 4509. [9] Page, P., Murthy, K.V.R. Luminescence associated with Eu3+ in two host lattices (2010) Philosophical Magazine Letters, 90
(9), pp. 653-662.
[10] Suresh, K., Murthy, K.V.R., Atchyutha Rao,
C., Poornachandra Rao, N.V., Subba Rao, B. Synthesis and characterization of nano Sr
2CeO 4 doped with Eu and Gd phosphor
(2013) Journal of Luminescence, 133, pp.
96-101.
[11] [12] Bril A, Wanmaker W L. Some
properties of europium activated phosphors. J. Elec. Chem. Soc., 1964, 111(12): 1363.
[12]Yu L, Song H, Lu S, Liu Z, Yang L, Kong X.
Luminescent properties of LaPO 4 :Eu nanoparticles and nanowires. J. Phys.Chem.,
2004, 108: 16697.
[13] Dexpert-Ghys J, Mauricot R, Faucher M D.
electric dipole transition (5D 07F 2 ) is less over that of
Spectroscopy of Eu3+
ions in monazite type
magnetic dipole transition (5D 07F 1 ). The optimum concentration of Eu3+ in LaPO4 : Eu, Tb, Ce was 2 mol%. The PL spectra also show a strong emission at 545nm (5D 4 -
7F5 ) of Tb3+. The LaPO4 : Eu, Tb, Ce phosphors can be easily applied in various types of lamp and display due to
its good PL performance. The results indicated that present phosphor could find application in white light emitting CFLs.
[1] Mounir Ferhi, Karima Horchani-Naifer, Mokhtar Ferid, Combustion synthesis and luminescence properties of LaPO 4 : Eu (5%)
lanthanide orthophosphates LnPO4,Ln=La
or Eu. J. Lumin., 1996, 69: 203.
[14] Rambabu U, Buddhudu S. Optical properties of LnPO4: Eu3+(Ln=Y, La and Gd) powder phosphors. Opt. Mater., 2001, 17:404.
[15] Shionoya S, Yen W M. Phosphor Handbook, Phosphor Research Society, CRC Press,
1998, 459.
[16] Blasse G, Grabmeier BC. Luminescent
Materials. New York: Springer-Verlag;
1994.
[17] Nazarov M V, Zamoryanskaya M V, Popovici E-J, Ungur L,Tsukerblat B S. Luminescence of calcium tungstate
IJSER © 2013 http://www.ijser.org
International Journal of Scientific & Engineering Research, Volume 4, Issue 12, December-2013 1039
ISSN 2229-5518
phosphorsdoped with europium and terbium. J. Mold. Phys. Sci., 2003,2(1): 68.
[18] Brixner L H, Chen H Y. On the structural and luminescent properties of the M’ LnTaO4 rare earth tantalates. J. Electrochem.Soc., 1983, 130: 2435.
[19] R.P. Rao, Tm3+ activated lanthanum phosphate:a blue PDP phosphor Journal of
Luminescence 113 (2005) 271–278.
[20] Kim G C, Mho S I, Park H L. Observation of energy transfer between Ce3+ and Eu3+ in YAIO 3 :Ce, Eu. J. Mater. Sci. Lett., 1995,
14(11): 805.
[21] Sohn K S, Choi Y Y , Park H D .
Photoluminesrence behavior of Tb3+actived
YBO 3 , phosphors, J. Electrochem. Soc.,
2000, 147(5): 1988.
[22] Rap R P. Tb3+ activated green phosphors for plasma display panel application, J . J . Electrochem. S-III. , 2003.150(8): H165.
[23] R.P. Rao and D.J. Devine RE-activated lanthanide phosphate phosphors for PDP Applications, Journal of Luminescence 87-
89 (2000) 1260-1263.
IJSER
IJSER © 2013 http://www.ijser.org