International Journal of Scientific & Engineering Research, Volume 2, Issue 11, November-2011 1
ISSN 2229-5518
Techniques of Removal of Baseline Fluctuation from EMG Signal Recordings
Manish, Sadhana Pal, Anupam Bhardwaj, Gyan Prakash Pal
—————————— ——————————
Introduction
lectromyography is used to classify various neuromuscular disorders .The word “electromyography” is made up of three parts: “electro“+ “myo” + “graphy.” “- Myo-” is from the Greek word “mys”, meaning muscle and “graphy” comes from the Greek word “grapho” meaning to write. Thus Electromyography is the writing (recording) of muscle electricity. EMG stands for electromyography and is the study of muscle electrical signals, and forms a valuable aid in the diagnosis of neuromuscular disorders. There are several hundred neuromuscular disorders that affect the brain and spinal cord, nerves, or muscles. Many of these diseases are hereditary and life expectancy. Early detection and diagnosis of these diseases by clinical examination and laboratory tests are essential for their management as well as their prevention through prenatal diagnosis and genetic counseling. Such information is also useful in research which may lead to the understanding of the nature and eventual treatment of these diseases.EMG examinations studies the electrical activity of the muscle and forms a valuable neurophysiologic test for the assessment of
neuromuscular disorders.
In humans, clinical EMG provides useful information in the electro-diagnostic examination of patients suffering from neuromuscular disorders. EMG is also particularly helpful in deciding the symptom of muscle weakness in the assessment of neuromuscular disorders. EMG findings are used to detect and describe different disease processes affecting the motor unit, the smallest functional unit of the muscle.
![]()
Manish, Assistant Professor.ABES Engineering College, Ghaziabad
Sadhana Pal, ABES Engineering College, Ghaziabad
Anupam Bhardwaj, HOD of EC Deptt. SIT Meerut
Gyan Prakash Pal, Assistant Professor, SIT Meerut.
With voluntary muscle contraction, the action potential
reflecting the electrical activity of a single anatomical motor unit is recorded. It is the compound motor unit action potential (MUAP) of those muscle fibers within the recording range of the needle electrode. The quality of EMG signal may be degraded by baseline oscillations, disturbing the process of MUAP extraction, classification and analysis. An adequate cancellation of baseline fluctuation would enhance the signal quality and accordingly make the diagnosis more reliable.
EMG signal is the algebraic summation of the motor unit
action potentials within the pick-up area of the electrode being used. The pick-up area of an electrode will almost always include more than one motor unit because muscle fibers of different motor units are intermingled throughout the entire muscle. Any portion of the muscle may contain fibers belonging to as many as 20-50 motor units.
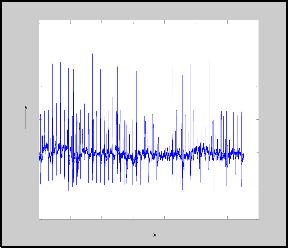
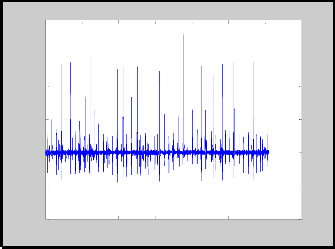
Analysis of the recording of EMG signals from the muscles in healthy subjects at low force level, using concentric needle electrode. The signal was analogue band pass filtered at 3 Hz to 10 KHz and sampled at 20 KHz. The EMG signal was then low pass filtered at 8 KHz and down sampled by a factor of two at 10 KHz. The Recording equipment comprised an electromyography and disposable concentric needle electrodes. The electromyography amplifies the input signals according to a manually selected gain. An EMG signal with baseline fluctuation and low frequency noise is shown in Figure1.
IJSER © 2011 http://www.ijser.org
International Journal of Scientific & Engineering Research, Volume 2, Issue 11, November-2011 2
ISSN 2229-5518
400
300
200
100
0
-100
-200
0 0.5 1 1.5 2 2.5 3 3.5
Figure1. Raw EMG Signal
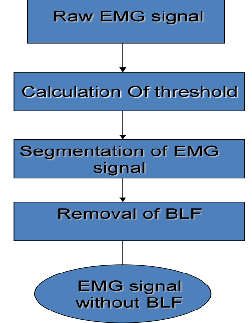
There are two techniques are used for removal of baseline fluctuation, which is listed below.
(a) Calculation of threshold
(b) Segmentation of EMG signal
(c) Removal of baseline fluctuation
(a) Calculation of threshold
(b) Segmentation of EMG signal
(c) Interpolation of baseline points
(d) Analysis of Power spectrum density
(e) Filter designing & filtering of raw EMG
signal
Figure2.Flow chart shows the sequential steps of statistical technique.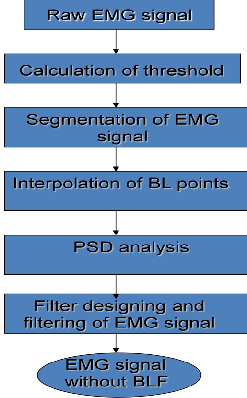
Figure3. Flow chart of filter designing method
IJSER © 2011 http://www.ijser.org
International Journal of Scientific & Engineering Research, Volume 2, Issue 11, November-2011 3
ISSN 2229-5518
The calculation of threshold is used to find out the activity level of the EMG signal, classification and segmentation of whole EMG signal x(t). An algorithm used for the calculation of threshold T is given as
If maximum x (t)>30* mean (abs x (t)) Then
Threshold = 5 * mean (abs x (t))
Else
Threshold =maximum x (t)/5
The process to cut the EMG signal into segment of possible MUAPs segment (active segment) and low activity areas or baseline segment (MUAPs free segment) is known as segmentation. Segmentation of EMG signal can be performed with the help of discrete wavelet transform (DWT) [4]. Another approach of segmentation is performed into two stages. In first stage AS are obtained and in second stage BLS are obtained. In the first step segmentation algorithm calculates the threshold; peaks over the calculated threshold are considered as candidate MUAPs. A window of constant width of 120 points is applied centered at the identified peak. If a greater peak is found in the window, the window is centered at the greater peak otherwise the 120 points are saved as a candidate MUAP waveform. In second stage to obtain the BLS of EMG signal, second threshold, named T1 is calculated. In this step a
of EMG signal are removed by subtracting the value of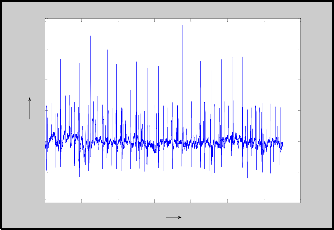
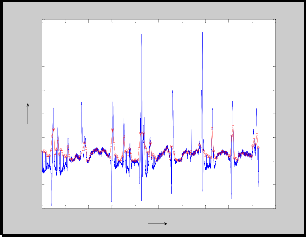
threshold T1 from the absolute value of the each samples present in the BLS of the first window of the size of 30 samples and then take the next window and subtract the value of respective threshold T1 from the absolute value of each samples of this window. This sequential procedure is applied to the whole windows of BLS of the EMG signal. After applying all the above procedure, a new BLS is obtained, which is free from the BLF. Figure 2(a) and 2(b) show the BL with Fluctuation and without fluctuation. The EMG signal without BLF can be further used for required applications. In this way an adequate cancellation of BLF can be obtained, that can enhance the signal quality and accordingly make the process of extraction and analysis of EMG signal easier and reliable.
400
300
200
100
0
-100
-200
0 0.5 1 1.5 2 2.5 3 3.5
windows of constant width of 30 points is taken and
calculates T1, then selects the next window of 30 samples and calculate the value of T1 again. Thus the whole length of the EMG signal is divided into the window of 30 samples and threshold is calculated each time. The value of threshold is change for every next window. The threshold T1 is also calculated on the basis of mean absolute value of whole samples present in a window of 30 samples. The BLS is performed by the comparison of threshold T1 with first threshold T. If threshold T1 is greater than the threshold T then the samples is again considered as the candidate of MUAPs waveform i.e. the active, otherwise the segment is baseline segment. The value of second threshold T1 is calculated as:
Where w is the size of window.
400
300
200
100
0
-100
-200
Samples
4
x 10
From the segmentation of whole EMG signal the AS and BLS distinguished from the EMG signal. The removal of BLF present in the BLS of the EMG signal can be performed. The AS of the EMG signal will remain same, only the correction is required in the BLS of the signal. The oscillations or disturbance present in the baseline segment
0 0.5 1 1.5 2 2.5 3 3.5
4
x 10
IJSER © 2011 http://www.ijser.org
International Journal of Scientific & Engineering Research, Volume 2, Issue 11, November-2011 4
ISSN 2229-5518
2.1(a) The Calculation of threshold and 2.1(b) the
Segmentation of EMG signal are same as discussed in section 1.1(a) and 1.1(b) respectively.
Interpolation is the process of estimation of values between the data points. The previously averaged points are interpolated by means of cubic splines, which closely follows the BL through (along) its fluctuations (Fig 3a). The cubic splines technique interpolates signal points by means of concatenated cubic polynomials such that the obtained interpolation curve and its time derivative are both continuous throughout the whole time span, and the signal points to be interpolated are exactly on the curve (Fig 3b).
of the baseline, so that the filter would be designed for the
specified cut off frequency. There are various methods to estimate the frequency spectrum of baseline segment. AR spectral estimation can also be used on the interpolated signal to obtain a smooth and high resolution power spectral density but in this paper Fast Fourier transform is used to obtain the Power spectrum density of interpolated baseline segment.
For a wide-sense stationary (WSS) process X (n), the power spectral density, Sxx(f), is the Fourier transform of the autocorrelation function rxx (k) (Wiener-Khintchine) [3]. The power spectral density, Sxx(f), is a real and nonnegative function and the signal variance is
2
300
rxx (0) s xx ( f )df
(1)
250
200
Given a finite sequence x[n], of length N, the autocorrelation function can be estimated by
1 N k 1
150
100
![]()
r (k )
N n 0
x(n) x * [n k ]
(2)
50
0
-50
This is asymptotically unbiased, consistent with low
variance.
Taking the Fourier transform of both sides and making some mathematical manipulation. We get the period-gram estimate of power density spectrum.
-100
0 500 1000 1500 2000 2500 3000 3500 4000 4500 5000
Samples
![]()
s PER (F ) 1
N
![]()
X ( f ) X * ( f ) 1
N
X ( f )![]() 2
2
(3)
The properties of periodgram estimator are
Asymptotically unbiased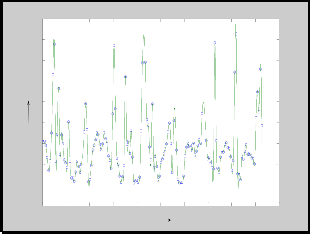
80 [sxx
( f )] wB ( f ) * s xx ( f )
(4)
70
Where
w B ( f )
is the Fourier transform of Bartlett
60
(Triangular) Window
50
Not consistent
40
30 Var [
s xx
PER ( f ) s 2 xx ( ff )
] (5)
20
10
0
-10
0 500 1000 1500 2000 2500 3000 3500 4000 4500 5000
Samples
In order to reduce the periodgram variance, Bartlett proposed the following method.
Divide the original spectrum into K non overlapping segments.
Take the period-gram estimate of each segment.
s BAR ( f )
Average the K Periodgram do get xx
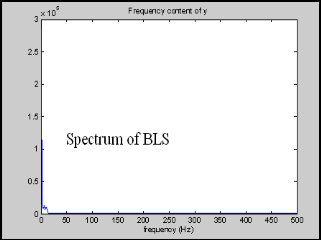
The power spectrum density of the interpolated baseline segments will be obtained to find out the frequency range
The result is a reduction of frequency resolution by a factor
K and a reduction of variance by approximately K.
IJSER © 2011 http://www.ijser.org
International Journal of Scientific & Engineering Research, Volume 2, Issue 11, November-2011 5
ISSN 2229-5518
The Blackman-Tukey method used a windowed version of
auto correlation function thus minimizing the unreliable estimate at large lags, k;
The classical Butterworth filter is obtained when N=L. Note
that
1
![]()
Estimate the autocorrelation function. ![]()
Window rxx [k ] with lag window
![]()
H e j / 2 2
=F (1/2) =
(1 c.2
L N )
(7)
Calculate the Fourier transform.
In this PSD analysis, the cut off frequency of the BLS is 15
Hz. Figure 3(c) shows the power spectrum density of baseline segment.
It is clear that, c should be chosen so that this value lies between 0 and 1. Therefore, c must be greater than zero. To choose c to achieve a specified half-magnitude frequency is![]()
![]()
H (e j0 )
straight forward. The equation
x 1 cos
F(x0) =1/4 where .
=1/2becomes
Solving this equation for c, one obtain c=3
1 x0
L / x N
A high pass Butterworth filter of 3 db cut off frequency with stop band of 15 Hz is designed. Most commonly used method named; bilinear transformation can be followed for designing the IIR Butterworth filter..
The Butterworth filter is one type of digital filter. It is
designed to have a frequency response which is as flat as mathematically possible in the pass band. The frequency response of Butterworth filter is given in Figure 3(d). Another name for them is 'maximally flat magnitude' filters.
Let H (z) =B (z)/A (z) denote the transfer function of a digital filter. The degree on B (z) will be denoted by L+M, where L is the number of zeroes at z =-1and M is the number of remaining zeroes.
Frequency
The BLF filtering method using FFT spectral estimation followed by high pass Butterworth filter is found to be the best approach for baseline fluctuation filtering (fig 3e).
Assume
L N and M=0, then the rational function
![]()
F ( x) P( x)
Q( x)
is given by
F (x) =
1 xL
![]()
1 xL cx N
(6)
IJSER © 2011 http://www.ijser.org
International Journal of Scientific & Engineering Research, Volume 2, Issue 11, November-2011 6
ISSN 2229-5518
400
300
200
100
0
-100
-200
0 0.5 1 1.5 2 2.5 3 3.5
The standard deviation across different discharges is
calculated for every sample time; the resulting set of values is then averaged. Because of the above-mentioned normalization, F and N values will be in the range 0-1.
F measures the variability of the mean of the different discharges pertaining to the same MU along the EMG signal. Ideally, if BLF were not present, and if all discharges from the same MU were equal, F would be zero. When
400
300
200
100
0
-100
Samples
4
x 10
there is BLF, some discharges appear higher than others
and the value of F increases accordingly.
On the other hand, N measures the variability of amplitude values of a MUAP waveform throughout a MUAP train. N will be zero if no BLF is present and the discharges do not differ from each other. However, if the BL fluctuates, the amplitude of MUAP samples will vary from one discharge
-200
0 0.5 1 1.5 2 2.5 3 3.5
to another and N will increase according to this variation.
Samples
4
x 10
Table 1.1 shows the values of F and N corresponding to two
BLF removal methods.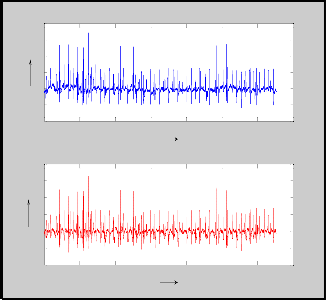
Quantitative Analysis
Quantitative explanation is required to compare the baseline removal methods. Baseline raises or lowers the mean level of a potential or of a portion of a potential, so the degree of waveform variation in the discharge in a MUAP train is increased by BLF.
Two quantities (F and N) are devised to measure the degree of BLF. They are calculated as follows.
1. All the single potential are manually selected and classified, by eye, on the basis of wave shape into several classes corresponding to different MUAP trains.
2. For each MUAP train, the corresponding discharges are time aligned so that Correlation between them is maximized.
MUs | Value of F for Raw EMG signal | Value of N for Raw EMG signal |
MU1 | 0.0257 | 0.207 |
MU2 | 0.0337 | 0.205 |
MU3 | 0.0388 | 0.1768 |
Let
Yk {yk (1), yk (2).............yk (nk )}
be the
discharge number k of the set of m discharges of a certain
MUAP train, where
yk (t)
Y
is the t sample of k
. Discharge
in Yk
are normalized dividing their samples values by the
technique.
maximum absolute value in the whole set.
The two proposed quantities are defined below.
F S.Dk (meant (Y1)..................mean(Ym ))
(8)
First the temporal mean of every discharge is calculated;
then standard deviation of all these means is computed.
N meant (s.d k ( y1 (t).................ym (t)))
(9)
Thus the degree of BLF cancellation provided by a given method on a certain EMG signal can be measured indirectly
IJSER © 2011 http://www.ijser.org
International Journal of Scientific & Engineering Research, Volume 2, Issue 11, November-2011 7
ISSN 2229-5518
by looking at the decrement in the signal’s F and N values.
BLF removal methods can be compared by direct computation of F and N parameters in the processed signal. For lower the F and N values, the lower the remaining BLF, and better the performance of method.
The performance of all these two method can also be classified on the basis of two parameters names: BL removal quantity and change in the originality of signal. In the sense of changes in the originality of signal, digital filter designing approach is efficient and reliable than statistical method, on the basis of the quantity of the removal of BLF, the statistical approach is descent one as compare to digital filter method.
Two methods have been proposed to remove the BLF in EMG records. It makes use of several signal processing techniques in a sequential fashion: Threshold calculation, EMG signal segmentation into BLS and AS segments, averaging and cubic spline interpolation of the BLS, AR frequency characterization of the interpolation curve, and final IIR filtering.
Two merit figures have been devised to measure the degree of BLF present in an EMG signal. Tests with real and simulated signals indicate the validity of these merit figures and demonstrate that they are sensitive to variations in BLF amplitude, and less sensitive to the BLF frequency distribution.
In the sense of changes in the originality of signal, the digital filter designing approach is efficient and reliable and on the basis of the quantity of the removal of BLF, the statistical technique is descent.
[1] Christodoulos I. Christodoulou, Constantinos S. Pattichis. “A New Technique for the Classification and Decomposition of EMG Signals” Christodoulou, C.I.; Pattichis, C.S.; Neural Networks, 1995. Proceeding, IEEE International Conference 1996.
[2] C.s. Pattichis, A. Elia, C.N. Schizas, “Classification
performance of motor unit action potential features” , 1994
IEEE, pp 1338- 1339.
[3] Craven, P. and Grace Wahba, (1979), Smoothing Noisy Data with Spline Functions: Estimating the Correct Degree of Smoothing by the Method of Generalized Cross- Validation", pp 377-403.
[4] C.S. Burrus, J.H. McClellan, A.V. Oppenheim, T.W. Parks, R.W. Schafer & H.W. Schussler. Computer-Based Exercises for Signal Processing Using MATLAB. Prentice- Hall, 1994.
[5] D.C. Preston, B.E. Shapiro, Electromyography and
Neuromuscular Disorders, Butterworth-Heinemann, Boston, 1998.
[6] E. Stalberg, S. Andreassen, B. Falk, H. Lang, A.
Rosenfalk, W. Trojaborg, Quantitative analysis of individual motor units potentials: a proposition for standardized terminology and criteria for measurement, J. Clin. Neurophysiol. (1986), pp 313–348.
[7] E. Stalberg, M.Sonno, assessment of variability in the
shape of MUAP, the “jiggle”, at consecutive discharges.
[8] Emmanuel C. Ifeachor & Barrie W. Jervis “Digital signal processing a Practical Approach” second edition (Publisher: Pearson Education Asia).
[9] I.Rodriguez-Carreno, A. Malanda Trigueros proposed
an approach for the segmentation of EMG signal, (2006).
[10] J. V. Basmajian and C.J.Deluca, “Muscles Alive, Their Functions Revealed by Electromyography”, Williams & Wilkins, Baltimore, fifth edition, (1985)
[11] Jhnjun Fang, Bhagwan T. Shahan, Francis “Estimation
of single motor unit discharges” pattern based on fractional
process on patient, (1995),pp 1327-132
IJSER © 2011 http://www.ijser.org