International Journal of Scientific & Engineering Research, Volume 6, Issue 1, January-2015 714
ISSN 2229-5518
Remote Microcontroller Based Monitoring of Substation and Control System through GSM Modem
Dr. Ghous Buksh Narejo
Associate Professor - Department of Electronic Engineering NED University of Engineering and Technology Karachi, Pakistan
ghousnarejo@gmail.com
Engr. Shahyan Pervez Bharucha
Department of Electronic Engineering
NED University of Engineering and Technology
Karachi, Pakistan
Engr. Danny Zarir Pohwala
Department of Electrical Engineering
NED University of Engineering and Technology
Karachi, Pakistan
Abstract— As complexity of distribution network has grown [7], automation of substation has become a need of every utility company to increase its efficiency and to improve quality of power being delivered [5]. The proposed project which is GSM cellular network based controlling of substation [5][12] will help the utility companies, by ensuring that their local-substation faults [8][9][10] are immediately realized and reported to their concerned departments via GSM, to ensure that duration of power interruption is decreased. The measured parameters will be sending in the form of SMS messages. The microcontroller will interact with the sensors installed at the local substation and perform task as commanded [3]. Electrical parameters like current, voltage will be compared continuously to its rated value [13] will help protect the distribution and power transformer from burning due to overload, short circuit fault, over voltages and surges. Under such conditions, entire unit is shut down via the control section comprising of relays sensing it, and immediately turning the circuit breaker off. SMS alerts can also be generated to indicate this. The use of GSM makes the substation intelligent [4] in the sense that it is able to transmit alerts and information and receive commands. This enables to reduce labor cost at substation and saves time. Thus the monitoring and working efficiency of the sub-station will drastically increase.
Index Terms— Serial Communication, transformer, Substation, Algorithm, Microcontroller, GSM, PIC 16F877A
—————————— ——————————
I. INTRODUCTION
A substation facility is a small building which contains transformers, switches, voltage regulators, and metering equipment that are used to adjust voltages and monitor circuits [14]. A substation is classified as: 1) Transmission 2) Distribution. The distribution side of substation is the major focus of the project. Since the power generated at the main stations is transported hundreds of miles using transmission lines before they reach the substations. A huge amount of power loss [15] is reported during the transportation of the generated power which leads to the reduction in the quantity of power received at the substations. Therefore, measurements must be acquired either at sending end stations and user end, to ensure quality of power supply is maintained continuously. The main objective of the project is to ensure that expensive equipment like power and distribution transformers are guarded against damages due to overloading and faulty conditions like short-circuit, surges etc. The transformer will
be continuously monitored by the designed monitoring and control system.
To achieve this objective a prototype model is designed for
“Microcontroller Based Substation Monitoring and Control System with GSM (Global System for Mobile Communication) Module”. The design is based on microcontroller 16F877A/18F452 [16][17] that monitors and controls the parameters like RMS secondary voltage of the distribution transformer, RMS secondary current of the distribution transformer, frequency of the supply, power factor, active and reactive power and complex power of the sub-station. The prototype modeling of distribution transformer (single phase) comprises of an autotransformer made of two step up transformers; one transformer being (220Vrms/0-260Vrms, 5.91Arms/ 5Arms, 1.3KVA) and other transformer being (280Vrms/330Vrms,
5.89Arms/5Arms,1.65KVA). The combination gave a secondary voltage of 0 to 330 Volts, on a primary voltage of
230 volts.
IJSER © 2015 http://www.ijser.org
International Journal of Scientific & Engineering Research, Volume 6, Issue 1, January-2015 715
ISSN 2229-5518
II. DESIGN
The design is composes of three sections:
a. Section-I The first section comprises of the microcontroller receiving electrical parameters at periodic intervals from the transformer through the sensors (the interval is set at the time of programming of the microcontroller). Parameter like voltage, current, frequency and angle are stored in the registers of the microcontroller and among them voltage and current are compared with the threshold values fixed, the threshold value for example could be taken as the rated values of the transformer; and dangers due to the overload and high voltage are sensed.
b. Section-II In the second section the analog parameters are converted to digital via analog to digital convertor (ADC) and transmitted via the GSM cellular network in the second.
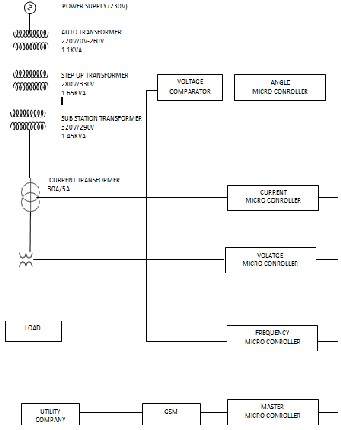
c. Section-III The third consist of the GSM receiver that receives the parameters and outputs to the concerned user on a mobile phone. The output can also be shown on a digital display connected to the output port of a receiver microcontroller at the main substation. This microcontroller can itself decide intelligently to shut down the sub-station via sending instruction commands if the condition is too severe or wait for the user to send commands via SMS message.
Fig. 1: Single In-Line diagram of the whole system.
III. MEASUREMENT PARAMETERS
A PIC microcontroller was utilized which was programmed to calculate the following parameters coming from the transformer:
a) Voltage Measurement: Voltage is measured by using the concept of a millimeter which measures voltage by connecting a resistor parallel to the load. This resistance is of very high value. This concept was utilized in the project.
A potential transformer of 300V/5V was used. Secondary
voltage of the potential transformer was applied on the potential divider made of a series combination of resistors of 1 ohm and 2.2 ohm. The use of the potential divider ensured that the voltage that had to be inputted to the microcontroller, never exceeded 5V which was the maximum analog voltage that the microcontroller could sense. In case of voltage exceeded 5V microcontroller would get damaged.
Vout=1000 *Vpt
1k+2.2k
Such a concept was used to create over voltage faults at the substation designed in the project.
The value of the resistor used in making the potential divider was found considering the maximum modeled voltage that would rise across the secondary of the potential transformer in case of over voltage faults.
The peak detector algorithm works by taking the equivalent voltage due to actual load current or the line voltage and converts it to digital by the build in ADC of the controller. The sampling rate is set in the programming. The sample are continuously measured, stored and compared to the previous one taken. The algorithm lets the program to proceed only, if the current value measured is greater than the previous value measured. One sample taken after the peak of the sinusoid is measured causes the current value to be less the previous, causing the program to terminate. Hence peak is measured. Rms value of voltage and current is calculated by using the formula:
RMS VALUE= PEAK VALUE / √2
IJSER © 2015 http://www.ijser.org
International Journal of Scientific & Engineering Research, Volume 6, Issue 1, January-2015 716
ISSN 2229-5518
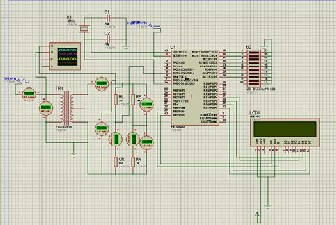
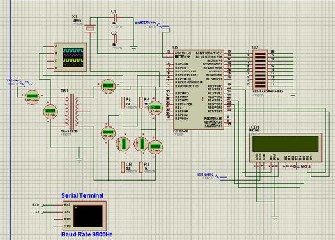
Fig.2: Voltage measurement simulation using proteus; Pt is modeled by a potential divider in the simulation.
b) Current Measurement: To measure the current value, initially it was decided to connect a current sensing resistor of 0.2ohms, 25 watts in series with the load. Voltage was measured across the current resistor and this voltage value was send to the controller as a input which was converted to digital through a build in ADC (Analog to Digital Converter) in controller. The controller processed the input and converted voltage received to actual current in the circuit.
But to ensure that the parameter measured was compatible with respect to its use in a substation so it was not feasible to use current sensing resistor in a substation. The alternative was to use a window type current transformer (30A/5A).An appropriate resistor was connected across the current transformer secondary winding, in order to get a perfect sinusoid voltage. The resistor used was determined by using the burden of the current transformer. After calculation, a 0.6 ohm,26 watts resistor was connected at the secondary of the current transformer .Current was measured quite accurately especially for load greater than 1 amperes.
The load chosen were two load banks consisting of 8 workable 100 watts incandescent bulbs each. Two bulbs were turned at a time. The current displayed on the LCD was compared to the current measured by the clamp meter. Load was increased by switching on two more bulbs and readings were noted and compared and the process was repeated. The readings obtained were quite accurate for loads that caused a current around 4 amperes to flow through the circuit. The secondary load of a current transformer is usually called the "burden" to distinguish it from the load of the circuit whose current is being measured. It was calculated as
P=I²R (where we have considered P=15W, I=5A)
so, we get R=0.6Ω
By this method we chose the value of resistor.
Fig 3:Current Measurement Simulation; ct is modeled by a
current resistor of 0.2 ohm.
c) Frequency Measurement: Frequency of the supply is measured by using the build-in timer of the microcontroller. The PIC 18F452 microcontroller has three build-in timers that perform very accurately. The idea behind frequency measurement was to use the microcontroller as a counter so that it might be able to count the number of pulses inputted to it. Thus there was a need to design a circuit that takes a sinusoidal ac signal as input and outputs digitized square waves. Also the designed circuit had to be ensured that it outputs square waves at frequency equal to that of the power supply.
The measurement of frequency is done by the use of the op-amp (LM741) as comparator. The problem was that the op-amp is not capable of working on such high voltages. To overcome this problem, there are two possible solutions.
1) Connecting the voltage comparator across the secondary of the potential transformer. This seems to be quite ideal as the maximum voltage at secondary of the potential transformer would be5V.The op-amp could work easily with these low voltages as compared to the high voltage at the primary of the potential transformer.
2) Connecting the op-amp at the primary of the potential transformer through a voltage buffer. The voltage buffer would isolate the high voltage side with the low voltage side. A photo-coupler ICPC817 can be used as voltage isolators (Viso=5000V rms).
IC PC817 can be utilized in such a way that it doesn’t only provide voltage buffering but also converts the high input voltage to square waves output, which has a logic 1 at 5volts. To accomplish this, the input induced was saturated on the transistor at 5V. This converted the high AC voltage to squares waves at same frequency as the input. These square waves were counted by the PIC18F452 to measure the frequency of the supply.
IJSER © 2015 http://www.ijser.org
International Journal of Scientific & Engineering Research, Volume 6, Issue 1, January-2015 717
ISSN 2229-5518
IC PC817 is also compatible to be used at the substation since the secondary single phase voltage of a normal distribution substation is 220 Volts, which is well below its maximum isolation voltage i.e Viso=5000Vrms. Even if this has to be used at the sending end substation connected to the generating stations, then a potential transformer could be used to keep the voltage applied to the PC817 within its maximum operating limit.
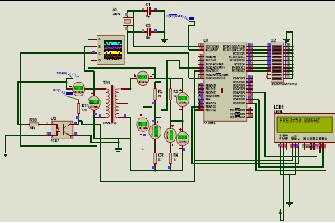
Fig.4: Frequency Measurement Simulation, frequency applied in transformer is 50Hz, frequency applied on the microcontroller is 50Hz.
d) Angle Measurement: The idea behind angle measurement was to measure time between the zero crossings of voltage and current ac signal. To make this possible, the voltage and current sinusoidal signals were converted to unidirectional square waves (by the use op- amp voltage comparator) and then Logic AND operation was performed. The voltage at the secondary of the potential transformer was applied at the non- inverting end of the op-amp, while the inverting end of op-amp was grounded. The sinusoidal voltage at the secondary of the potential transformer was compared to 0 Volts (the voltage at the inverting end of the op-amp). The output was bi-directional square wave of LOGIC 1 magnitude equal to the biasing voltage applied to the op-amp. The bidirectional square wave was then converted to a unidirectional one by using a germanium diode.
The signal achieved was a square wave in which both voltage and current waveform were present. Subtracting the time in which both voltage and current signal were ON from the time it took, for a the voltage or current signal to reach a phasor 90 degree (i.e. equal to 10ms if incoming frequency is 50Hz), would result in the time separation between the zero crossing of the voltage and current waveform.
The time between the zero crossings’ is then used to determine the phase angle. Along with the angle, “in phase”, “leading” or “lagging” condition was also determined, which helped in the calculation of the phasor values of current and voltage
Different loads (resistive, inductive and capacitive) were connected to measure the phase angle.
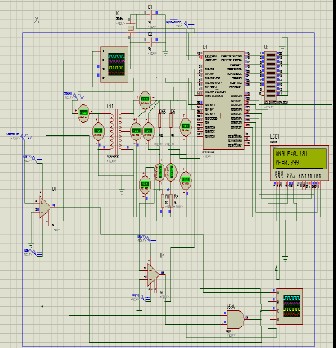
Fig. 5: Angle Measurement simulation with inductive load and power factor of 0.008.
Fig. 5: Angle Measurement simulation with pure resistive load and power factor of 0.9.
IJSER © 2015 http://www.ijser.org
International Journal of Scientific & Engineering Research, Volume 6, Issue 1, January-2015 718
ISSN 2229-5518
IV. SERIAL COMMUNICATION OF DEVELOPMENT BOARDS
Since voltage and current measurement required the use of a ADC and frequency and phase angle measurement required the use of a counter and a timer respectively, it meant that more than one development boards had to be used Therefore, four separate development boards were used so that the microcontroller is not over-burden. If it gets over-burden then the effectiveness and accuracy of microcontroller decreases considerably.
After measurement of each parameters mentioned above, the four boards are made to communicate with a master development board, which is interfaced with a GSM. The mode of communication between the four development boards and the master board was done serially.
Once, the master received frequency and phasor values of current and voltage , power factor apparent power, real power and reactive power was calculated.
Serial communication can be classified as follows:
Synchronous Communication
Asynchronous Communication
Asynchronous mode of serial communication involves data being transmitted and received without the use of separate clocks. Data can be sending with as few as two wires, one for data and one for clock line.
Synchronous mode of serial communication involves data being tied up by clock lines. It requires as few as three wires; one for data, second for clock and third for ground. Using parallel mode of communication would mean utilizing a lot of the ports of the controller.
For e.g., to transmit 255, would require using 8 pins or equivalently a complete port. Since PIC16F877A for example has 8 pins of port b, c, d (i.e. the digital port) , 6 pins of port a and 3 pins of port e (both analog), this would mean that to transmit a value would utilize a lot of pins, which would ultimately lead to all of the pins being used up. Therefore we avoid it and do serial communication.
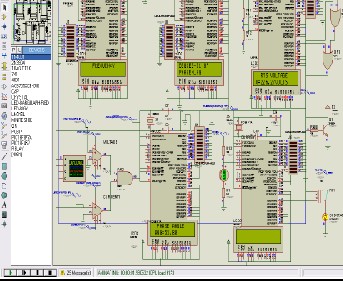
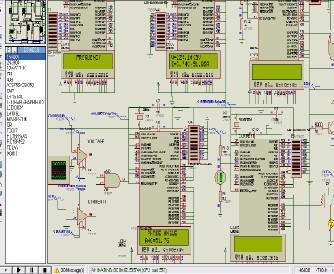
Fig. 6: Serial Communication between Four Development Board And Master: Voltage measured (top right), current measured (bottom right), frequency measured (top left), angle measured (bottom left).
Fig. 7: A lagging load connected. Note: the microcontroller (top and in mid) not only displays the angle but also indicates that it is a phase lag condition; Note: the master controller (top and mid one) displays phasor values of voltage and current.
V. DISTRIBUTION TRANSFORMER PROTECTION The protection of distribution transformer was achieved by
realizing a numerical relay. The same relay can provide protection against over voltage, under voltage, over current, over frequency and under frequency. A port pin of each controller is connected to an OR GATE. On occurrence of a fault or multiple faults, the same relay provides instantaneous protection. The relay operates in such a way that as soon as the threshold value of a parameter exceeds a set threshold value, this fault condition is sensed by the processor and it will activate the designated port (example port a.1) and this port will send a 5V signal to the relay causing the system to trip
IJSER © 2015 http://www.ijser.org
International Journal of Scientific & Engineering Research, Volume 6, Issue 1, January-2015 719
ISSN 2229-5518
down. The time of operation of the relay is dependent on time taken by circuit breaker. It is 0.2 seconds.
The relay was used in normally closed condition. The relay integration circuitry includes a diode IN4001 and a transistor
2N3904.
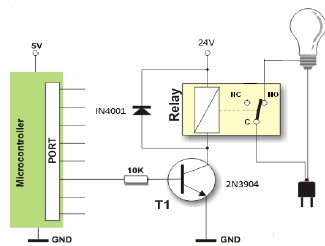
Fig. 8: Distribution transformer protection simulation.
Fig. 9: Schematic diagram.
VI. USIMG SIM 908 TO SEND SMS
Alert sms and parameters, such as frequency, active power, reactive power and power factor are send by the master development board to the desired destination in the form of sms, using the sim908 gsm [18].
To interface development board with GSM Modem following
circuitry is designed:
Serial communication circuit
RS232 is the electrical specification for the signals that PC serial ports use. Unlike standard TTL logic, where 5 volts is a logic 1 and 0 volts is logic 0, RS232 uses 12 volts for logic 1
and +12 volts for logic 0. This specification allows communication over longer wire lengths without amplification.
Most circuits that work with RS232 use a line driver / receiver
(transceiver). This component does two things: -
1. Convert the ±12 volts of RS-232 to TTL compatible 0 to 5
volt levels.
2. Invert the voltage levels, so that 5 volts = logic 1 and 0 volts
= logic 0.
51
By far, the most common line driver device is the MAX232 from Maxim semiconductor. The MAX232 is an IC that converts signals from an RS-232 serial port to signals suitable for use in microcontroller.
The transmit pin (R1out) of the line driver i.e. MAX232 is connected to the receive pin (RC.7) of the controller and similarly, the receive pin (T1in) of MAX232 is connected to the transmit pin (RC.6) of the controller.
The transmit pin (T1out) of the line driver i.e. MAX232 is connected to the receive pin (RX) of the RS232 and similarly, the receive pin (R1in) of MAX232 is connected to the transmit pin (TX) of the RS232. This RS232 port is then connected to the gsm , the ground of the controller, gsm and the line driver are all made common.
Fig. 10: Simulation of GSM system.
VII. CONCLUSION
The designed system is a step towards smart grid [4]. It basically resembles plc (power line communication) that is used as a communication platform for today’s smart grid networks around the world.
a) ECONOMICAL-Monitoring and control of substation which has been challenge for utility companies of Pakistan is made possible through GSM at most economical cost. Also by
IJSER © 2015 http://www.ijser.org
International Journal of Scientific & Engineering Research, Volume 6, Issue 1, January-2015 720
ISSN 2229-5518
realizing a single relay to function as a numerical relay, providing protection against over voltage, under voltage, over load, short circuit, over frequency and under frequency, causes the designed system to be very economical.
b) WIDE RANGE OF CONTROL- Te designed system provides easy control of remote substation. It enables two way communications. The substation can communicate with the utility company to indicate, with what type of fault, a substation has been associated. Te exact location of the substation can also be determined by sending location coordinates of the substation, acquired by Simcom modem used (a possible future extension to this project).The SimCom modem also has a gps engine in addition to gsm. This permits the utility company to immediately pinpoint the particular substation that has become faulty. On the other hand, a person in the utility company can also remotely control the substation.
c) RELIABLE POWER SUPPLY- Periodic measurements of parameters can help utility companies to provide better, reliable power with less outages and interruptions.
d) INCREASE OF POWER EQUIPMENT LIFE- The continuous scan of expensive equipments like transformer can increase its working life.
e) LESS STAFF REQUIRED- No need of labor at the substation in the presence of intelligent substation.
f) DATA ACCESS AROUND THE GLOBE- The parameters could also be made available on cloud so that utility
companies can access data from anywhere around (a possible
future extension that can be done, wit this project).
REFERENCES
[1] Overbye and Weber, "Visualization of power system data", in proceedings of 33rd Annual Hawaii International Conference on
System Sciences, January 2000.
[2] Remote Monitoring System for Transformer Substations by Timo T. Vekara Member IEEE, Seppo Pettissalo and N. Rajkumar IEE
[3] An Efficient Monitoring of Transformers Using Microcontroller Based System, K. Raja Saranya and K. Ram Prasad, Bonfring International Journal of Man Machine Interface, Vol. 2, Special Issue 1, February 2012.
[4] Substation Automation for the Smart Grid, white paper, Cisco. [5] Microcontroller Based Substation Monitoring and Control
System with Gsm Modem Amit Sachan Department of Energy
& Power Engineering NIMS University, Jaipur, Rajasthan OSR Journal of Electrical and Electronics Engineering (IOSRJEEE) ISSN: 2278-1676 Volume 1, Issue 6 (July-Aug. 2012), PP 13-21 www.iosrjournals.org www.iosrjournals.org 13 | Page.
[6] An Enhanced Approach for the Power System Course Using a Computer-Based Visualization Tool for Steady-State Power System Simulation by Dr. Jung-Uk Lim, Arkansas Tech University, ASEE International Forum, June 22, 2013.
[7] Jyotishman Pathak, Yuan Li, Vasant Honavar and James D.
McCalley, "A Service-Oriented Architecture for Electric Power Transmission System Asset Management", In ICSOC Workshops, pp: 26- 37, 2006.
[8] Chan, W. L, So, A.T.P. and Lai, L., L.; “Interment Based Transmission Substation Monitoring”, IEEE Transaction on Power Systems, Vol. 14, No. 1, February 1999, pp. 293-298
[9] Par S. Tenbohlen,T. Stirl, M. Rösner,” Benefit of sensors for on- line monitoring systems for power transformers”
[10] T. D. Poyser, "An On-Line Microprocessor Based Transformer Analysis System to Improve the Availability and Uti'lization of Power Transformers". IEEE Trans. On Power Apparatus and Systems, Volume PAS-102, April 1983, pp.957-962.
[11] Leibfried, T, “Online monitors keep transformers in service”, Computer Applications in Power, IEEE, Volume:11 Issue: 3 , July 1998 Page(s):36 -42.
[12] Abdul-Rahman AI-Ali, Abdul Khaliq & Muhammad Arshad,” GSM-Based Distribution Transformer Monitoring System”, IEEE MELECON 2004, May 12-15,2004, Vol 3 Pages-999-
1002, Croatia
[13] Wang.M, Vandermaar A.J and Srivastava K.D, “Review of condition assessment of Power Transformer in service”, IEEE Electrical insulation magazine Vol: 18, No.6, pp 12-25, Nov- Dec 2002.
[14] Simens Energy Sector, Power engineering guide edition 7
[15] Narong Mungkung, Nittaya Gomurut, Tanes Tanitteerapan
,Somchai Arunrungrusmi, Weerachai Chaokumnerd and
Toshifumi Yuji Department of Electrical Technology Education
King Mongkut’s University of Technology Thonburi,Bangkok Dhurakij Pundit University, Bangkok THAILAND. Faculty of Education and Culture, University of Miyazaki JAPAN. “Analysis of Technical Loss in Distribution Line System” Proceedings of the 8th WSEAS International Conference on Telecommunications and Informatics
[16] “PIC Microcontrollers”, www.microchip.com/pagehandler/en- us/products/picmicrocontrollers
[17] “PIC-16F87XA
datasheet”,www.microchip.com/downloads/en/DeviceDoc/3958
2C.pdf
[18] “Sim908” http://wm.sim.com/producten.aspx?id=1024
IJSER © 2015 http://www.ijser.org