International Journal of Scientific & Engineering Research, Volume 4, Issue ŗŖ, ber-2013
ISSN 2229-5518
131
Poincare Plot Used as a Confirmative Tool in Diagnosis of LV Diastolic Dysfunction for Di- abetic Patients, with and without Hypertension.
Manjusha Joshi, Dr.K.D.Desai, Dr.M.S.Menon
Abstract— The clinical symptoms of myocardial ischemia and infarction are not observable at an earlier stage. Early diagnosis of the same is very crucial to avoid sudden cardiac deaths. Left ventricular dysfunction is a common pathway to various cardiac disorders. Left ventricular dysfunction resulting into inefficient pumping of the oxygenated blood further causes structural and functional changes in the heart. The paper proposes an early, safe, easily deployable, cost effective and non-invasive technique that can be used as confirmative diagnostic tool obtained from 2-lead ECG sample collected for 3-5 minutes duration that diagnoses left ventricular dysfunction. The proposed index derived from Poincare plot of RR interval provides a guideline to the echo-cardiologist and saves his time and also controls inter operator diagnostic variation. Also the test can be performed by paramedical personnel saving the echo-cardiologist’s time. The proposed paper lists the results of index of control group, hypertensive subjects and hypertensive and diabetic subjects. The index value is found to match the Left ventricular dysfunction diagnosed from echocardiogram findings.
Index Terms— Myocardial ischemia, myocardial Infarction, left ventricular diastolic dysfunction(LVDD), heart rate variability,nonlinear HRV
tool,Poincare plot and standard descriptor.
1 INTRODUCTION
—————————— ——————————
ardiovascular disease is the world's leading killer, ac- counting for 16.7 million or 29.2 per cent of total global deaths in 2003. The World Health Organization (WHO) estimates that 60 per cent of the world's cardiac patients will be Indian by 2010 [1]. Also it has been found out that India has more number of cardiovascular deaths claiming younger population than in America [1]. The major reasons contributing to sudden deaths are due to myocardial in- farction (commonly known as heart attack). Myocardial infarction is the most commonly found episode in sudden casualty. The paper addresses a novel and simple method to diagnose the myocardial ischemia/infarction at an early stage and also diagnoses the left ventricular dysfunction without performing the echo cardiology test. This also es- tablishing an analogy between ECG signal analysis and
echo cardiogram results.
The paper is organized as follows-
Section I provides an overview of symptoms physiology and prognosis of myocardial ischemia/infarction.
Section II emphasizes on the etiology of left ventricular dias- tolic dysfunction and the need of early diagnosis of the same.
Section III describes the concept of HRV, it’s significance and
methods of HRV analysis used in the proposed paper.
Section IV describes further details of Poincare plot and it’s
significance.
Section V describes about the proposed method, modification of Poincare plot technique and it’s significance.
Section VI specifies the algorithm for the modified Poincare plot analysis used in diagnosis of LVDD.
Section VII describes about the results and findings of the proposed method.
Section VIII states about the further scope and future work. Section IX states the details of the references used for the pro-
posed method.
2. OVERVIEW OF MYOCARDIAL INFARCTION
Myocardial infarction is the necrosis of heart wall muscle due to reduced blood supply to the heart. This is a slow process and does not show any symptoms till the permanent damage has occurred. Therefore it is very essential that early diagnosis of the symptoms leading to onset on of myocardial infarction should be as quick as possible [2]. The beginning of myocar- dial infarction results in to the changes in ECG of the patient. But since ECG signals are highly subjective, the changes in ECG cannot be the confirmative diagnostic outcome. [3] Nor-
IJSER © 2013
http://www.ijser.org
International Journal of Scientific & Engineering Research Volume 4, Issue ŗŖǰȱ -2013
ISSN 2229-5518
132
mally the patient is further referred to other more specific
tests. Myocardial Infarction refers to damage or death (infarction) of heart muscle (myocardium). The damage results from the interruption of blood supply to part of the heart caus- ing heart cells to die. This is most commonly due to occlusion of a coronary artery following the rupture of a vulnerable atherosclerotic plaque, which is an unstable collection of lipids (cholesterol and fatty acids) and white blood cells in the wall of an artery. If left untreated for a long period, this leads to permanent death of heart wall muscle. Since heart wall expan- sion and contraction is essential for proper functioning of heart, the damage of the wall affects the functioning of the heart resulting in heart failure.[2] The type of infarction de- pends upon which part of the heart wall is damaged. The heart wall is mainly divided in three zones as shown in figure-
1.
The prominent types of infarction are –
1 Anterior infarction
2 Lateral infarction
3 Inferior infarction
Acquiring ECG is non invasive, safe tool that gives instanta-
neous results. The ECG of an infracted heart is different than that of a normal heart. The change in ECG is the dependent upon the location of infarct.[2]
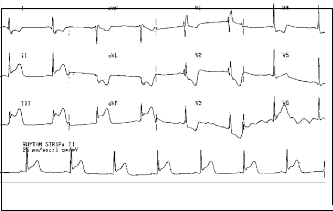
The anterior wall infarction can be properly represented by V1 to V4 and extending to V5-V6 leads. (Refer figure 2a)
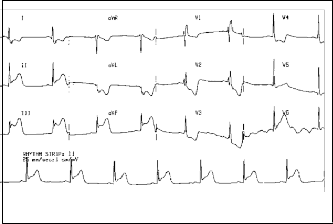
The Lateral infarction is identified by typical changes in Leads I, aVL and V5-6. Over all changes in ST segment can be the confirmative indication. These changes in the ECG can be compared to that with the normal ECG. (Refer figure 2c).
The Lateral infarction is identified by typical changes in Leads I, aVL and V5-6. Over all changes in ST segment can be the confirmative indication. These changes in the ECG can be compared to that with the normal ECG. (Refer figure 2c).
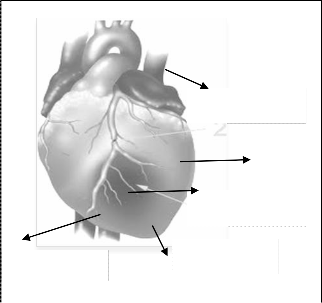
Figure 2a ECG of Inferior Infarction
Blocked artery
Lateral
wall
Infracted zone
Anterior wall Inferior wall
Figure 2b Required ECG leads representing Inferior Infarction

Fig. 1.Diagram of Heart showing wall,blockage and infarct
————————————————
 Manjusha Jsho is Research Scholar in biomedical signal processing in
MPSTME,NMIMS Univercity,Indi,E-email:mjmanjusha12@gmail.com
 Dr.K.D.Desai isDdirector Maharshi Parashuram College of engineering, Mumbai Univercity,India E-mail:kddesai@hotmail.com
 Dr.M.S.Menon is Consultant,Cardiology Department,Fortis-S.L.Raheja
Hospital,Mahim-W,Mumbai,India E-mail:drmsmenon@yahoo.com
IJSER © 2013
http://www.ijser.org
International Journal of Scientific & Engineering Research Volume 4, Issue ŗŖǰȱ -2013
ISSN 2229-5518
133
Step1-If subject suffers from progressive dyspnea and / noc-
turnal or decubitus dyspnea,
Step2-Check for evidence of effective left ventricular systolic function (Ejection fraction greater than 50%),
Step3-Check for evidence of LV diastolic dysfunction by eva- luating Mitral diastolic early/ late pressures and for evidence of raised LV filling pressure by Tissue Doppler at the Mitral annulus. (E/E’ is the ratio of maximal values of passive mitral inflow velocity to medial / lateral early mitral diastolic velocity indicating various grades of diastolic dysfunction).
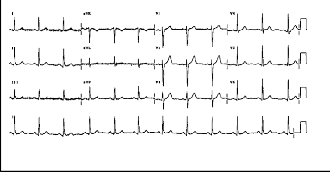
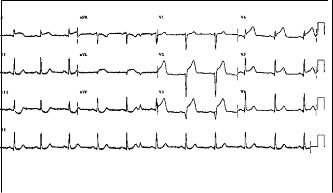
Figure 2c Required ECG leads representing Anterior Infarctionz
Figure 2d Normal ECG
3 LEFT VENTRICULAR DYSFUNCTION
The left ventricular dysfunction is often the root cause of many sub clinical and clinical cardiac symptom complexes. It causes to develop compensatory mechanisms that cause struc- tural and functional changes in the heart. In the presence of persisting ischemia, the myocardium undergoes changes re- sulting in thinning of the wall, alterations in wall stress and contractility and spherical remodelling from an original ellip- tical contour. Changes in contractility may affect concentric, longitudinal and also in the oblique/ rotational axis, constitut- ing left ventricular systolic dysfunction. Anatomic changes in chamber volumes due to aging, degeneration and disease may alter mitral valve flexibility and change the rates of LV filling in early and late diastole and may reflexely increase atrial pressures thereby affecting LV filling pressure. Such changes contribute to LV diastolic dysfunction and may be associated with apparently normal systolic function. This causes further complications as reduced mechanical efficiency and worsens the congestive heart failure.[3] Also left ventricular dysfunc- tion causes reflex activations of neuroharmonal axis further affecting the autonomous nervous system. The specific, safe, quick and non invasive diagnostic technique is the echocardi- ogram. The algorithm of diagnosing Left ventricular diastolic dysfunction by echocardiogram is as follows-
Step4- Check if PA pressure is raised (by PA systolic pressure
greater than 10 mmHg or RVSP > 40 mmHg by TR jet method. The figure 2 shows the variation of A/E and E/E’ in different stages left ventricular diastolic dysfunction.

Figure 3
4 OVERVIEW OF HRV ANALYSIS
The HRV is an old technique stated by Hales in 1956.The RR intervals of a healthy heart shows variation of greater extent compared to the impaired heart. A healthy heart is sensitive to physiological, physical and psychological changes in the body and it modifies the heart rate accordingly. It has been observed that the impaired heart has reduced the variation in the heart rate as the demanded by different activities of body. The nor- mal person’s ECG that shows more changes in the heart rate during different activities is compared to that of the patient with reduced heart rate variability (HRV). Figure 4 shows the HRV and the power spectral density distribution in case of sympathetic and parasympathetic intervention of a normal subject and a diabetic subject.[4]
The HRV analysis produces certain diagnostic indices that are obtained from spectral analysis of RR interval acquired for 3-5 minutes. The AR analysis represents three prominent frequen- cy bands VLF band -0.0-0.04Hz, LF band- 0.04-0.15Hz and HF band- 0.15 to 0.4Hz. The ratio of the peak power of the HF to LF band represents the sympathetic to parasympathetic bal- ance that provides an index stating the close loop response of
IJSER © 2013
http://www.ijser.org
International Journal of Scientific & Engineering Research Volume 4, Issue ŗŖǰȱ -2013
ISSN 2229-5518
134
heart. The ratio is increased if the normal subject is made to
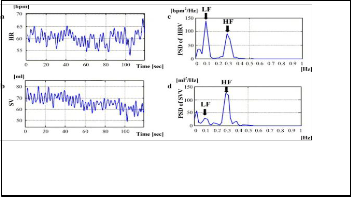
change the position from resting position. Whereas, in case of subject suffering from impaired or reduced HRV the ratio does not show a significant increase in the value as shown in the figure 4. This method diagnoses the orthostatic imbalance di- agnosed by modulated HF/LF ratio in case of subjects suffer- ing from impaired or reduced HRV. This test is a popularly used in literature of research though not used clinically.
Figure 4 RR interval and frequency analysis of RR
interval
But it suffers from severe limitations. There is a difference of opinions between researchers regarding the contributions of HF and LF band as to represent sympathetic or parasympa- thetic modulations.[3] Some researchers state that LF band represents the modulation of sympathetic activity and HF band represents the parasympathetic activity. Whereas some researchers state that HF band represents both sympathetic and parasympathetic modulation. Also the analysis assumes that ECG is a linear signal and it has been discussed and ac- cepted that ECG is a nonlinear signal.
5. POINCARE PLOT ANALYSIS.
The paper hence uses modified nonlinear HRV analysis using Poincare technique. This method of computing heart rate va- riability proposed in the above paper also takes into consider- ation the non linearity of ECG signal and hence is more accu- rate then the prevailing methods used in time and frequency domain techniques. [5]
The Poincare plot is a plot of RRi versus RRi+1 for all i€N-1 where data set of N RR intervals is considered. The Poincare plot is a visual tool and uses the ratio between standard de- scriptors for short term correlation (SD1) and long term corre- lation (SD2) between RR intervals to assess the health of the heart. It has been found that the peculiar shape of RR interval is not an artifact or mere placement of point but a specific temporal correlation between the successive RR intervals and hence prelates closely to the natural rhythm of heart as a re- sponse to many different complex closed loop systems con- trolling the heart.[5]
The shape of the RR interval distribution shows an elliptical pattern and the ratio of SD1/SD2 should be higher for a
healthy person. The shape of RR interval distribution is non-
eeliiptical pattern and ratio is much lower for a subject with impaired heart or reduced HRV. The typical cases of normal and impaired subject are as shown in the right panels of the figure (4). Their corresponding HR variations are also shown in the left panel of the figure 5.
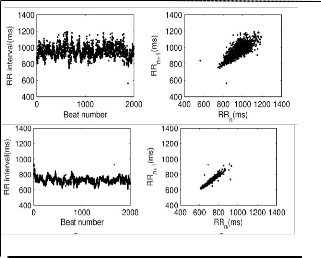
Figure 5 RR plot Vs.time and Poincare plot 
6. MODIFIED POINCARE PLOT ANALYSIS USED IN PROPOSED METHOD.
The paper proposes further division of SD1 into two new de- scriptors SD1up and SD1down that represent decelerations and accelerations of RR interval respectively. The line of π/4 slope i.e. y=x line in the Poincare plot represents the equal consecu- tive RR intervals. The RR interval points with increased heart rate are represented below the line and The RR interval points with decreased heart rate are represented above the line. There is a typical asymmetry found in all Poincare plots. This asym- metry finds correlation that can be explained physiologically that the parasympathetic power spectral densities are higher than the sympathetic power spectral densities [5].
7. ALGORITHM OF MODIFIED POINCARE PLOT ANALYSIS
1. Compute RR interval from the ECG sample acquired from the data acquisition equipment.
2. Compute the average RR interval.
3. Compute the deviation from the average value for all the RR
interval values.
4. If the corresponding RR interval is greater than average the resulting value is negative.Store it in array1.
5. Else if the value is positive, store it in array2.
6. Compute the average of the two arrays. The average of first array is the SD1up and the average of the second array is SD1down
7. Compute the ratio of the two for all the datasets of the ECG
acquired.
IJSER © 2013
http://www.ijser.org
International Journal of Scientific & Engineering Research Volume 4, Issue ŗŖǰȱ -2013
ISSN 2229-5518
135
It has been observed that for all the datasets the ratio gives the
values that matches with the physiological analogy. Further it can be stated that in case of modulated autonomous nervous system the ratio is found to be much higher. This statement of observation also finds suitable reinforcement from the physio- logical fact that in case of reduced heart rate variability it has been found that parasympathetic activity is predominant. Hence the SD1down index has higher values and the ratio is de- creased. The results are correlating with the above stated fact. Also the increase in this ratio correlates with the evidence of LV dysfunction. LV dysfunction is an abnormality that results due to myocardial ischemia/infarction. So the paper also pro- vides information to the cardiologist about the left ventricular performance without performing echo cardiology test.
8. RESULTS AND DISCUSSION
Study was carried out 30 control group varying in age.sex and economic class and 22 subjects suffering from hypertension with and without diabetes. All the cases were recorded at Fortis- S.L.Raheja hospital Mahim (W).Care was taken that the duration of diabetes and hypertension was at least 5 year old.
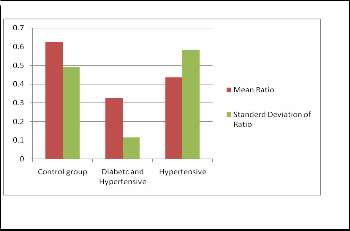
As it is clearly seen in figure 5, all the subjects examined are observed to have lower ratio values compared to that of con- trol group were also observed to suffer from LVDD from their echocardiogram reports. The results are tabulated in the form of bar chart shows that the ratio values are higher for control group (0.6268 + 0.4933) and significantly low for diabetic group (0.3262+ 0.1158) for patients suffering from diabetes and hypertension and (0.4262 + 0.5820) for patients suffering from hypertension. From figure 5, it can be observed that ratio values are lower for diabetic and hypertensive patients com- pared to hypertensive patients. This observation can be ex- plained as the presence of diabetic neuropathy in the patients suffereing from diabetis and hypertension which leads to compromised neuro-harmonal balance. It can be seen that deviation is more for hypertensive patients.The reasonn pa- tients suffering from LVH are also found to have LVDD are also included.Such patients had a very low value of the ratio than the patients suffering from LVDD alone. This may be due to the fact that age group scatter was more for the hyperten- sive patients.
9. FURTHER SCOPE
More work can be done by taking more samples and results and discussion can be further more confirmative. Also it is possible to explore more by taking different time interval windows of myocardial infarction. More analysis is also possi- ble if one takes ECGs specific to one disease and actual patient data.
Figure 5 Data samples from S.L.Raheja Hospital
10. REFERENCES
*1+“cardiovascular disease trends in India”
www.expresshealthcaremgmt.com/20041215/criticare06.shtml.
*2+”ECG Signal analysis used as confirmative tool in quick diagnosis of Myocardial Infarction.” Manjusha Joshi, Dr. K.D.Desai,International Jour- nal Scientific engineering and research Vol.3 March-2012.
*3+”Left Ventricular dysfunction: causes,natural history and hopoed for
natural reversal”Paul W.Armstrong,Heart 2000,:84(suppl I):i15-i17.
*4+”Comparison of HRV analysis methods during orthostatic chal- lenge:HRV with respiration or without?”Benhur Aysin,member IEEE,Joe Colombo, member IEEE, and Elif Aysin,EMBS Cite’ Internatioale’ Lyon France,August 23-26 2007.
[5] “Geometry in Poincare’ plot of RR intervals and it’s asymmetry in healthy adults”, J Piskorski and P.guzic Physiol. Meas.28 (2007) 287-300
*6+”Sstandard of measurement,physiological interpretation and clinical
use” , American The North ,Guidelines,European heart journal(1996)
17,354-381.
IJSER © 2013
http://www.ijser.org