International Journal of Scientific & Engineering Research Volume 2, Issue 10, Oct-2011 1
ISSN 2229-5518
Phonocardiography–the future of cardiac auscultation
M.Vishwanath Shervegar, Ganesh.V.Bhat,Raghavendra M Shetty K
Abstract-This paper presents a novel method of phonocardiogram acquisition, recording and analysis. The PC/laptop is a host of software that provide complet e analysis of heart sounds. Different signal processing t echniques such as filt ering, wavelet analysis, and spectrum are used to analyse the various components of heart sound.
Keywords-Phonocardiography, Wavelet Analysis, Quadratic throat horn, Bluet ooth technology, Stethoscope, Spectrum, Spectrogram
—————————— ——————————
I. INTRODUCTION
Phonocardiography is the study of heart sounds. The study of heart sound dates to history. Most of the stethoscopes were acoustic in nature with very less sound amplification. With advent of technology the transition took place into electronic and the more powerful digital- electronic stethoscopes. However these stethoscopes were wired in nature which made them cumbersome. As new technologies began to arise, which were now wireless, they replaced the existing wired technologies.
The Acoustic and the Electronic stethoscopes are widely prevalent in the current market. A fewer number of companies produce stethoscopes each with their unique features. The acoustic stethoscope has had no significant changes since the late 1800’s.Whereas the electronic stethoscope has had vast changes in its structure and functionality since its evolution. The popular companies that manufacture stethoscopes are the 3M Littman, Welch-Allyn and Think-labs. Littman offers a wide variety of acoustic, electronic and recordable stethoscopes. The Littman electronic stethoscope is being used in most of the developed countries.
Welch-Allyn's Meditron stethoscope comprises
placement of a piezoelectric crystal at the head of a metal shaft, the bottom of the shaft making contact with a diaphragm. Whereas the 3M Littman uses a piezo-electric crystal placed within foam behind a thick rubber-like diaphragm.
Think-labs use a stethoscope diaphragm with an
electrically conductive inner surface to form a capacitive sensor. This diaphragm responds to sound waves identically to a conventional acoustic stethoscope, with
changes in an electric field replacing changes in air
pressure. This preserves the sound of an acoustic stethoscope with the benefits of amplification. It uses an iPod for recording and playback.
E-scope electronic stethoscope and the PDA Pocket PC
Ipaq hp5550 have three main controls: on/off, Bell/diaphragm and volume. The connection between the electronic stethoscope and the Pocket PC is established using a regular audio cable, mono output (from the stethoscope) and stereo input (to the Pocket PC). The Pocket PC screen can be activated by using either the stylus or fingers. The latter option is best suitable for the case of recording since the clinician will have one hand busy (holding the stethoscope) leaving the other one free for holding the Pocket PC and to press the button record. The light weight of the PDA Pocket PC (7.6 Oz) allows the physician to hold it for long periods of time without getting tired. In case the Pocket PC no longer needs to be used, the physician can wear it on the Pocket PC belt case and perform routine tasks without carrying the PDA all the time. Also, the long period of battery charge (average of 8 hours of permanent use/day) leaves noroom for concerns when autonomy is the issue. The system is capable of recording and displaying heart sounds data. Acquisition is done using the electronic stethoscope with its analogue output connected to the microphone input of the Pocket PC. The sound format is fixed at 8 KHz, mono,
8 bit resolution. However, the system isable to read any other file with a different sound format as longas it is in the mono format. The display limit is fixed to automaticmode, which means the display will show as much data as have been loaded. The end-user can modify some of the settings for more convenience, otherwise default settings are applied.
IJ SER © 20 11 http://www.ijser.org
International Journal of Scientific & Engineering Research Volume 2, Issue 10, Oct-2011 2
ISSN 2229-5518
Zooming enables and defines the level of focus on graphs in PDA applications. Zoom style defines the type of zooming to perform. Heart sounds data can not only be acquired and saved, but also can be viewed, processed and classified. By just pressing either the openor savebutton a dialog window displays where the user chooses the file to be read from or saved into, respectively. The only requirement is that the file should be in .wav format and the sound quality is mono. Data manipulation and analysis built into the system are subdivided into:
A) Filtering
B) Amplitude and Power Spectrum
C) Heart Sound Segmentation D) Vector of Powers Formation E) Classification
Blue-stethsystem provides the technical means for
enhancing the functionality of a typical stethoscope when bio-acoustic signals (BIOS), i.e., lung, heart, and bowel sounds, are used for monitoring patient’s pulmonary, cardiovascular, and intestinal status, respectively. Blue- steth system revolutionizes the BIOS auscultation by employing a Bluetooth-based stethoscope. It consists of a User Interface (UI), which resembles the structure of the stethoscope, and a Central Control Unit (CCU). The UI is integrated with Bluetooth technology providing wireless interface between the physician and the CCU. The UI comprises of an electronic stethoscope connected to a Bluetooth-enabled hands-free set, combined with a Bluetooth handheld device (palmtop), and is used by the physician in the patient’s bedside. On the other hand, the CCU consists of a database, which stores medical information in a database server (i.e., an ordinary PC in the hospital’s central archive room), and a dedicated software that handles Bluetooth-based connectivity, voice-commands recognition/control, accessibility, security, storage, and data analysis requirements, remotely. Identification (ID) codes assigned to each of the physicians and adequate user-profiles on the CCU side provide necessary data personalization so different physicians can use a single mobile device. The tasks of the mobile UI are to maintain Bluetooth connections, to acquire the Bios and transmit the recorded data over the wireless connection to the CCU, and to provide the physician with: a) enhanced quality in the auscultation of the BIOS, b) patient’s archive information, c) Bios recordings archive information, d) visualization of the
acquired BIOS (with or without analysis), and e) voice- command verification (i.e., insertion/validation of user ID, patient ID, recording position ID) and control of the recordings (i.e., record, play, stop, delete, etc). The CCU maintains the other side of the Bluetooth connection, handles multiple, simultaneously connected to the server, users, and, for each one of them, buffers incoming BIOS data, performs real-time time-frequency and de-noising analysis of BIOS, returns the results of the BIOS analysis for increased quality in the auscultation and a BIOS spectral characteristics identification, records the incoming and the analysed BIOS for further exploration, and provides visualization interface.
In India too, the development of electronic stethoscope
has taken a long stride. Stethtron was one of the earliest stethoscopes developed in modern times. It comes in two models LG 300 and HG 900.

Electronics and Communication Engineering Department, Visvesvaraya Technological University,Canara Engineering College, Benjanapadavu, Jodumarga Post, Bantval, Karnataka, INDIA-574219
vishwa@hotmail.co.in
IJ SER © 20 11 http://www.ijser.org
International Journal of Scientific & Engineering Research Volume 2, Issue 10, Oct-2011 3
ISSN 2229-5518
ganeshvbhat@yahoo.com ritikaraaj@gmail.com
II. METHOD INVOLVED IN PHONOCARDIOGRAPHY
constant directivity horns is that they have a straight- sided conical flare for a large section near the mouth. Keele in 1975 showed that such a horn has a constant directivity above a particular frequency given by F = kk /
(θ * w)[6]; where θ= included wall angle, kk = 25.306 x 10³
and w = mouth -width (meters). The range of operating frequencies is 20Hz-1000Hz. So the sampling frequency is
H/PMono
O/P
Mic I/P
2 kHz. But the sound card sampling frequency is 8 kHz-
48 kHz, which means, the minimum cut off frequency is 8 kHz. Therefore for F=8 kHz we have w = 40mm, θ= 79°
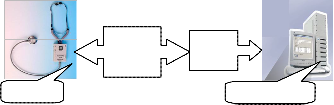
Steth PC Server
Fig.1 Block diagram of the presented technology
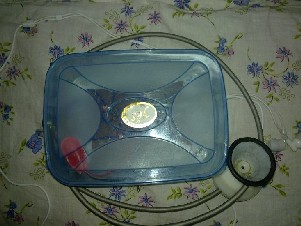
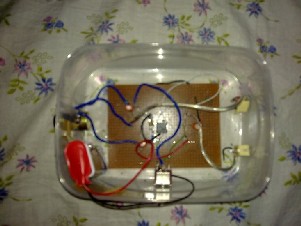
Fig.2. Photo of the presented technology
The above presented technology has the following embodiments-the electronic chest piece, the amplifier circuit, and a laptop/PC. The electronic chest piece houses a SONY ECM microphone. The chest piece is connected to a pre-amplifier circuit. The pre-amplifier circuit is a mono type and provides a sound amplification of 4701X. The design of the chest piece and the pre-amplifier circuit is shown below. The sound is recorded in the .wav format in the PC using Goldwave. Matlab software performs various signal processing operations such as filtering, wavelet analysis, spectrum etc.
1. Electronic chestpiece:
The chest piece is shown in Figure 6. The chest piece uses a constant directivity horns (figure 4)[4].A property of
and y= 24mm. In 1977 Henricksen & Ureda introduced what they called the Manta-Ray horn. It was named for its shape. This horn had good loading as well as good directivity control. However, it did suffer in some areas. One in particular was that it had rather severe
astigmatism in the curvature of its wave front. Put simply, the radius of curvature for the wave front is different for the horizontal and vertical planes. In addition to the astigmatism, these types of horns suffered in other areas as well. The slowly expanding exponential section can tend to cause distortion as high sound pressure levels are reached. The discontinuities in some of the horns, where the sections are connected; can cause reflections back down the horn that can be problematic. Thesediscontinuities also cause diffraction, which introduce another set of distortion products. Walls that are parallel, or nearly parallel, in the throat section of some of these horns can lead to unwanted resonance conditions. A solution was sought for the astigmatic wave front that is typical for conventional constant directivity horns. Since this problem is caused by a horn having different points from which the wave front appears to originate in the horizontal and vertical planes, one must simply make the point the same for both coverage planes. This point was located in the centre of the throat entrance to the waveguide as shown in figure 4. The challenge now was how to join the required throat diameter to the straight walls of the required design coverage angles. A circular arc turns out to perform this function quite nicely. This arc is from a point on the perimeter of straight wall of the waveguide. The radius of the arc is such that one end of the arc is tangent to the straight wall at one point while the other end of the arc is perpendicular to the plane of the throat at the perimeter of the throat entrance. This can be seen in figure 4. The new waveguide can be thought of as being constructed in
distinctly separate, but joined sections. The first section is
IJSER © 20 11 http ://www.ijser.org
International Journal of Scientific & Engineering Research Volume 2, Issue 10, Oct-2011 4
ISSN 2229-5518
the throat section that is comprised of the connecting arc described above. The last section is comprised of straight walls in order to obtain the desired directional properties. Since different coverage angles are typically required for the horizontal and vertical planes, the throat section becomes subdivided into two sections. The first of these sections will be where, in both the horizontal and vertical coverage planes, the wall shapes are defined by the connecting arcs. The second of these sections will be where only one of the coverage planes, either horizontal or vertical has a connecting arc to define its wall shape. The other coverage plane in this section has its wall shape defined by a straight wall at the design coverage angle.
Fig.3.Quadratic throat horn
Fig.4 Diagram of conical horn
To analyse the new design, equations [4] describing the cross sectional area expansion within the throat section had to be developed. A relationship between known design parameters and the connecting arc, r, was also needed. To simplify matters we will only concern ourselves with the axis symmetric, or circular, case for the
time being.


-1) (1)
Typically r =17mm for 10mm throat.
Equation (1) gives us the relationship between the radius of the connecting arc, r, the throat diameter, yt, and the design coverage angle, [].
In the expression for the height, or diameter, within the throat section, let h be the incremental height difference from the throat entry diameter, yt, and the waveguide boundary.

(2)
Equation (2) gives us an expression for the height within the throat section of the waveguide. We may now proceed to the derivation for the cross sectional area expansion.


)2


(3)


Equation (3), while not in the classical form of a quadratic equation, does possess the traits of having an x2, an x and a constant term. As such, this new waveguide design has been dubbed a Quadratic Throat Waveguide.
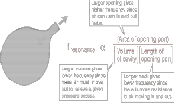
An air cavity will exhibit a single resonant frequency. If extra air is pushed into the volume and then released, the pressure will drive it out. But, acting somewhat like a mass on a spring which is pulled down and then released, it will overshoot and produce a slight vacuum in the cavity. The air will oscillate into and out of the container for a few cycles at a natural frequency. The qualitative nature of the frequency determining factors:

IJSER © 20 1 http ://www.ijser.org
International Journal of Scientific & Engineering Research Volume 2, Issue 10, Oct-2011 5
ISSN 2229-5518
Fig 5 Cavity Resonance
Actually the frequency depends upon the square root of these factors and also upon the speed of sound. A quantitative analysis of the cavity resonance gives the frequency expression [4]


Fig.7b Photo of preamplifier circuit

A= 0.0314cm2 v=34300cm/s V=16.7552cm3 L=3cm fr=136
Hz
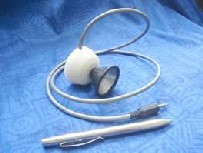
Fig.6 Chest piece
2. Amplifier circuit:
Fig.7a Pre-amplifier circuit
The microphone preamplifier circuit is shown in fig.7a & b that uses an ultra-low noise preamplifier LT1115CN8 IC [3]. The 10kΩ resistor provides the phantom power supply for the mic input. Two capacitors 2.2µF are connected
across the input and output as coupling capacitors. They
block the dc from reachingthe output and the input respectively. Two 27kΩ resistors along with 10kΩ resistors give an input impedance of 6kΩ. The non- inverting input (pins 3 and 5) is brought to half the

supply by the two 27k resistors forming a voltage divider network. The silicon transistor inside the op-amp conducts only above a cut-in voltage of 0.7V. This may clip the part of the mic signal below 0.7V. The voltage divider circuit reduces the cut-in voltage thus giving the base current even for low signal conditions. The gain (1+ is adjusted by using two resistors Rf = 470kΩ and R1 = 100Ω to 4701. A 1µF capacitor is used for setting high
frequency roll-off and reduce hum.The 10µF capacitor
blocks the dc. The output impedance is 10kΩ pot (volume control) plus 100Ω resistor. 50µF is a power supply capacitor and the circuit runs on a 9V battery with switch
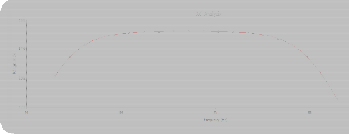
control.The frequency response of the circuit is shown below obtained by simulating the circuit on National Instruments Multisim 10.
IJSER © 20 11 http ://www.ijser.org
International Journal of Scientific & Engineering Research Volume 2, Issue 10, Oct-2011 6
ISSN 2229-5518
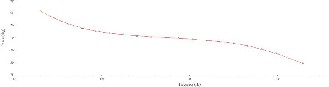
Fig.8 Magnitude and Phase response
3.Laptop/PC:
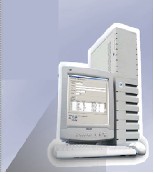
Fig.12 PC
The preamp circuit is connected to laptop/PC. All types of signal processing operations including wavelet transform and filtering can be implemented using it. The PC is a host of softwares like Matlab, Sigview, Goldwave, Multisim etc. The audio file is usually recorded in .wav PCM 16 bit unsigned integer format as a database for future work. The audio files form the primary database consisting of both normal and pathological sounds.
III. HEART SOUND ANALYSIS: Results
Mat-Lab is a mathematical tool used for acquiring and analysing various signals both in time and frequency domain. The conventional Fourier-based spectral analysis of heart sounds provides the basic frequency components of these signals, but the timing information between these components is lost and it is impossible to specify when a particular event occurred. Consequently, it is essential to use transforms that provide temporal as well as frequency domain information.
A common approach for estimation of time varying spectra of heart sounds is the short-time Fourier transforms (STFT) or spectrogram. In this method the heart sound signal is subdivided into a number of small records where it is assumed that each sub-record is stationary. To reduce the leakage effect (due to finite record length), each sub-record is multiplied by an
appropriate length window and then the FFT-algorithm
is applied to each sub-record. As long as each sub-record does not contain rapid changes, the spectrum will give an excellent idea of the spectral composition of the signal. However, there are signals whose spectral content changes so fast that finding an appropriate short-time window is problematic since there may not be any time interval for which the signal remains stationary. To capture the fast changes, it is necessary to keep the length of the time window as short as possible. This, however, will reduce the frequency resolution. Hence there is a trade-off between time and frequency resolution in this method.
To address this conflict between time and frequency resolution, wavelet transform is used. This is a windowing technique with variable-sized window time. Wavelet analysis allows the use of long time intervals where more precise low-frequency information is required and shorter time intervals when high frequency information is necessary. This simply means as the frequency increases the length of the window decreases, and as the frequency decreases the window length increases, thereby the time window always contains the same number of signal cycles.
To observe and compare the effectiveness of these signal processing methods on heart sounds, two examples are considered: 1) a normal heart sound, 2) a heart sound generated due to Rheumatic heart disease (caused by abnormal S1). The heart sounds are collected from normal and suffering patients. Figure 14 shows a normal heart sound (a), the spectrum of the normal heart sound (b), its
2D spectrogram (c), the contour of the spectrogram (d), its
2D wavelet transform (e), and the contour of the wavelet transform (f). Figure 15 shows the same information for a pathological heart sound caused due to Rheumatic heart disease.
Previous studies have shown that the Morlet wavelet is
the most suitable analysing wavelet for time-frequency analysis ofthe phonocardiogram to extract the more exact features of the heart sounds S1, S2, and heart murmurs. Therefore, the Morlet wavelet was selected for calculation of the continuous wavelet transform shown in Figure 14e. It is observed that in spite of the similarity between the contours in Figures 14d and 14f, the latter provides more detailed and accurate information compared to the former. Figure 14d shows frequency components almost at zero Hz, while Figure 14f shows that there are no significant frequency components (scales) below 45 Hz.
IJSER © 20 11 http ://www.ijser.org
International Journal of Scientific & Engineering Research Volume 2, Issue 10, Oct-2011 7
ISSN 2229-5518
Note: Scales have been converted to corresponding frequencies shown in fig 15(g) using matlab. For example
45 Hzcorresponds to a scale of 398 as shown in pink line
in fig 15(g). It is clearly noticed that this discrepancy in Figure 14d is due to the time-frequency trade-off in the spectrogram. The wavelet transform contour is in close agreement with the frequency components shown in the frequency spectrum of the heart sound. Similar observations can be made in Figure 15(a-f).
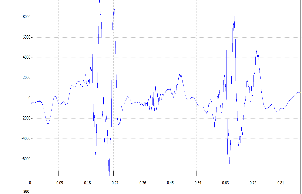 Fig.14 (d) contour of 2d spectrogram
Fig14 (a) normal heart signal 
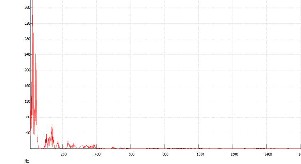 Fig.14 (e) Wavelet transform
Fig.14 (b) spectrum 
 Fig.14(f) Contour of wavelet transform
Fig.14(c) 2d spectrogram
IJSER © 20 11 http ://www.ijser.org
International Journal of Scientific & Engineering Research Volume 2, Issue 10, Oct-2011 8
ISSN 2229-5518
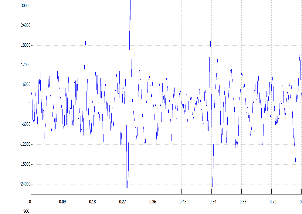
Fig.15(a) abnormal heart signal
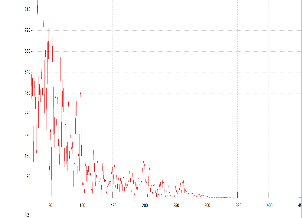
Fig.15 (b) spectrum
Fig.15(c) 2d spectrogram
Fig.15(d) contour of 2d spectrogram
Fig.15(e) Wavelet transform
Fig.15(f) Contour of wavelet transform
IJSER © 20 11 http ://www.ijser.org
International Journal of Scientific & Engineering Research Volume 2, Issue 10, Oct-2011 9
ISSN 2229-5518
1000
900
800
700
600
500
400
300
200
100
0
Correspondence Table of Scales and Frequencies
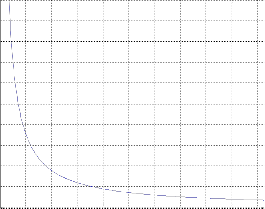
50 100 150 200 250 300 350 400 450 500
Scale
Fig.15 (g) Scale versus Frequency
ii) Visual Display
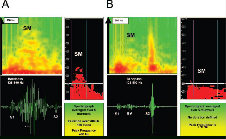
Fig.18 A, Example of a spectral display (upper left panel) recorded simultaneously with a waveform display (below) in a patient withsevere aortic stenosis. The waveform image was obtained with a band-pass filter
(125 to 500 Hz). A systolic murmur is noted that hasa
IV. ADVANTAGES OF THE PRESENTED TECHNOLOGY.
There are several features that are incorporated into thesedigital devices to achieve the proper goals. These include good sound quality, visualdisplay, playback capability, database for reference, andthe ability to store and transmit to distant sites. Thesefeatures are discussed below [1],[5].
i) Sound Quality
Sound quality must be at least as good as that provided bymechanical devices.Electronic amplification of all sounds,particularly within the low-frequency domain, may allow the examiner to detect sounds that are otherwise inaudible or, at best, indeterminate. In this regard, I have personally experienced better detection of soft third or fourth heart sounds and murmurs of aortic and mitral regurgitation, all of which were otherwise inaudible through standard acoustic means.
Signal to noise ratio (SNR) and total harmonic distortion
(THD) of the sound recorded using electronic stethoscope was compared with ordinary heart sounds using Sigview software. The SNR of normal heart sounds in electronic stethoscope was found to be 90.8444 dB whereas in ordinary stethoscope it was 29.7961 dB. The THD normal heart sounds in electronic stethoscope was found to be
15.5368% whereas in ordinary stethoscope it was
12.1736%.
crescendo-decrescendo contour in the waveform display, whereas it also shows a crescendo-decrescendo frequency pattern in thespectral image. This latter image presents a colored plot in which the relative signal intensities correlate with the colors, ie, greaterintensity is shown in orange and lesser intensity in yellow. Absence of sound is shown in green. The panel at the right shows a spectralaverage of murmurs derived from multiple cycles in this case. It is color coded to demonstrate only more intense frequencies uniformlyin red, ie, after a given “cutoff” attenuation (_25 dB in this example), the red changes abruptly to black. Displayed in this way, this latterimage shows a relatively high-peak frequency of 400
Hz (vertical scale at the left). This display also allows for measurement of thetime duration for the murmur to exceed any arbitrary frequency level, in this case 200 Hz. Example B demonstrates a similar display foran individual with an innocent murmur, which appears primarily in early systole and does not reach a peak frequency of 200 Hz. SMindicates systolic murmur.
IJ SER © 20 11 http://www.ijser.org
International Journal of Scientific & Engineering Research Volume 2, Issue 10, Oct-2011 10
ISSN 2229-5518
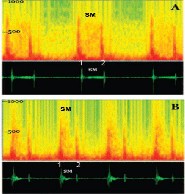
Fig 19 A, Mitral regurgitation: spectral (above) and waveform (below) plots. The waveform display exhibits a pansystolic murmur (SM), which gradually intensifies to the second heart sound (2). The spectral display shows a slowly rising peak throughout systole, which reaches a high in the range of 700 Hz; it possesses an even intensity pattern throughout the entire frequency range. B, Ventricular septal defect involving the muscular portion of the septum. A murmur (SM) is confined to the early part of systole. The spectral images above display relatively high peak murmur frequencies, exceeding 600
Hz, which are decrescendo in contour.
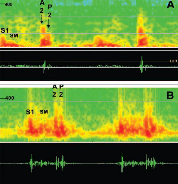
Fig 20 Examples of second heart sound characteristics, normal and abnormal. A, Normal second sound, demonstrating both aortic (A2) and pulmonic (P2) components. Peak frequencies of the aortic component exceed those of the pulmonic. B, Spectral display from a patient with an atrial septal defect. In this example, the second sound is widely split, with the peak frequency of the pulmonic component equaling or exceeding that of the aortic component. A systolic ejection murmur (SM) is also displayed in this instance, which contains relatively low peak frequencies in the range of 250 Hz. S1 indicates first heart sound.
Standard waveform (phonocardiographic) display should be
accomplished with a cursor that sweeps synchronously
with
playback, eitherin real time or after completion of theexamination. In this way, the examiner can follow visuallywhile listening. Spectral display should also be an option, as discussed below. Simultaneous display of a single-lead ECG should be available soon and should be useful in timing the onset of ventricular systole. This could aid in detecting the presence of fourth heart sounds and distinguishing these from sounds that occur during early systole, ie, first sound components and ejection
sounds. Spectral display of cardiovascular sounds was introduced more than 50 years ago by McKusick and coworkers and formed the basis of a very useful analytical characterization of cardiac murmurs. Because it could not be computed quickly and conveniently at the bedside by the tools of the day, it was abandoned in favor of standard waveform phonocardiography.Now this display can be computed quickly by almost all platforms. This allows for the enhancement andextension of many of the methods developed earlier through waveform display. Spectral display of sounds demonstrates sound frequencies on the vertical axis, time on the horizontal axis, and intensity through the use of various colors or shades of gray (Figures 19 through 21). This display allows for rapid visual analysis of morphological patterns of sounds and murmurs. It can even be rendered in a 3D format, wherein quantitative intensity within a given frequency domain can also be displayed. Spectral display can be rendered and viewed quickly at the bedside before transmission and storage. The spectrograph possesses several advantages. First, scanning the spectrograph along any particular frequency line corresponds to filtration of the phonocardiograph around that frequency, without the introduction of baseline vibrations and other noise artifacts. Second, plotting the frequency intensities on a logarithm or decibel scale allows a large range of intensities to be plotted meaningfully on the same graph. In this way, a single spectrograph renders the sound as an image, and abnormal patterns can be recognized visually. Third, peak frequencies and signal duration at arbitrary frequency levels can be measured. Although absolute values for peak frequency are difficult to ascertain, one can display, through color manipulation, the highest frequencies demonstrable up to a given “cutoff” attenuation, such as _25 dB (Figure 19). Finally, averaging over multiple cardiac cycles is possible and canenhance the display of periodic phenomena such as murmurs(Figures 19A and 19B). This averaging process tends tosuppress noise artifact and increase the accuracy of spectralanalysis.The spectrograph can also complement echocardiographic/Doppler techniques. It can aid in determiningwhich patients to subject to the expense of echocardiography.For instance, using peak frequency and murmurduration, we have recently demonstrated its ability toseparate the innocent murmur from that of hemodynamicallysignificant aortic stenosis.
Other related methodshave been used to distinguish
IJ SER © 20 11 http://www.ijser.org
International Journal of Scientific & Engineering Research Volume 2, Issue 10, Oct-2011 11
ISSN 2229-5518
innocent murmurs fromthose produced by cardiac disease in children. In addition,spectral analysis can enhance and confirm informationgained from echocardiography: Applying similar measurementsas noted above, one can estimate the severity ofvalvular aortic stenosis. Peak frequencies are alsopotentially useful for identification of such conditions asmitral regurgitation, ventricular septal defect, and others(Figures 20A and 20B).Increased peak frequencies within the various heartsounds (transients), such as the aortic and pulmoniccomponents of the second heart sound, are potentiallyuseful in detecting abnormal pressure in the pulmonarycircuit (Figure 21). Presence and timing of sound splittingalso can be detected relatively easily through this means.Ejection sounds (clicks) may also be recognized moreeasily, especially when they occur close after the normalfirst heart sound. These sounds often display elevated peakfrequencies that equal or exceed those of the normal firstheart sound components. Third and fourth heart sounds canbe detected and studied through spectral display; in thisregard, one study suggested that peak frequency of fourthsounds correlates with severity of diastolic stiffness (reducedcompliance) of the left ventricle. To provide timingof these latter sounds, a simultaneous ECG (single lead)will be integrated into the system when desired.
iii) Playback at Full and Half Speed
Digital devices should be capable of playback with accurate
reproduction of the original sounds. Also, when playback is
performed at reduced speeds, it should be
accomplishedwithout distortion in pitch. This latter feature is very usefulfor fast heart rates, more precise identification of soundsplitting, and more precise interpretation of murmurs.
iv) Database of Normal and Abnormal Heart
Sounds
A database that is readily accessible at the bedside would helpexaminers, especially those who are inexperienced, identifysounds or murmurs of a given patient, because they could becompared immediately with those derived
from variouspre-recorded sample sounds.
v) Storage and Transmission to Distant Sites
Once obtained digitally, sounds may be stored easily and incorporated into electronic medical records for subsequent review and comparison. Transmission, analysis, and storage
are also possible at any distance via e-mail. As an example of the potential utility of such a process, Dahl et al11 have recently shown that heart murmurs may be recorded in outlying clinics and transmitted to specialized centers for auditory review and analysis by cardiologists. This latter study demonstrated that after such a review, skilled remote auscultation is accurate in properly identifying innocent murmurs and distinguishing them from most murmurs caused by structural diseases, thus avoiding the expense of patient travel and further consultation. If the methods of mechanical analysis of murmurs, as described above, are proved to be reliable, then the requirements for expert intervention would be reduced, and costs would be further mitigated.
V. CONCLUSION
Digital electronic stethoscopeis manufactured in industries. Hence it is costly and is not easily available. The main objective of this project is to design a stethoscope with locally available components such as plastic box, at low cost. The budget of this invention falls within ` 1000. The circuit is enclosed in a low cost plastic case. It clearly indicates that this bio-medical tool could be a handy economical kit for any doctor to diagnose the patient. The PCG database could be a reference for any doctor to give a clinical diagnosis for the diseased patient. The facility of record, playback and analysis will help any doctor to continuously monitor the health of the patient. The software loaded into the PC server will provide complete analysis of the recorded data. Thus such a stethoscope will be many times handier for the doctor compared to any ordinary acoustic stethoscope.
The time has arrived for the medical profession to keep pace with the technological methods now available and to employ them in the practice and teaching of cardiac auscultation. Auscultation at the bedside can now be enhanced by better sound quality and by the ability to
IJ SER © 20 11 http://www.ijser.org
International Journal of Scientific & Engineering Research Volume 2, Issue 10, Oct-2011 12
ISSN 2229-5518
replay sounds of interest in either full or half speed with no loss of frequency representation or sound quality. This permits the acquisition of a visual display of sounds in both standard waveform and spectral formats. The latter format is readily available and provides certain advantages over the time-honoured waveform (Phono- cardio-graphic) method. Both methods, however, can and should be used simultaneously. Signals obtained electronically may then be subjected to objective visual and numerical analysis, transmission to distant sites, and storage in medical records. Signal analysis shows promise for clinical application, such as in the assessment of severity of aortic stenosis and in the separation of innocent from organic murmurs. Perhaps most importantly, however, these methods provide a critical vehicle for the teaching of cardiac auscultation—a method that can and should be preserved for future generations. Digital Electronic Stethoscope will be the future of all stethoscopes.
ACKNOWLEDGEMENTS
The authors thank the personnel at Mitra Hospital in their cooperativenessfor data collection process.
REFERENCES
[1]Paul Y. Ertel, Merle Lawrence, Richard K. Brown and Aaron M. Stern, “Stethoscope Acoustics I: The Doctor and His Stethoscope”, Circulation 1966; 34; 889-
898;“Stethoscope Acoustics: II: Transmission and
Filtration Patterns”,Circulation 1966; 34; 899-909
[2] LT1115CN8- Ultralow Noise, Low Distortion, Audio Op Amp datasheet,Linear Technology Corporation,www.linear.com.
[3]Charles E. Hughes,Peavey Electronics Meridian, MS,
“A Generalized Horn Design to Optimize Directivity
Control & Wave front Curvature”.
[4] Morton E. Tavel, MD, “Cardiac Auscultation A Glorious Past—and It Does Have a Future! Circulation- Journal of the American Heart Association- Circulation
2006; 113; 1255-1259
[5]Robert C White, “Practical DIY Waveguides”.
[6]A Single-Supply Op-Amp Circuit Collection-
Application report datasheet, Texas Instruments,
www.ti.com.
IJ SER © 20 11 http://www.ijser.org