International Journal of Scientific & Engineering Research, Volume 3, Issue 9, September -2012
ISSN 229-5518
Performance Evaluation of Procedural Cognitive Complexity Metric and Other Code Based Complexity Metrics
Olabiyisi Stephen O., Omidiora Elijah O., and Isola Esther O.
Abstract: Software metrics are widely accepted tools to control and assure software quality. A large number of software metrics with a variety of content can be found in the literature. In this paper, different software complexity metrics are applied to a set of sorting algorithms Our intention is to study what kind of new information about the algorithms the complexity metrics (Procedural Cognitive Complexity Metric, lines-of-code, Halstead’s volume, and Cyclomatic number) are able to give, to study which software complexity measures are the most useful ones in algorithm comparison, and t o analyze when the software complexity comparisons are appropriate. The results explicitly revealed that the complexity metrics compare well with one another. Unfortunately, for meaningful results, all the algorithms have to be developed in the same fashion which makes the comparison of independent implementations difficult.
Index Terms - Software Metrics, Sorting Algorithms, Procedural Cognitive Complexity Metric, Lines-Of-Code, Halstead’s Volume,
and Cyclomatic Number.
—————————— ——————————
1. INTRODUCTION
A wide range of activities is associated with different phases of software development. Software metrics are techniques/formulas to measure some specific property or characteristics of software. In software engineering, the term
‘software metrics’ is directly related to the
measurement. Software measurement has
significant role in the software management. According to [1] ‚You can’t manage what you can’t measure!‛. Campbell also emphasized the importance of measurement in software management by stating, ‚If you ain’t measuring, you ain’t managing and you’re only along for the ride (downhill)!‛ .At this point it is worth to define
‘measurement’ itself. [2] defines measurement as the process by which numbers or symbols are assigned to attributes of entities in the real world in such a way as to describe them according to clearly defined rules .
Software metrics are a quantitative guide to the performance of a certain piece of software in relation to the human interactions needed to make the software work. Metrics have been established under the idea that before something can be measured or quantified, it needs to be translated into numbers. There are several areas where software metrics are found to be of use. These
areas include everything from software planning to the steps that are meant to improve the performance of certain software. Software cannot perform on its own without human interaction. Therefore, in a way, software metric is also a measure of a person's relation to the software that he or she is handling. Software systems are complex. Therefore, it is hard to attain a high level of quality. Software metrics have always been an important tool since it was realised that software development is a complex task. Due to its complexity, software quality has been a rising demand for decades and some definitions have been manifested throughout software history. A software product should carry several quality attributes, such as correctness, reliability, efficiency, integrity, usability, maintainability, testability, flexibility, portability, reusability, and interoperability [3]. According to [4] the most necessary software quality attribute is maintainability. To efficiently be able to maintain a software system, the codes should be understandable for developers, and to achieve high quality, reduction of complexity is essential. To deal with software complexity, software metrics are used. Metrics are indicators of complexity; they expose several weaknesses of a complex software system. Therefore, by the means of software metrics, quality can be estimated. That is why
IJSER ©2012 http://ww.ijser.og
International Journal of Scientific & Engineering Research, Volume 3, Issue 9, September -2012
ISSN 229-5518
metrics take an indispensable role in software development life cycle. Moreover, most of the
available metrics do not consider the cognitive characteristics in calculating the complexity of a code, which directly affects the cognitive complexity. If a code has a low cognitive complexity, programmer can easily grasp the code without wasting too much time. High cognitive complexity indicates poor design which performs the task. If the interacting entity is a programmer, then complexity is related to the factors and metrics that are used in this research are associated with procedural paradigm.
The various popular metrics for procedural programming languages are under several criticisms. These criticisms are mainly based on lack in desirable measurement properties, being too labour- intensive to collect and only confined to the features of procedural languages. Most of the available metrics cover only certain features of a language. For example, if Line of Code is applied, then only size will be considered, if MCcabe complexity is applied the control flow of the program will be applied. Moreover, most of the available metrics do not consider the cognitive characteristics in calculating the complexity of code. Hence, [5] proposed a metric for procedural programming language called Procedural Cognitive Complexity Metric (PCCM) that address most of the parameters of software. This paper attempts to evaluate the performance of the metric with the existing ones using sorting algorithms.
2. EXISTING CODE BASED COMPLEXITY MEASURES [6] [7]
2.1 Halstead Complexity Measure [6]
Maurice Halstead proposed this measure which is based on the principle of Count of Operators and Operand and their respective occurrences in the code. These operators and operands are to be considered for the formation of Length and Vocabulary of Program. Further Program Length and Vocabulary serve as basis for finding out Volume, Potential Volume, Estimated Program length, Difficulty and finally effort and time by using following formulae.
Program Vocabulary, n = n1+n2
Program Length, N = N1+ N2
Volume, V= N*log2n
Estimated Program Length N^ = n1 log2 n1 + n2 log2 n2
Potential Volume, V* =(2+n2*)log2(2+n2*) Program Level, L = V*/V
Effort, E =V/L in elementary mental discriminations
Reasonable Time, T = E/B min
Difficulty = 1/language level
Now the problem with this method is that, they are
difficult to compute. It is not suited when we want fast and easy computation, because to count distinct operand and operator is not easy job. Specifically when there are large programs.
2.2 Mac Cabe’s Cyclometric Complexity [7]
One of the better known and graphic metrics is Cyclometric Complexity developed by Thomas J Mc Cabe in 1976. His fundamental assumption was that software complexity is intimately related to the number of control paths generated by the code. The metric can be defined in two equivalent ways.
The number of decision statement in a program + 1
Or for a graph G with n vertices, e edges and p
connected components, v(G) = e-n+2p
Finally number of branches can be counted from
the graph. The McCabe complexity C can be defined as:
C = 1 + 
 (1)
(1)
The difficulty with McCabe Complexity is that, the complexity of an expression with in a conditional statement is never acknowledged. Also there is no penalty for embedded loops versus a series of single loops; both have the same complexity.
2.3 Line of Code
This metric considers on the number of lines of code inside a program. Some types of Line of Code are [8] :
(i) Lines of Code (LOC): Counts every line including comments and blank lines.
(ii) Kilo Lines of Code (KLOC): It is LOC
divided by 1000.
IJSER ©2012 http://ww.ijser.og
International Journal of Scientific & Engineering Research, Volume 3, Issue 9, September -2012
ISSN 229-5518
(iii) Effective Lines of Code (eLOC): Estimates effective line of code excluding parenthesis, blanks and comments.
(iv) Logical Lines of Code (lLOC): Estimates
only the lines which form statements of a code. For example, in C, the statements which end with semi-colon are counted to be lLOC.
This type of measurement is highly dependent on
programming languages. A code written in Java may be much more effective than C. Two programs that give the same functionalities written in two different languages may have very different LOC values. The advantage of LOC is its ease of calculation, though it neglects all other factors that affect the complexity of software, such as the name of variables, classes, structures, coupling, cohesion, inheritance, and so on [9].
2.4 Procedural Cognitive Complexity Measure
Accordingly to [5] the total complexity in terms Procedural Cognitive Complexity Measure is given by the following formula:
second column of the tables shows the C codes. The sum of Arbitrarily Named Variables (ANV), the Meaningfully Named Variables (MNV) and the operators in the line is given in the third column of the table. The cognitive weights of each C codes lines are presented in the forth column. The C complexity calculation measure for each line is shown in the last column of Tables 3.5 to 3.14 and Table 3.15 shows the PCCM result of the ten (10) different sorting algorithms code.
4. RESULTS AND DISSCUSSION

For empirical validation of the PCCM metric, ten sorting algorithm codes written in C were analysed. It is believed that the selected ten sorting algorithm codes are significant in number for comparison since they include different structures and, therefore, contain most of the characteristics of a system required for the validation of the proposed measure. The complexity values of different measures for the cases are summarised in Table 4.1. Table 4.1 contains the statistics that are collected after analysing those C codes to evaluate the PCCM measures. Actually, the agenda of
PCCM
n mi
(4 * ANV

MNV)


operators * CWU ij
(2)
empirical validation is two-fold. First, the well
I 1 j 1
Here, the complexity measure of a procedural code
(PCCM) is defined as the sum of
complexity of its n modules (if exists) and module I
consists of mi lines of code. In the
context of formula 1, the concept of cognitive weights is used as an integer multiplier.
Therefore, the unit of the PCCM is: CWU which is always a positive integer number.
This implies achievement of scale compatibility.
This logic was derived from Unified
Complexity Measure [10]. Cognitive differences of
variables were added inside the metric.
3. MATERIALS AND METHODS
The metrics are applied on some sorting algorithms codes which are written in C language. Ten(10) different types of sorting algorithms codes were considered. These programs were different from each other in their architecture, the calculations of PCCM for these sorting algorithms are given in Table 3.5 to 3.14. The structures of all the 10 programs in tables are as follows: The
known metrics like effective Lines of Code (eLOC),
Cyclomatic Complexity (CC) and volume, effort,
difficulty and time estimations from Halstead metrics were all applied. Second, the statistics that are collected from those metrics was compared with the values obtained from PCCM to investigate the usefulness and effectiveness of the proposal.
TABLE 1
IJSER ©2012 http://ww.ijser.og
International Journal of Scientific & Engineering Research, Volume 3, Issue 9, September -2012
ISSN 229-5518
COMPARISON OF THE PCCM, ELOC, CC AND HALSTEAD METRICS
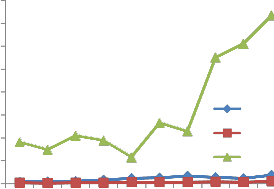
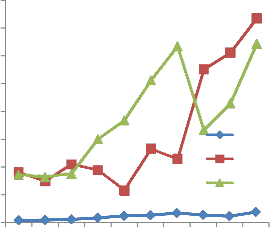
A graph which covers the comparison between CC, eLOC and PCCM is also plotted in Fig. 3, to
observe similarities and differences between them. A close inspection of the graph shows that PCCM has close relation with CC and eLOC. This can easily be seen in the figure below, in which PCCM, CC and eLOC reflect similar trends. In other words, high PCCM values are due to a large number of variables. (arbitrarily named variables), a number of iterations or branching structure. For example: PCCM has the highest vale for Radix Sort (733), which is due to having the maximum line of code (38), variables and complex control structure.The similarities that lies between them is the harmony between their increase and decrease. The difference is that some of the programs are showed by eLOC or CC having almost the same complexity. On the other hand PCCM is able to catch the differences even if they are hidden in details and therefore, give more prominent reactions.
800
700
600
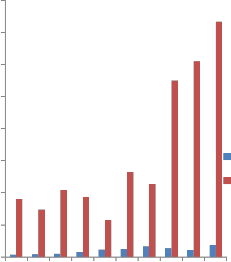
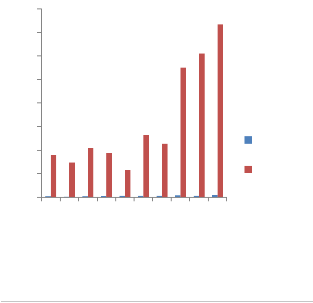
Fig.1, shows comparison result between the effective line of code (eLOC) and PCCM. It is clear that PCCM values are normally higher than eLOC. This is because PCCM consists of complexity values due to other parameters/factors responsible for complexity. In other words, PCCM calculates more factors than eLOC. However, there is not a conflict or opposition between PCCM and eLOC. In Fig. 2, CC attempts to determine the number of execution paths in a program. Therefore, on the contrary to the proposed measure, it does not consider variables, difference between variables, operator or constants. For instance CC value for program Quick, Heap, Merge and Counting Sort are equal (CC=7). However, PCCM does not only
500
400
300
200
100
0
Sorting algorithms
eLOC PCCM
consider the factors related with variable and
operators but also complexity due to internal structure. The PCCM value for the aforementioned programs are 116, 265, 228 and 610 respectively, which is able to indicate the complexity differences between programs and therefore provide more information.
Fig. 1. Comparison between eLOC and PCCM
IJSER ©2012 http://ww.ijser.og
International Journal of Scientific & Engineering Research, Volume 3, Issue 9, September -2012
ISSN 229-5518
800
700
600
500
400
300
200
100
0
Sorting algorithms
CC PCCM
with Halstead Time. Halstead Time measurement is approximately the time spent to understand a program and PCCM reflects the similar values to this measurement. This proves that the proposed metric is a strong predictor of comprehensibility. Despite the similarity of PCCM and Halstead Time, none of Halstead’s metrics was capable of measuring the structural complexity of a program. In Fig. 6, the demonstration of the comparison of CC, PCCM and Halstead Difficulty. Halstead Difficulty of a program should have some relation with CC. Halstead Difficulty and CC values are more or less similar but in some cases they may be contradictory. PCCM is able to make more sensitive measurements than CC and this graph also shows the difference that exists between PCCM and Halstead Difficulty too.
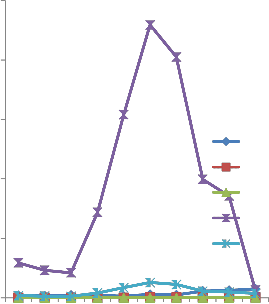
In Fig. 7, all the values remain tiny before
Halstead Effort. Effort spent to develop a program
Fig. 2. Comparison between CC and PCCM
800
700
600
500
400
300
200
100

0
Sorting algorithms
Fig. 3. Relative Graph between eLOC, CC and
PCCM
eLOC CC PCCM
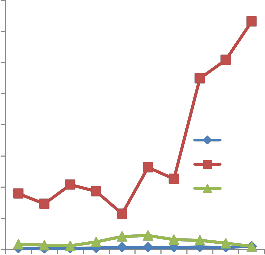
should have some correlations with eLOC, CC, PCCM and Halstead Time. Effective line of code varies from 8 to 38, but Halstead Effort values changes between 2100 and 22950. There are some contradictions also. For example program Heap sort has 26 eLOC with Halstead Effort of 22950 while program Radix sort has 38 eLOC with Halstead Effort of 6420 this does not seem to be an effective measurement to understand how much difficult the program is to be understood by a human. For the given examples the Halstead Effort values are too exaggerated and have some contradictions with eLOC, CC and even with Halstead Time. It was expected that atleast, it could have a relationship with CC, because if a code is extremely complex, then most probably it Socrotninsigsts of a vast number of control paths [11].
In Fig. 4, comparison between eLOC,
PCCM and Halstead Volume is given. Logically, there should be similarities between eLOC and Halstead Volume. However, here PCCM and eLOC values are more similar to each other. Halstead Volume has exaggerated values as shown in the graph. The programs are not extremely different in their size and understanding, but according to Halstead Volume they are. It is observed in Fig. 5 that PCCM has similar trends
IJSER ©2012 http://ww.ijser.og
International Journal of Scientific & Engineering Research, Volume 3, Issue 9, September -2012
ISSN 229-5518
800
700
600
500
400
300
200
100
0
eLOC PCCM V
800
700
600
500
300
200
100
CC PCCM D

Sorting algorithms
Fig .4. Relative Graph between eLOC, PCCM and
Halstead Volume
0

Sorting algorithms
Fig. 6. Relative Graph between CC, PCCM and
Halstead Difficulty.

1400
25000
1200
1000
20000
800
600
400
200
0
PCCM T
15000
10000
5000
PCCM eLOC CC
E
T


0

Sorting algorithms
Fig. 5. Relative graph between Halstead Time and
PCCM
Sorting algorithms
Fig .7. Relative Graph between eLOC, CC, PCCM, Halstead Effort and Halstead Time
IJSER ©2012 http://ww.ijser.og
International Journal of Scientific & Engineering Research, Volume 3, Issue 9, September -2012
ISSN 229-5518
5. CONLUSSION
In this study, performance comparison of various code based complexity metric was carried out using ten(10) sorting algorithms written in C language. The comparative inspection of the implementation of PCCM versus eLOC, CC, and Halstead has shown that:
(i) PCCM makes more sensitive measurement, so that it enables developers to differentiate even small complexity differences among codes.
(ii) Halstead’s assumptions may
sometimes mislead developers, whereas PCCM has the least amount of assumptions and those assumptions are based on cognitive aspects.
(iii) CC was not able to make sensitive measurement; most of the similar codes had the same CC values. Similarly, for eLOC, for being based on the lines of code, cannot distinguish different structures. Of a fact empirical validations have shown that PCCM was able to handle those issues.
(iv) Among the specified metrics only
PCCM includes cognitive effects and also has a dynamic structure.
[7] Mc Cabe, T.H., A Complexity measure, IEEE Transactions on Software Engineering, SE-2,6, pp. 308- 320, 1976
[8] Resource Standard Metrics. (last accessed
18.02.2010). Available at:
http://msquaredtechnologies.com/m2rsm/docs/rsm
_metrics_narration.htm
[9] Anthon Milutin (2009): ‚Software code metrics’’, ACM Sigsoft, 18(2): 102-104.
[10] Misra, S. and Akman, I. (2008): A Model for Measuring Cognitive Complexity of Software, Springer-Verlag Berlin Heidelberg.
[11] Marco, L.: Measuring Software Complexity
(last accessed. 23.02.2010).
References
[1] DeMarco, T (1986): Controlling Software
Projects, Yourdon Press, New York. [2] Fenton, N. E. and Pfleeger, S. (1997):
Software Metrics: A Rigorous and Practical Approach, 2nd Edition Revised ed. Boston: PWS Publishing, City Univ, London,20(3):199-206.
[3] Pfleeger, S. L and Atlee, J. M (2006): Software
Engineering – Theory and Practice, 3rd
International Edition, Prentice Hall.
[4] Sommerville, I. (2004): Software Engineering,
7th Edition, Addison Wesley.
[5] E.O.Isola (2012), ‘’An improved software
complexity metric for procedural programming languages,’’ Unpublished M.Tech Thesis,Department of Computer Science, LAUTECH, Ogbomoso,Nigeria.
[6] Halstead, M.H., Elements of Software Science,
Elsevier North, New York,1977.
IJSER ©2012 http://ww.ijser.og