International Journal of Scientific & Engineering Research, Volume 4, Issue 7, July-2013 1999
ISSN 2229-5518
Performance Evaluation of New Energy Detection Based Spectrum Sensing Methods in Cognitive Radio
1Sumit Lohan, 2Rita Mahajan
1,2E & EC Dept., PEC University of Technology
1lohansumit86@gmail.com, 2ritamahajan@pec.ac.in
Abstract--For Cognitive Radio, energy detection is the most popular spectrum sensing method since other spectrum sensing methods like matched filter detection, cyclostationary feature detection etc. need to know the prior information i.e. frequency, phase, modulation scheme etc. about the primary signal whereas energy detection does not and it is also simpler to implement. In this paper, we compare the ROC (Receiver Operating Characteristics) curves and probability of detection ( Pd ) versus SNR (Signal-to-
Noise Ratio) curves for AW GN channel using squaring, cubing and double-squaring operations. The cubic operation shows an
improvement of up to 1.3 times and double-squaring operation shows an improvement of up to 2 times as compared to the squaring operation for AW GN channel.
—————————— ——————————
n today’s world, due to increasing interest of people in wireless communication and its progressive growth, the demand of electromagnetic spectrum is increasing day-by- day which has led to under-utilization of the spectrum. A fixed portion of the total available EM spectrum is assigned to a user which leads to wastage of a large portion of it because the users other than the licensed user cannot use it. To mitigate this problem of spectrum scarcity, Federal Communications Commission (FCC) has proposed the solution by allowing the unlicensed users to use the licensed bands opportunistically and named it as Cognitive Radio (CR) [1]. Cognitive Radio is an intelligent wireless technology due to its ability to rapidly and autonomously adapt operating parameters to changing environment [2]. The two main characteristics of Cognitive Radio are: Cognitive Capability (i.e. gathering the information about the environment) and reconfigurability (i.e. adapting its
Among all the above specified spectrum sensing techniques, energy detection is the most popular technique as it is of non-coherent type and has low implementation complexity. This energy detection technique, also called radiometry or periodogram does not require any prior knowledge of primary user’s signal [5]. In this method, we measure the energy of the received signal and compare it with a predefined threshold to determine the presence or absence of primary user’s signal. Moreover, energy detector is mainly used in ultra wideband communication to borrow an idle channel from licensed user. In this paper, probability of detection ( Pd ), probability of false alarm (Pf )
and probability of missed detection ( Pm = 1 − Pd ) are the key measurement metrics that analyze the performance of an energy detector. The performance of an energy detector is illustrated by probability of detection ( Pd ) versus SNR curves and the receiving operating characteristics (ROC)
transmission parameters according to the gathered
curves which is a plot of Pd
versus Pf or Pm versus Pf
[6].
information) [3]. One of the most important tasks that cognitive radio performs is spectrum sensing. In cognitive radio, spectrum sensing aims at monitoring the usage and the characteristics of the covered spectral band(s) and is thus required by the secondary users both before and during the use of licensed spectral bands [1]. Spectrum sensing is not an easy task because of shadowing, fading and time-varying natures of wireless channels. There are many spectrum sensing techniques available like energy detection, matched filter coherent detection, cyclostationary feature detection etc. [4].
This paper is organized as follows: Section 2 describes
the system model and a list of important notations. In section 3, probability of detection and false alarm of non- fading AWGN channel is described. Simulation result for squaring, cubing and double-squaring operations and their comparison are illustrated in section 4 followed by conclusions in section 5.
First of all, before describing the system model, here we list the main notations which are used in this paper for additional clarity and to avoid any kind of confusion.
IJSER © 2013 http://www.ijser.org
International Journal of Scientific & Engineering Research, Volume 4, Issue 7, July-2013 2000
ISSN 2229-5518
s(t) : primary user’s transmitted signal
y(t) : received signal
n(t) : additive white Gaussian noise
h : amplitude gain of the channel
N 01 : one-sided noise power spectral density
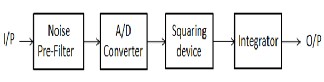
Fig. 1: Block diagram of Energy detector
The output of the integrator at any time is the energy of the filter received signal over the time interval T. The noise pre-filter limits the noise bandwidth; the noise at the input to the squaring device has a band-limited, flat spectral density. The output of the integrator is considered as the
T
E s : signal energy= ∫ s 2 (t ) dt
test statistic to test the two hypotheses H 0
and H1 [7].
The received signal
0
E s
y(t) takes the form
γ =
![]()
N 01
: signal-to-noise ratio (SNR)
y(t ) = h s(t ) + n(t )
(1)
λ : energy threshold used by the energy
where
h = 0
or 1 under hypotheses
H 0 or
H1 ,
detector
T : observation time interval in second
W : one-sided bandwidth (Hz) i.e. positive
bandwidth of the low-pass signal
respectively. As described in [7], the received signal first pre-filtered by an ideal band-pass filter with transfer function [9][10]
u = TW : time-bandwidth product
f c : carrier frequency
2
![]()
![]() f − f c
f − f c ![]() ≤ W
≤ W
H ( f ) =
N 01 (2)
Pd : probability of detection
0 ,
![]()
![]()
f − f > W
P f
: probability of false alarm c
Pm = 1 − Pd : probability of missed-detection
to limit the average noise power and normalize the noise
H 0
: hypothesis 0 corresponding to no signal
variance. The output of this filter is then squared and
transmitted
integrated over a time interval T to finally produce a
H1
: hypothesis 1 corresponding to signal
measure of the energy of the received waveform. The
transmitted
output of the integrator denoted by Y as in fig. 1 will act as
N (µ ,σ 2 ) : a Gaussian variate with mean µ and
the test statistic to test the two hypotheses
H 0 and
H1 .
variance σ 2
2
According to the sampling theorem, the noise process [11]
can be expressed as
χα : a central chi-square variate with α degree
of freedom
χα (β ) : a non-central chi-square variate with α degree of freedom and non-centrality parameter β
n(t ) =
∞
∑
i=−∞
ni sin c(2Wt − i)
(3)
sin(π x)
i
where![]()
![]()
sin c( x) = and ni = n .
To detect the energy of the received signal, an energy
detector is used by each CR user [7]. Energy detector consists of four main blocks [8]:
1. Noise pre-filter
2. A/D converter (Analog-to-Digital Converter)
3. Squaring Device
π x 2W
One can easily check that ni ~ N (0, N 01 W ), for all i .
Over the time interval (0, T ), the noise energy can be approximated as [7].
4. Integrator
T
∫ n (t ) dt =
2u
W ∑ni
(4)
2 1 2
![]()
2
0 i=1
where u = TW . We assume that T and W are chosen to restrict u to integer values. If we define
IJSER © 2013 http://www.ijser.org
International Journal of Scientific & Engineering Research, Volume 4, Issue 7, July-2013 2001
ISSN 2229-5518
ni
![]()
n'i = ,
N 01W
(5)
Pd = Pr(Y > λ | H1 ),
Pf = Pr(Y > λ | H 0 ),
(9)
(10)
then, the test or decision statistic Y can be written as [7]
where λ is decision threshold. Also, P f
can be written in
2u
Y = ∑n'i
(6)
terms of Probability density function (PDF) as: [13, Eq. (4-
16) and Eq. (4-22)]
i =1
Y can be viewed as the sum of the squares of 2u
standard
∞
Pf = ∫
fY ( y) dy
(11)
Gaussian variates with zero mean and unit variance. λ
Therefore, Y follows [15] a central chi-square
(χ 2 )
using equation(11),
distribution with 2u
degrees of freedom. The same
approach is applied when the signal
s(t )
is present with ∞
y
the replacement of each ni
by ni + si
where![]()
s = s i
P = 1
∫ y u −1e
![]()
−
2 dy
(12)
2W
The decision statistic Y in this case will have a non-central
f 2 u Γ(u)
λ
χ 2 distribution with 2u
degrees of freedom and a non-
centrality parameter
2γ [7]. Following the shorthand
Dividing and multiplying the R.H.S. of above equation by
notations mentioned in the beginning of this section, we can describe the decision statistic as
2 u −1 , we get
∞ u −1
y
![]()
−
χ 2 , H 0
![]()
![]()
P = 1 y
e dy
(13)
χ 2
(2γ ), H1
2Γ(u) ∫ 2
Y ~ 2u
2u
2
(7) f
λ
The probability density function (PDF) [9] of Y can be written as
substituting![]()
![]()
y = t , dy
2 2
λ
= dt and changing the limit of
![]()
1 − y
![]()
integration to , ∞ , we get
2
y u −1e 2 , H 0
2u Γ(u)
fY ( y) =
1
u −1
y 2
− 2γ + y
(8) ∞
1
![]()
![]()
![]()
e
![]()
![]()
2 I u −1 (
2γy ), H1
![]()
Pf =
(t ) u −1 e −(t ) dt
(14)
where
Γ(.)
2 2γ
is the gamma function [12, section 8.31] and
or,
Γ(u)
∫
λ / 2
I v (.)
is the vth -order modified Bessel function of the first
Γ(u , λ / 2)
kind [12, section 8.43].
Pf =
![]()
Γ(u)
(15)
An approximate expression for probability of detection for non-fading AWGN channel was presented in [7]. In this
Now probability of detection can be written by making use
of the cumulative distribution function [13, Eq. (4-22)].
section, we present exact closed-form expression for both
Pd = 1 − FY ( y)
(16)
probability of detection Pd
and probability of false alarm
Pf . The Pd
and Pf
can be generally evaluated by
IJSER © 2013 http://www.ijser.org
International Journal of Scientific & Engineering Research, Volume 4, Issue 7, July-2013 2002
ISSN 2229-5518
The cumulative distribution function (CDF) of Y can be obtained (for an even number of degree of freedom which
0
is 2u in our case) as [14, Eq. (2.1-124)]: 10![]()
![]()
FY ( y) = 1 − Qu ( λ , y )
(17)
-1
10
where Qu (a , b) is the generalized Marcum Q-function
[15]. Hence,
Pd = Qu (
![]()
![]()
2γ , λ )
-2
10
(18)
-3
The performance of energy detector is analyzed using 10
probability of detection Pd
versus SNR curves and ROC SNR=5dB
(Receiving Operating Characteristic) curves for an AWGN
channel. Monte-Carlo method is used for simulation. Fig. 2
SNR=10dB SNR=15dB
-4
10
and Fig. 3 depict the
Pd versus SNR curves for different
-4 -3 -2 -1 0
10 10 10 10 10
values of probability of false alarm
(Pf )
and ROC curves
Probability of False alarm (Pfa)
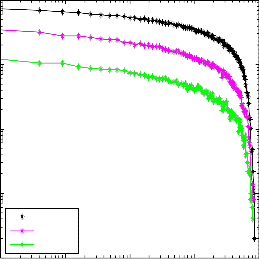
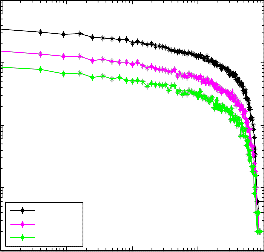
Fig. 3: Complementary ROC curve for AWGN channel using squaring
for different values of SNR for the squaring operation of an
AWGN channel, respectively. It can be seen in these
figures that with increase in SNR (Signal to Noise Ratio), the performance of energy detector improve. Fig. 4 depict
operation
Fig. 4 and Fig. 5 depict improvement in the performance of the energy detector using cubic and double-squaring
the comparison of Pd
versus SNR curves for squaring,
operations over AWGN channel. The results obtained are
cubing and double-squaring operations and the comparison of ROC curves for all the three operations is shown in Fig. 5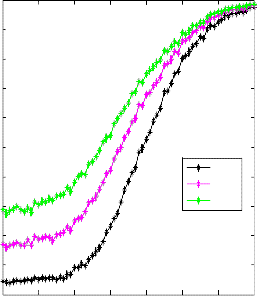
1
0.9
0.8
0.7
quantified as shown in TABLE 1 and TABLE 2. These results illustrate improvement in the probability of detection using cubic and double-squaring operations. This improvement has gone up to 1.3 times for cubic operation and 2 times for double-squaring operation as compared to squaring operation for AWGN channel. We assume time- bandwidth product=5 and average SNR=5 db.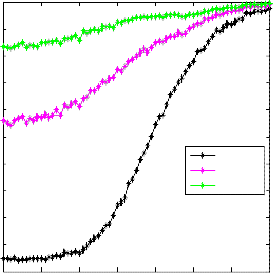
1
0.9
0.6
0.8
0.5
0.4
0.3
0.2
0.1
0
Pf=0.01
Pf=0.05
Pf=0.1
0.7
0.6
0.5
0.4
0.3
0.2
squaring cubing double squa
-15 -10 -5 0 5 10 15 20
SNR
0.1
0
Fig. 2: Pd
versus SNR curve for AW GN channel using squaring
-15 -10 -5 0 5 10 15 20
operation
SNR
IJSER © 2013 http://www.ijser.org
International Journal of Scientific & Engineering Research, Volume 4, Issue 7, July-2013 2003
ISSN 2229-5518
Fig. 4: Comparison of Pd
0
10
-1
versus SNR curves for AW GN channel
We have discussed the energy detection spectrum sensing technique in cognitive radio networks. Energy detection has the advantage of low implementation and computational complexities. In the present work, the
performance of energy detector is analyzed. Closed form
10
expression for probability of detection and false alarm over
AWGN channel are described. It is shown by using ROC
curves that probability of detection improves if we use
10-2 cubing or double-squaring operation instead of squaring operation.
-3
10
squaring cubing
double squa
-4
10
-4 -3 -2 -1 0
10 10 10 10 10
Probability of False alarm (Pfa)
Fig. 5: Comparison of complementary ROC curves for AWGN channel
Probability of false alarm | Probability of detection for AWGN Channel (Squaring Device) | Probability of detection for AWGN Channel (Cubing Device) | Improvement (times) |
0.0001 | 0.2844 | 0.6568 | 1.3094 |
0.0196 | 0.5570 | 0.8358 | 0.5005 |
0.1600 | 0.7680 | 0.9252 | 0.2046 |
0.4096 | 0.9150 | 0.9766 | 0.0673 |
0.9025 | 0.9988 | 0.9998 | 0.0010 |
TABLE 1: Improvement using cubing operation for AWGN channel.
Probability of false alarm | Probability of detection for AWGN Channel (Squaring Device) | Probability of detection for AWGN Channel (Double-squaring Device) | Improvement (times) |
0.0001 | 0.2844 | 0.8506 | 1.9908 |
0.0196 | 0.5570 | 0.9368 | 0.6818 |
0.1600 | 0.7680 | 0.9734 | 0.2674 |
0.4096 | 0.9150 | 0.9896 | 0.0815 |
0.9025 | 0.9988 | 1.0000 | 0.0012 |
TABLE 2: Improvement using double-squaring operation for AWGN channel.
[1] J. Ma, G. Y. Li, B.H. Juang, “Signal Processing in Cognitive Radio.” Proceedings of the IEEE, Vol. 97, pp. 805-823, May 2009.
[2] H. A. Mahmoud, T. Yucek and H. Arslan. “OFDM For Cognitive Radio- Merits and Challenges.” IEEE Wireless Communications, Vol. 16, pp. 6-
15, April 2009.
[3] I. F. Akyildiz, W.Y.Lee, M.C. Vuran, S. Mohanty. “Next Generation/Dynamic Spectrum Access/Cognitive Radio Wireless Networks: A Survey.” Comp. Net. J., Vol. 50, pp. 2127–59, Sept. 2006.
IJSER © 2013 http://www.ijser.org
International Journal of Scientific & Engineering Research, Volume 4, Issue 7, July-2013 2004
ISSN 2229-5518
[4] I. F. Akyildiz, W.-Y. Lee, M. C. Vuran, and S. Mohanty, “Next generation/dynamic spectrum access/cognitive radio wireless networks:
a survey,” Computer Networks, Vol. 50, pp. 2127–2159, May 2006.
[5] T. Yucek and H. Arslan. “A Survey of Spectrum Sensing Algorithms for Cognitive Radio Applications.” IEEE Communications Surveys & Tutorials, Vol. 11, pp.116-130, Jan. 2009.
[6] S. Atapattu, C. Tellambura, and H. Jiang. “Energy detection of primary signals over η-μ fading channels.” in Proc. Fourth International Conference on Industrial and Information Systems, ICIIS, pp. 118-122,
2009.
[7] H. Urkowitz, “Energy detection of unknown deterministic signals,” Proc. IEEE, Vol. 55, pp. 523–531, April. 1967.
[8] S. Ciftci and M. Torlak. “A Comparison of Energy Detectability Models for Spectrum Sensing.” in IEEE GLOBECOM, pp.1-5, 2008.
[9] F. F. Digham, M. -S. Alouini, and M. K. Simon, “On the energy detection of unknown signals over fading channels,” in Proc. IEEE Int. Conf. on
Communication, Vol. 5, pp. 3575–3579, May 2003.
[10] V. I. Kostylev, “Energy detection of a signal with random amplitude,” in Proc. IEEE Int. Conf. on Communication. (ICC’02), New York City, New York, pp. 1606–1610, May 2002.
[11] C.E. Shannon, “Communication in the presence of noise,” Proc. IRE, Vol.
37, pp. 1-21, January 1949.
[12] I. S. Gradshteyn and I. M. Ryzhik, Table of Integrals, Series, and
Products. San Diego, CA: Academic Press, sixth ed., 2000.
[13] A. Papoulis and S.U Pillai, Probability, Random Variables, and Stochastic
Processes, New York: McGraw-Hill, ed. 4th, 2002.
[14] J. G. Proakis, Digital Communications, New York: McGraw-Hill, ed.
4th, 2001.
[15] A. H. Nuttall, “Some integrals involving the QM-function,” Naval
Underwater Systems Center (NUSC) technical report, May 1974.
IJSER © 2013 http://www.ijser.org