
house through which they can reach the other networks as shown in figure 2.
Interconnection is one of the problems that are emerging with the increase in number of operators
International Journal of Scientific & Engineering Research Volume 3, Issue 4, April-2012 1
ISSN 2229-5518
The adoption of the Interconnect Clearing Houses (ICH) in Nigeria is a long awaited development expected in the telecommunication industry. This paper presents an insight into network performance evaluation and quality of service (QoS) improvement of mobile cellular systems in Nigeria using an ICH as a case study. The components of mechanisms of analyzing and evaluating the various networks are discussed. The paper a lso identifies the important Key Performance Indicators (KPIs) for QoS evaluation which are used in evaluating the Mobile networks. Two assessment parameters such as Call Completion Ratio (CCR) and Answer Seizure Ration (ASR) for evaluating the traffic analysis of the networks in Nigeria are deployed. The parameters are applied on four mobile network systems in Nigeria using the general models simulated in Matlab for evaluating network performance. The result of the study shows that the QoS of mobile system in the country is not 100% reliable and still needs to be improved upon.
When Cellular Networks (GSM and CDMA) was introduced in Nigeria in the early 2000’s, it was considered an over specified system. But nowadays it is obvious that the whole range of service is widely in use. In the cellular systems, the performance and the quality of service is affected due to the rapid increase in the number of mobile subscribers in recent time.
A cellular network is a radio network distributed over land areas called cells, each served by at least one fixed-location transceiver called cell site or base station. When joined together, these cells provide radio coverage over wide geographic area. This enables a large number of portable transceivers (e.g. mobile phones, pagers, etc) to communicate with each other and with fixed transceivers and telephone anywhere in the network. These large numbers of users can access the network system through the base station transceiver. This is why it is usually referred to as access point. The user migrates across several base
stations thereby allowing the transceivers to transfer communication link to the neighboring base station as it transverses from one area to another.
This paper evaluates the interconnectivity in the telecommunications industry in Nigeria using Interconnect Clearing House Nigeria Limited as a case study. Interconnect clearing house is one out of the six companies licensed in 4th August 2004 by Nigerian Communications Commission (NCC) to provide interconnectivity to all the telecom operators in Nigeria [1]. NCC is the telecommunication service regulatory body in Nigeria. Interconnection refers to the establishment of electronic linkages between service providers so that they can conduct business transactions electronically. Prior to the issuing of these licenses, networks were connected directly
to each other. Meaning if there are n networks in a place, there will be n(n − 1) links to them as
shown in figure 1. With the clearing house, these
networks will provide only one link to the clearing
IJSER © 2012 http://www.ijser.org
International Journal of Scientific & Engineering Research Volume 3, Issue 4, April-2012 2
ISSN 2229-5518
house through which they can reach the other networks as shown in figure 2.
Interconnection is one of the problems that are emerging with the increase in number of operators
Network
Operator 5
Network
Operator 1
Network
Operator 3
Network
Operator 2
Network
Operator 4
Network
Operator 6
with open market conditions and Interconnection licensing requirements. This possibly calls for mandatory interconnections between each of Mobile operator, Basic and National/ International Long Distance Operator in any particular licensed service area. Some types of Interconnections in Multi-Operator Multi Service environment as in [3] include: (i) Basic to Basic (Local connection within same community), (ii) Basic to Cellular, (iii)Basic to
Figure 1: Direct connection of Networks for interconnectivity (i.e., a web) The clearing house brings in an easy interconnectivity between networks especially the new entrants (new networks). Because to provide telecomm service in Nigeria there must be transmission links to all the respective network operators, which is a whole lot of expenses to start

a business. But with clearing house, a link connects the entire networks together in Nigeria.
National/ Long distance, (iv) Basic to International/Long distance (direct or through national long distance operator), (v) Mobile to Mobile, (vi) Mobile to National Long Distance, (vii) Mobile to International Long Distance (direct or through national long distance operator).
Network
Operator 1
Network
Operator 2
Network
Operator 3
Network
Operator 4
In the general framework of interconnection of mobile networks, new operators set up electronic connections (called Gateways) to each of the
Industry ASP
existing operators for exchange of services. In fact, the challenge of interconnection, more than any other factor, limits service providers to doing
Network
Operator 5
Network
Operator 6
Network
Operator 7
Network
Operator 8
business on a regional basis with just one or two partners, rather than on a national basis, because of the number of interconnections that may be
Figure 2: The Clearinghouse solution to interconnectivity
Interconnection is simply an e-commerce or
business-to-business trade between and among carriers. Interconnectivity of telecommunication Operators in Nigeria has come a long way with series of challenges from Equipment Inter- Operability of Call Data Record (CDR) for the purpose of settling the Bills of the very traffics terminated. This is to ensure efficient and high quality of services to the end user at a very competitive price since Operators are growing very fast and expanding into all types of telephony – fixed, mobile, Long Distance (National & International) and also into convergent networks[2].
involved.
To deliver the required nationwide service, a new operator had to establish not only one connection but also multiple connections, (i.e., a separate electronic gateway) to each major mobile operator in Nigeria (See also figure 1). The cost of establishing these electronic switches for the interconnection makes this earlier developed system to be at high rate. This is one of the reasons why the vision of nationwide interconnection remained stymied before the advent of interconnectivity.
IJSER © 2012 http://www.ijser.org
International Journal of Scientific & Engineering Research Volume 3, Issue 4, April-2012 3
ISSN 2229-5518
This situation demanded another approach: one that could simplify, automate and reduce the escalating costs involved in maintaining many-to- many connections. This prompted the government to issue an independent license to a clearinghouse that would encourage unfettered competition. Small operators can now communicate with bigger ones especially the mobile operators with a strict regulation that all must abide with.
The emergence of workable approach to solve the problem of nationwide and global interconnection application service provider (ASP) serves as a centralized, automated clearinghouse for carrier communications and transactions. This ASP receives all messages, and order and preorder information, automatically translates them to the right protocols, and directs them to the appropriate carriers. The business rules of all participating network operators are programmed into the clearinghouse, where they are updated as soon as a carrier's issue changes. Service providers can access the ASP via traditional gateways or the Internet [4].
Interconnecting mobile and fixed line requires
guidelines which govern the operation and the process that gives a clear arrangement for interconnection and provision of services among the licensees. The concept of Interconnect Exchange cum Inter-Carrier Billing Clearing House which serves as a media Gate-way among the connected operators with the use of general acceptable Signaling protocols Signaling Switching Number 7 (SS7) an application which runs in any of the modern Telecommunication Switches. This has help in dealing with the dispute which might arise as a result of full competition in the telecommunications sectors in Nigeria [2].
Call Convergence Services are another type of services that involve licensed operators carrying information from its network (Fixed or Mobile) to another network operator either locally or internationally. It is used by individual operators
depending on the coverage of the license type like; (i) Public Switched Telephone Network (PSTN), (ii) Public Mobile Networks, and (iii) Global Mobile Satellite Services and Very Small Aperture Terminal (VSAT).
Currently, (a) Call Termination (b) Call Transit (c) Call Origination (including carrier selection and carrier pre-selection) and (d) Intelligent Network Calls (using Number Translation Services) are the different call convergence services applicable to the telecommunication sector. Here call termination can be defined as a service where an Operator receives voice band calls from another interconnected Operator, and then terminates (or completes) the calls within its own Public Telecommunications Network. Also a call transit service is defined as a service where an operator acting as a Clearing House receives voice band calls from one operator and routes them to the network of another connected Operators. It does not originate or terminate the call within its own network. Besides, call origination service is a service that provides carrier selection and carrier pre-selection is a service provided for a chosen user. Thus an operator makes calls to an interconnected operator but the originating operator does not bill the caller a retail tariff, but instead bills the other operator at an interconnect rate for originating the call. The call could be for any destination and will not necessarily terminate on the network of the operator who receives the call [5].
The technical aspects which relate to the provision of physical facilities to enable networks connected to communicate with each other and transfer intelligence seamlessly across their boundaries. All the interconnected networks must come to term as regard technical issues to ensure inter-operability, particularly in technical matters.
IJSER © 2012 http://www.ijser.org
International Journal of Scientific & Engineering Research Volume 3, Issue 4, April-2012 4
ISSN 2229-5518
There are basically two levels of interconnection:
i. The horizontal level being the links between different telecommunication networks.
ii. The vertical level being the links between ISPs. This vertical level links customers to the Internet through any of the telecommunication networks.
There is a standard deal with Interconnect issues which is related to the physical connection of separate networks to allow users of those networks to communicate with each other. This brought about the idea of inter-operability. Interoperability is the ability of two or more systems to work in concert with one another to achieve a predictable result. It is the ability of diverse systems made by different vendors to communicate with each other so that users do not have to make any necessary adjustments to account for differences in products or services [6].
All network and transmission equipments for interconnectivity must meet the minimum technical requirement. The Switching and Transmission systems must be designed on the internationally accepted Open Network Architecture (ONA) specifications and installed to the Open Network Provisioning standards. Alternate Routing / Diversity should be provided by either party in accordance with standard network engineering practices. This is just to improve the ASR and the SCR among the operators so as to have a good QoS.
Traffic is defined as the amount of data or the number of messages transmitted over a circuit
during a given period of time. Traffic also includes the relationship between call attempts on traffic- sensitive equipment and the speed with which the calls are completed. In this work, traffic analysis is used to ascertain the level of CCR and ASR in the interconnect system. A properly engineered network must have low blocking probability and high circuit utilization. There are many factors that should be taken into account when analyzing traffic. The most important factors are:
Traffic load measurement
Grade of service
Traffic types
Sampling methods. [7]
The measured QoS parameters (data) as supplied by the ICH involve taking the readings for a period of one week at 15-minute intervals. These intervals are important because they are used to summarize the traffic intensity over a period of time. Taking the measurement throughout the day, we can find the peak hour traffic in any given day. The method used in taking the readings are ; (i) Daily Peak Period (DPP) which records the highest traffic volume measured during the day, (ii) Fixed Daily Measurement Interval (FDMI) which only requires measurements taken only during the predetermined peak period of the day when traffic pattern is predictable. Table 2 shows the QoS parameters collected from ICH which are recorded for ascertain the level of network performance of cellular networks interconnect in Nigeria. The traffic data collected was carries out for seven days of the week (Monday to Sunday). Table 1 is an extract from the entire data collected from the clearing house in August 2011.
Table 1: Results of data collected in August 2011 | ||||||
Network | ASR Inc. (%) | ASR Out (%) | CCR (%) | CSS Inc. | CSS Busy | CSS Congest. |
IJSER © 2012 http://www.ijser.org
International Journal of Scientific & Engineering Research Volume 3, Issue 4, April-2012 5
ISSN 2229-5518
BGLOMN | 33.43 | 12.90 | 100 | 898 | 24662 | 692352 |
BMTNAP | 34.57 | 0 | 0 | 0 | 0 | 0 |
Day Five 19/08/2011 (Fri) | ||||||
BCETMN | 34.86 | 35.55 | 100 | 695 | 3579 | 3094 |
METIMN | 14.14 | 29.46 | 100 | 189 | 19920 | 1766 |
BGLOMN | 33.22 | 12.11 | 100 | 507 | 12022 | 400531 |
BMTNAP | 37.36 | 0 | 0 | 0 | 0 | 0 |
Day Six 20/08/2011 (Sat) | ||||||
BCETMN | 34.52 | 34.23 | 100 | 703 | 3843 | 3483 |
BETIMN | 9.4 | 29.33 | 100 | 219 | 19302 | 647 |
BGLOMN | 31.92 | 12.30 | 100 | 470 | 11682 | 387258 |
BMTNAP | 36.23 | 0 | 0 | 0 | 0 | 0 |
Day Seven 21/08/2011 (Sun) | ||||||
BCETMN | 100 | 32.57 | 100 | 525 | 3645 | 2720 |
BETIMN | 100 | 6.44 | 100 | 249 | 18870 | 648 |
BGLOMN | 100 | 29.44 | 100 | 450 | 11173 | 295844 |
BMTNAP | 0 | 33.43 | 0 | 0 | 0 | 0 |
Source: ICH Nigeria, August 2011.
The Quality of Service Audit of the various mobile operators network that was conducted by
tecℎnical researcℎ and standard (TRS) of NCC
to determine the performance of networks during
the month of (March 2009).The two main groups of
i. Traffic Channel Congestion(TCHC) (Without Handover): This is a performance indicator that shows the congestion of the voice channel.
total calls congested
operators considered are: (A) GSM and (B) CDMA
TCHC =
![]()
total calls attempted × 100% (1)
The KPIs considered relevant to show the state of the networks are crucial to service providers who are concerned about maintaining reliable and stable networks in order to satisfy their subscribers. The indicators are:
ii. Handover: This is the process in which control of a call is passed from one cell to another while the MS moves between calls.
iii. Percentage of utilization (% TCH): This is the number of minutes of call that occurs at the
IJSER © 2012 http://www.ijser.org
International Journal of Scientific & Engineering Research Volume 3, Issue 4, April-2012 6
ISSN 2229-5518
same time over the maximum traffic permitted with a grade of service (GOS) equal 2%.
total minutes of calls
% TCHU =
![]()
total period specified ×
100% (2)
iv. Call Setup Success Rate (CSSR): Call Setup is an exchange of signaling information in the call process that leads to traffic channel seizure. The rate is the number of unblocked call attempts divided by the total number of call attempt![]()
CSSR number of unblocked calls (3)
total number of calls attempted
v. Call Drop Rate (CDR): The Call Drop is a
premature termination of calls before being released normally by either the caller or called party. That is before the exchange of Release Message and Release Complete Message in signaling flow.![]()
CDR unsuccessful calls (4)
total calls attempted
Following the monitoring activities carried out on
the identified GSM operators mentioned, the performance statistics for the month of March
2009 are presented in Table 2. The figures represent network-wide average values of the Key Performance Indicators (KPIs) [8].
(Source: Consumer Affairs Bureau of NCC , ‘March
2009’)
In today’s competitive telecommunication environment, emphasis has shifted to delivery of exceptional services while maintaining a low cost operation. The telecommunication service providers are faced with the challenge to deliver high quality service, Innovative at a time of rapid change and cost pressure. Improved network availability and enhanced quality of service of network generated performance data can play significant roles in attaining the goal of interconnectivity.
Performance data is a resource for the information needed to manage the networks in a proactive way so that service problem can be addressed before it affects the customer. Much of raw data about various network elements is not useful until it is translated into real information.
Interconnection accounts for between 20%- 70% of operating costs, depending on the particular product. If regulators fail to understand, they can distort market entry signals, invalidate investments and encourage the abuse of dominant positions to the detriment of customers.
IJSER © 2012 http://www.ijser.org
International Journal of Scientific & Engineering Research Volume 3, Issue 4, April-2012 7
ISSN 2229-5518
Interconnectivity is ideally settled among operators by themselves with the industry regulator, Nigerian Communications Commission (NCC) stepping in only when there is a serious dispute or crisis. The first result in figure 3 shows plot of the call completion ratio versus the different days for networks. This is the ratio of successfully completed calls to the total number of attempted calls at any given point of a network.
From the graph and analysis taken, Airtel had an average of about 75% of Call Completion Rate recorded for all the GSM operators within the network. Usually, for an effective network, the call completion rate should be 100%. The higher the percentage, the better.
Figures 4 and 5 show the graphical relationships between the answer seizure ratio with the number of days for different networks. While figure 4
services, creative billing programs and increased churn rates have intensified the fight. Now more than ever we need to concentrate efforts on keeping your hard-won customers happy with their service.
Because subscribers, by and large, don't understand the technical jargon related to wireless services, they tend to judge the performance of your network at a very simple level- their ability to successfully place and end a call. Because of the way wireless services are marketed, customers have come to expect no difference in the performance of a wireless service compared with that of fixed-line service. About the only problem they will tolerate when placing a call is a busy tone from the called party, and even then not all the time.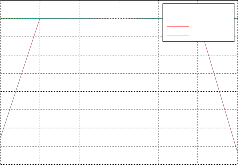
101
depicts the different incoming answer seizure on different days, figure 5 shows different outgoing answer seizure ratio on different days.
100
99
98
CCRA[AIR] CCRE[ETI] CCRG[GLO] CCRM[MTN]
Since busy signals and other rejections by the called number count as call failures, the calculated ASR value can vary depending on user behavior. Lower ASR may be caused by the Far End switch congestion, not Answering by called party and busy number at far end; all these factors bring a low (Poor) ASR which is uncontrollable by the operators.
The ASR is a measure of network quality defined in ITU SG2 Recommendation E.411: International
97
96
95
94
93
92
0 50 100 150 200 250 300
DAYS
Figure 3: Graph of different Call Completion Ratio on different days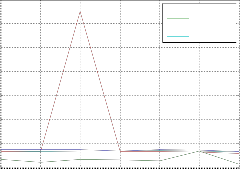
350
ASRIA[AIR] ASRIE[ETI]
network management - Operational guidance.
In Nigeria the communications commission (NCC) has set the licensing standards of Inward ASR requirements of 55% and outward ASR requirements of 66%. [7]
We are well aware that the battle for new subscribers has never been hotter. Increased competition, new digital technologies, enhanced
300
250
200
150
100
50
0
ASRIG[GLO] ASRIM[MTN]
0 50 100 150 200 250 300
DAYS
IJSER © 2012 http://www.ijser.org
International Journal of Scientific & Engineering Research Volume 3, Issue 4, April-2012 8
ISSN 2229-5518
Figure 4: Graph of different incoming Answer
Seizure Ratio on different days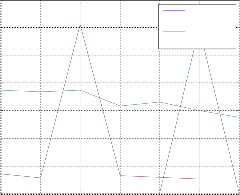
350
ASROA[AIR] ASROE[ETI]
particularly at peak traffic times, blocking access to the network
Absence of RF (15%): Caused by poor coverage, shadowing, no in-building
coverage or network equipment failure
300
250
200
150
100
50
0
ASROG[GLO] ASROM[MTN]
0 50 100 150 200 250 300
DAYS
Phone or subscriber problems (9%): Poorly
performing subscriber units, damaged or out of specification; poorly educated customers using handsets incorrectly by not raising antennas, choosing ill-advised locations to attempt calls or trying to place calls while outside advertised network coverage boundaries.
It is good network management to know in advance from the customers the problems they
Figure 5: Graph of different outgoing Answer
Seizure Ratio on different days
Unfortunately, reality does not always match expectations when it comes to wireless, which results in customers complaining about poor performance of the service. They eventually will churn if the perceived bad performance continues. It is the job of the communication engineers to see that the customers are able to place calls satisfactorily and hang up in their own time, regardless of the technical reasons for call- completion problems.
A range of factors can result in a customer's failing to complete a call satisfactorily. Although the percentages below will vary from network to network, they are a fair indication of the breakdown of call-completion problems facing networks and their subscribers:
Handoff problems/dropped calls (29%): Incorrect neighbor lists, incorrect network
handoff parameters, settings or hysteresis
resulting in dropped calls
Interference/quality (25%): Co-channel or adjacent channel or from external sources
Lack of capacity/blocking (22%): Lack of capacity channels, trunks or resources,
may find when using their various network. The network operators have the ability to check quickly on the reported problems. These network problems can be monitored via regular network audits or technical reviews.
From the results of this study, it is evident that the four GSM operators in Nigeria are not too far from providing reliable services. None of the GSM operators considered in the study has up to 100% call completion success rate. This is an indication that the service retainability of all GSM networks in the country is not satisfactorily very high . In fact, less than 90% of subscribers in each network get their calls completed before the call drop. This is an indication that the call drop rates on the networks are somehow low. The service retainability shows how long a subscriber stays on a network after the call has been set up or established; it is the measure of probability that an established call will not disconnect while conversation is in progress.
Likewise, the network accessibility on all the networks considered is low with half of the subscribers in each of the network need to dial three or more times before having access into various networks. This is an indication that the
IJSER © 2012 http://www.ijser.org
International Journal of Scientific & Engineering Research Volume 3, Issue 4, April-2012 9
ISSN 2229-5518
congestion rates on the networks are high. It shows that all the GSM operators considered have more subscribers but lack sufficient equipment to support their daily increasing customer base. In addition, the result of the study as shown in the figures 3, 4, 5 shows that the bandwidth offered to the operators for network coverage for the entire nation is however overstretched. The study also reveals better performance of all the networks in terms of service integrity most especially in voice quality.
From the available data and the result of the analysis, it can be concluded that the QoS and overall performance of the GSM operation in Nigeria unsatisfactory and fairly reliable. It is an indication that Nigerians are yet to really enjoy fully the impact of GSM as a new effective means of telecommunication. In order to correct this ugly situation in the country and any other countries with similar situation, we are concluding this work by advising the network operators to optimize the allotted spectrum efficiently by building more BTs. This will ensure increased capacity, though the interconnectivity will be degraded as a result of congestion.
[1] Nigerian Communications Commission (NCC), “Interconnectvivty among network providers in Nigeria, NCC quarterly appraisal, 2005.
[2] Interconnect Clearing House Nig. Ltd ‘www. Interconnectnigeria.com’, 2009
[3] Rakesh Mittal, “Essential guide to telecommunications”, India 2004.
‘www.iec.org’, International Engineering
Consortium, 2010.
[5] Nigeria Communications Commission, “Interconnection Guideline”, October 14th, 2002.
[6] Nigerian Communications Commission (NCC), “Technical standard for Interconnectivity of Network”, NCC 2005
[7] Aluko Mobolaji E., “(Inter)Connectivity Issues in Nigeria: Some Perspectives”, Nigeria Telecomm summit, London Sept. 2004.
[8] Nigeria Communications Commission (NCC), “Performance Report of Mobile Operators Network (GSM and CDMA) in Nigeria for the Month of March 2009”, NCC Publications 2009.
Ohaneme Cletus O. is a lecturer in the department of Electronic and Computer Engineering of Nnamdi Azikiwe University, Awka, Nigeria. He is currently pursuing his PhD degree in Communication Engineering in the department of Electrical/Electronic Engineering of Enugu State University of Science & Technology Enugu, Nigeria.
E-mail: engrohaneme@yahoo.com
Akpado Kenneth A. holds PhD in Computer and Control Engineering from Nnamdi Azikiwe University Awka, Nigeria. He is currently a lecturer in the department of Electronic and Computer Engineering,
Nnamdi Azikiwe University, Awka, Nigeria.
E-mail: kenakpado@yahoo.com
Alumona Theophilus L. is a lecturer in the department of Electronic and Computer Engineering, Nnamdi Azikiwe University Awka, Nigeria. He is currently pursuing
PhD degree in Communication Engineering in the same department and University.
E-mail: hontheo@yahoo.com
Emenike Stephanie I. holds B.Eng. in
Electronic and Computer Engineering
IJSER © 2012 http://www.ijser.org
International Journal of Scientific & Engineering Research Volume 3, Issue 4, April-2012 10
ISSN 2229-5518
(Communications option) from the department of Electronic and Computer Engineering, Nnamdi Azikiwe University, Awka, Nigeria.
E-mail: ije emenike@yahoo.com .
I£ER lb) 2012 http://www.ijserorq