International Journal of Scientific & Engineering Research, Volume 4, Issue 12, December-2013 279
ISSN 2229-5518
Performance Analysis of Various Recommendation Algorithms Using Apache Hadoop and Mahout
Dr. Senthil Kumar Thangavel, Neetha Susan Thampi, Johnpaul C I
Abstract - Recommendations are becoming personnel assistance to customers to find out the best item out of most used ones or the best item which has maximum popularity. Most of the recommendations are based on the machine learning algorithms which will perform learning using the datasets and standard set of programs which uses the underlined dataset for further prediction. It also utilizes knowledge discovery techniques to the problem of making personalized product recommendations during a live customer interaction. The tremendous growth of customers and products in recent years poses some key challenges for recommender systems. They include producing high quality recommendations and performing many recommendations per second for millions of customers and products. For building recommender systems many of them use Collaborative Filtering technique. It predicts the utility of an item for a particular user based on the user’s previous interests and takes the opinions from other users. W hen the data set becomes larger, the processing time and recommendations will have latency. It is a greatest challenge to provide recommendation for large-scale problems to produce high quality recommendations. There are various libraries have been released for the development of the recommender system. This paper focuses on comparing the various similarity measurement algorithms and classification accuracy metrics on Hadoop and non-Hadoop environment using Apache Mahout and item-based collaborative filtering. The whole work is done on the Movielens dataset.
Key Words - Apache Hadoop, Mahout, Recommender System, Collaborative Filtering, prediction, datasets and movielens .
IJSER
1. INTRODUCTION
The growth of the websites increases the information and items rapidly. Users are unable to find the relevant information they want. Recommender systems are mechanisms that can be used to help users to make purchase decisions [1]. A recommender system is actually a program that utilizes algorithms to predict customers purchase interests by filtering their shopping patterns. Different approaches and models have been proposed and applied to real world industrial applications. The most popular recommendation technique is the Collaborative Filtering (CF) model. In CF, previous transactions are analyzed in order to establish connections between users and products. When recommending items to a user, the CF- based recommender systems try to find information related to the current user to compute ratings for every possible item. Items with the highest rating scores will be presented to the user.
In recommender systems research, most models work with rating datasets, such as Netflix dataset and Movie-lens dataset. The rating information is very important for obtaining good prediction accuracy, because it precisely indicates user’s preferences and the degree of their interest on certain items. However, the rating information is not always available [2]. Some websites do not have a rating mechanism and thus their users cannot leave any rating feedback on the products. This situation requires
evaluating implicit information which results in a lower
prediction accuracy of the recommender systems. The
information provided includes user ID, product ID and the
clicking history of users with corresponding date.
In a large production environment, the off-line computations are necessary for running a recommender system must be periodically executed as part of larger analytical work-flows and thereby underlie strict time and resource constraints [20]. For economic and operational reasons it is often undesirable to execute these off-line computations on a single machine. This machine might fail with growing data sizes and constant hard-ware upgrades. Due to these disadvantages, a single machine solution can quickly become expensive and hard to operate.
In order to solve this problem, the large scale data analytical computations can be done in a parallel and fault- tolerant manner on a large number of commodity machines [12]. Doing so will make the execution independent of single machine failures and will further more allow the increase of computational performance by simply adding more machines to the cluster.
The section 2 focusing on the related work, section 3 and section 4 focusing on collaborative filtering and the experimental analysis and finally the section 5 and 6 shows the conclusion and the future work.
IJSER © 2013 http://www.ijser.org
International Journal of Scientific & Engineering Research, Volume 4, Issue 12, December-2013 280
ISSN 2229-5518
2. RELATED WORK
The recommendation systems have been a popular topic ever since the ubiquity of the Internet made it clear that people from different backgrounds would be able to access and query the same underlying data [21]. Recommendation systems uses machine learning technologies for filtering the unseen information and can predict whether a user would like a given resource. There are three major steps in the recommendation systems as shown in the figure below: 1. object data collections and representations, 2. similarity decisions, and 3. recommendation computations. Recommendation systems use efficient prediction algorithms so as to provide accurate recommendations to users [17].
2.1. Algorithms in Recommender System Research
Recommender systems are made up of different algorithms which will suit to their needs. Some of the most prominent
among the group are described below.
6. Demographic Recommender systems: It categorizes
users or items based on their personal attribute and make recommendation based on demographic information.
There are different algorithms exists in the recommender system. However, the best one is collaborative filtering approach. Collaborative Filtering Systems can recommend any type of content. It can filter based on complex and hard to represent concepts such as taste and quality.
2.2. Types of Recommender Systems
The Collaborative filtering was first coined by Goldberg for email filtering system called Tapestry4 [19]. Tapestry was an electronic messaging system that allowed users to rate messages. Tapestry provided good recommendations, but it has drawback: the user was required to write complicated queries.
The GroupLens5 generate the automated recommendation system. The GroupLens system provided users with recommendation on Usenet6 postings. It recommended
articles to the users similar to the target user.
IJSER
1. Random Prediction Algorithm: This algorithm randomly
takes an item from the large set of items and recommends to the user. This algorithms accuracy depends on the luck, so this algorithm is a failure one.
2. Frequent Sequence Algorithm: It recommends items to user based on how frequent user rates an item. It uses frequent pattern to recommend items to the users. The accuracy of this algorithm depends on when user makes minimum purchases.
3. Collaborative Filtering: This algorithm identifies users that have relevant interests and preferences by calculating similarities and dissimilarities between user profiles. The technique is that, it may be of benefit to one’s search for information to consult the behavior of other users who share the same or relevant interests and whose opinion can be trusted.
4. Content Based: This algorithm attempt to recommend items that are similar to items the user liked in the past. Items are selected for recommendation is items that content correlates the most with the user’s preferences. A content based algorithm identifies items that are of particular interest to the user.
5. Hybrid Recommender Systems: It combines both the content and the collaborative filtering algorithms.
Ringo recommender system was developed by
Shardanandand Maes and it is used as recommendations for music albums and artists. Here recommendations are done using e-mails. Also video recommendation systems are there, they are also using recommendations through emails.
Bayesian network based recommender system is represented by decision tree. Information of uses is represented by the nodes and edges. The size of the trained model is very small so that it is very fast to deploy it. It gives accurate as nearest neighbor methods, it does not provide accurate prediction for the frequent changing situation.
Horting is a technique based on graph. Here, the node represents user and the edges represent the similarity degree between two users. Here, the recommendation is made by searching for the nearest neighbor nodes and then combining the scores of the neighbors.
3. COLLABORATIVE FILTERING
Collaborative Filtering is the one of the most successful technologies of the recommender system. It finds the relationships among the new individual and the existing data in order to further determine the similarity and provide recommendations. It uses user ratings of products
IJSER © 2013 http://www.ijser.org
International Journal of Scientific & Engineering Research, Volume 4, Issue 12, December-2013 281
ISSN 2229-5518
in order to identify additional products that the new user may like as well. Collaborative filtering techniques are
being applied to larger and larger sets of items. The work- flow of collaborative systems is evident from the figure below[25].
Fig. 1: Collaborative Work-flow
A user expresses the opinions by rating items of the system. These ratings can be viewed as an approximate representation of the user’s interest in the corresponding domain.
1. The system matches this users rating against other users and finds the people with most similar tastes.
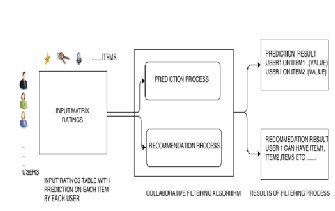
2. With similar users, the system recommends items that the similar users have rated highly but not yet being rated by this user.
There are two methods in the collaborative filtering, they are User-based Collaborative Filtering and the Item-based Collaborative Filtering.
3.1. User-based Collaborative Filtering
User-based Collaborative Filtering is also called nearest- neighbor based Collaborative Filtering; it uses the entire user-item data base to generate a prediction. These systems use statistical techniques to find users nearest-neighbors, who have the similar preference with the target user. After finding nearest-neighborhood of users, these systems use different algorithms to combine the preferences of neighbors to produce a prediction or top-N recommendation for the target user [34]. The User-based similarities are computed using row-wise. User-based Collaborative algorithms have been popular and successful in past, but it has some potential challenges.
The user-based algorithm does not scale well and are not suitable for the large databases of users and items.
3.2. Item-based Collaborative Filtering Algorithm
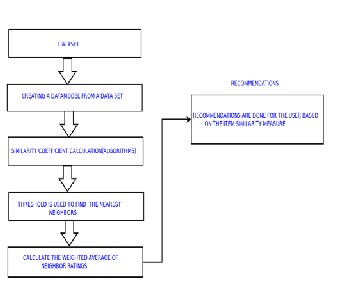
To overcome the problems of the user-based, item-based recommender systems were developed. Item-based recommender is a type of collaborative filtering algorithm that look at the similarity between items to make a prediction. The item-based similarities are computed using column-wise. The work-flow of the item based collaborative filter is as shown in figure 2 below:
EFig. 2: Item-bRased Collaborative Filtering Work-flow
Item-based collaborative filtering algorithm is calculated using the item-user rating matrix. User-item matrix is
described as an m, n ratings matrix 𝑅𝑚,𝑛 , where row
represents m users and column represents n items. The
element of matrix 𝑟𝑖,𝑗, means the score rated to the user i on
the item j, which commonly is acquired with the rate of
user interest.
Item-based algorithms are two steps algorithms; 1. The algorithms scan the past information of the users, the ratings they gave to items are collected during this step. From these ratings, similarities between items are built and inserted into an item-to-item matrix M. The elements of the matrix M represents the similarity between the items in row i and the item in column j. 2. The algorithms select items that are most similar to the particular item a user is rating. Similarity values are calculated using the different measures, Pearson, Cosine Coefficient and so on. The next step is to identify the target item neighbors; this is calculated using the threshold-based selection and the top-
IJSER © 2013 http://www.ijser.org
International Journal of Scientific & Engineering Research, Volume 4, Issue 12, December-2013 282
ISSN 2229-5518
n technique. Then final step is the prediction from the top-n results. To compute the calculation of the similarity
measurement, would consume intensive computing time and computer resources. When the data set is large, the calculation process would continue for several hours. This can be solved by using collaborative filtering algorithm on the Hadoop platform.
4. OVERVIEW OF MAPREDUCE
The MapReduce model is proposed by Google. The MapReduce is inspired by the Lisp programming language. MapReduce is a framework for processing parallelizable problems across huge datasets using a large number of computers, collectively referred to as a cluster or a grid. Computational processing can occur on data stored either in a file-system (unstructured) or in a database (structured). MapReduce can take advantage of locality of data, processing data on or near the storage assets to decrease transmission of accumulated data as a part of the reduction.
file, the Hadoop platform initializes a mapper to deal with it, the files line number as the key and the content of that
line as the value. In the map stage, the user defined process deal with the input key/value and pass the intermediate key/value to the reduce phase, so the reduce phase would implement them [4]. When the files block are computed completely, The Hadoop platform would kill the corresponding mapper, if the documents are not finish, the platform would chooses one file and initializes a new mapper to deal with it. The Hadoop platform should be circulate the above process until the map task is completed. This section explains the working of the collaborative filtering within the MapReduce framework. For making recommendations, the first step is store the txt or .csv files in the Hadoop Distributed File System (HDFS).
4.1. Mapping Phase in Collaborative Filtering
The ratings.csv file is stored in the HDFS. The HDFS splits the data and gives that data to each Datanode, and initializes the mappers to each node. The mappers build the ratings matrix between the users and the items at first, the
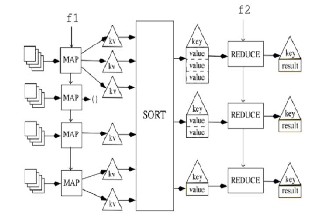
mapper read the item ID file by line number, take the line number as the input key and this line corresponding item ID as the value.
4.2. Reduce Phase in Collaborative Filtering
In the reduce phase, the Hadoop platform would generates reducers automatically. The reducers collect the users ID and its corresponding recommend-list, sort them according to user ID.
Fig. 3: MapReduce Work-flow
The calculation process of the MapReduce model into two parts, Map and the reduce phase. In the Map, written by the user, it takes a set of input key/value pairs, and produces a set of output key/value pairs. The MapReduce library groups together all intermediate values associated with the same intermediate key and passes them to the Reduce phase. In the Reduce phase, the function also written by the user, accepts an intermediate key and a set of values for that key. It merges together these values to form a possibly smaller set of values [3].
In the Hadoop platform, default input data set size of one mapper is less than 64MB, when the file is larger than
64MB, the platform would split it into a number of small
files which size less than 64MB automatically. For the input
5. APACHE MAHOUT AND SIMILARITY MEASUREMENTS
Apache Mahout, is an open source machine learning library from Apache. Mahout will provide sufficient framework utility for distributed programming [9]. It is scalable. Mahout can handle large amount of data compared to other machine learning frameworks [10][11]. It has a collection of algorithms namely Collaborative Filtering, Clustering, and Classification of machine learning. When combined with Apache Hadoop, Mahout can distribute its computations across a cluster of servers. Its scalability and focus on real- world applications make Mahout an increasingly popular choice for organizations seeking to take advantage of large- scale machine learning. Mahout is readily extensible and provides Java classes for customization. Mahout incorporates various methods of calculating the similarity measurements on the dataset. Similarity calculation is the very next step performed after the map reducing
IJSER © 2013 http://www.ijser.org
International Journal of Scientific & Engineering Research, Volume 4, Issue 12, December-2013 283
ISSN 2229-5518
operations. The different similarity measurement algorithms are:
Euclidean Distance Similarity: It computes Euclidean distance between each items preference vector. The shorter the distance between these preferences vector the greater the similarity. The Euclidean distance between two vectors i and j is equal to the root of the sum of the squared Reduce Phase using Collaborative Filtering distance between the coordinates of a pair of vectors. The equation is shown below,
Where 𝑃𝑢𝑡 is the rating of the target user u to the neighbor
item t , sim(t, i) is the similarity of the target item t and the
neighbor item i , and c is the number of the neighbors. The predicted ratings are sorted and store them in recommended list. The user ID and its corresponding recommend-list as the intermediate key/value, output them to the reduce phase. If the Hadoop platform has not
enough resources it initializes a new mapper, the platform has to wait for a mapper finish its task and release its resources, and then initializes a new mapper to deal with the user ID file. This process will continue until all tasks are completed.

di,j = �∑n
(xik − xjk ) 2
(1)
k=1
After finding the Euclidian distance similarity, then
calculates the similarity value for each pair of items. This is
calculated according the equation shown below. The value
of distance similarity falls between zero and one.
6. EXPERIMENTS AND ANALYSIS
This section mainly focuses on the results by comparing the performance analysis on the Hadoop and without Hadoop platform using the machine learning library Apache Mahout.

d = 1
i,j 1−di,j
(2)
6.1. Dataset
For the experiment, this paper uses 1M MovieLens data set
IJSER
Tanimoto Coefficient: It is also called Jaccard Coefficient. It is also defined as the ratio of intersection of ratings to difference between the sum of the ratings and intersection of the ratings. It is used when the dataset is sparse. It takes all types of input data such as binary or numbers. The equation is shown below:
to evaluate the performance of this comparison. These data
sets were collected by the GroupLens Research Project at the University of Minnesota and MovieLens is a web-based research recommender system that debuted in fall 1997. Each week hundreds of users visit MovieLens to rate and receive recommendations for movies. This data set contains
10000054 ratings and 95580 tags applied to 10681 movies by
𝑇(𝑋, 𝑌) = 𝑋∩𝑌
(𝑋+𝑌)−(𝑋∩𝑌)
(3)
71567 users of the online movie recommender service. The
data are contained in three files, movies.dat, ratings.dat and
Log-likelihood Coefficient: It is also based on number of items in common between two users, but, its value is more an expression of how unlikely it is for two users to have so much overlap, given the total number of items out there and the number of items each user has a preference for. This is calculated using,
tags.dat. Rating data files have at least three columns: the user ID, the item ID, and the rating value. The user and item IDs are non-negative long (64 bit) integers, and the rating value is a double (64 bit floating point number). Each user at least rates 20 movies; rate them from one to five stars. The ratings 1 and 2 are on negative ratings, 4 and 5 representing positive ratings, 3 indicating ambivalence and
𝑓(𝑦, 𝜃) = ∏𝑛
𝑓𝑖 ( 𝑦𝑖 , 𝜃) = 𝐿(𝜃; 𝑦) (4)
0 indicates negative rating. Users show their interest by number they rated [24].
The next step is to identify the target neighbors. This is
calculated using the threshold-based selection. In the threshold based selection, items whose similarity exceeds a certain threshold are considered as neighbors of the target item. Then the final step is the prediction, to calculate the weighted average of neighbor’s ratings, weighted by their similarity to the target item. The rating of the target user u to the target item t is as following:
6.2. Evaluation Metrics
In recommender systems, most important is the final result obtained from the users. In fact, in some cases, users doesn’t care much about the exact ordering of the list a set of few good recommendations is fine. Taking this fact into evaluation of recommender systems, we could apply classic information retrieval metrics to evaluate those engines: 1.
𝑃𝑢𝑡 =
𝑐

𝑖=1
𝑃𝑢𝑡 × sin(𝑡,𝑖)
(5)
Precision 2. Recall and 3. F1-Score. These metrics are widely
𝑐
𝑖=1
sin( 𝑡,𝑖 )
used on information retrieving scenario and applied to
IJSER © 2013 http://www.ijser.org
International Journal of Scientific & Engineering Research, Volume 4, Issue 12, December-2013 284
ISSN 2229-5518
domains such as search engines, which return some set of best results for a query out of many possible results
[34][27]. For a search engine for example, it should not return irrelevant results in the top results, although it should be able to return as many relevant results as possible. Precision is the proportion of top results that are relevant, considering some definition of relevant for your problem domain. The Precision at 10 would be this proportion judged from the top 10 results. The Recall would measure the proportion of all relevant results included in the top results.
In a formal way, we could consider documents as instances and the task it to return a set of relevant items given a search term. So the task would be assigning each item to one of two categories: relevant and not relevant. Recall is defined as the number of relevant items retrieved by a search divided by the total number of existing relevant items, while precision is defined as the number of relevant items retrieved by a search divided by the total number of items retrieved by the search.
results divided by the number of all returned results and r is the number of correct results divided by the number of
results that should have been returned. It should interpret it as a weighted average of the precision and recall, where the best F1 score has its value at 1 and worst score at the value 0.
F-Score calculation using precision and recall is as follows:

precision.recall
F-Score = 2.precision + recall (8)
In recommendations domain, it is considered an single
value obtained combining both the precision and recall
measures and indicates an overall utility of the recommendation list.
Evaluations are really important in the recommendation engine building process, which can be used to empirically discover improvements to a recommendation algorithm.
6.3. Experimental Results And Analysis
The Hadoop cluster used for all the experiments composed
IJSER
In recommender systems those metrics could be adapted
hence; the precision is the proportion of recommendations that are good recommendations,

tp
Precision = tp +fp, (6)
And recall is the proportion of good recommendations that
appear in top recommendations.

tp
Recall = tp +fn (7)
Where 𝑡𝑝 is the interesting item is recommended to the
user, 𝑓𝑝 is the uninteresting item is recommended to the
user, and the 𝑓𝑛 is the interesting item is not recommended
to the user.
In recommendations domain, a perfect precision score of
1.0 means that every item recommended in the list was good (although says nothing about if all good recommendations were suggested) whereas a perfect recall score of 1.0 means that all good recommended items were suggested in the list.
Typically when a recommender system is tuned to increase precision, recall decreases as a result (or vice versa).
The F-Score or F-measure is a measure of a statistic test’s accuracy. It considers both the precision p and the recall r of the test to compute the score: p is the number of correct
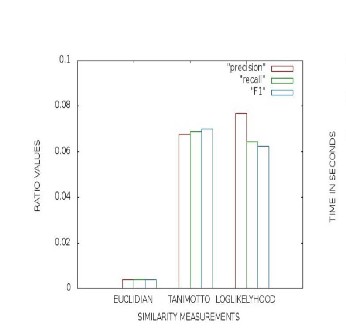
by five computers, one of them serves as NameNode and others as DataNodes, operating on Linux. However, we compare the performance analysis using Hadoop and without using Hadoop environments. The figure 7 is the comparison of the different similarity algorithms using classification accuracy metrics; it shows log-likelihood similarity algorithm is the better model for the item-based recommendation.
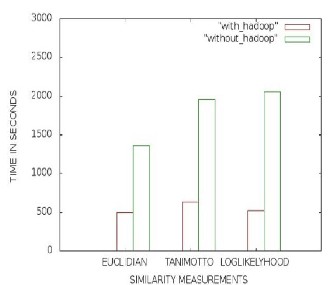
The figure 8 and figure 9 is the comparison of different similarity measurement algorithms based on the time. Here the experiment is done on the hadoop and the nonhadoop platform. In the nonhadoop platform the program took two
IJSER © 2013 http://www.ijser.org
International Journal of Scientific & Engineering Research, Volume 4, Issue 12, December-2013 285
ISSN 2229-5518
Fig. 6: Time variation in calculation of accuracy metrics on hadoop and nonhadoop platform
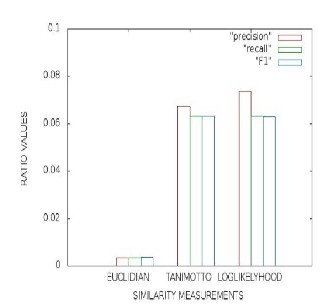

Fig. 4: Accuracy metric ratio calculation with different recommendation algorithms on a nonhadoop platform
Fig. 7: Performance analysis of item-item based recommendations on mahout using hadoop and nonhadoop platform
Fig. 5: Accuracy metric ratio calculation with different recommendation algorithms on a hadoop platform
day to complete the execution. But in the case of the hadoop platform it took only seconds for the execution. The final result from all these graphs is that by using the
hadoop platform, the terabytes of the data can handle within seconds. The hadoop can handle the data efficient and fairly linear. Also the data and processing are taking place on the same servers in the cluster, so every time you add a new machine to the cluster, the system gains the space of the hard drive and the power of the new processor.
7. CONCLUSION
IJSER © 2013 http://www.ijser.org
International Journal of Scientific & Engineering Research, Volume 4, Issue 12, December-2013 286
ISSN 2229-5518
Recommendation engines are a natural fit for analytics platforms. They involve processing large amounts of consumer data that collected online, and the results of the analysis feed real-time online applications. Hadoop is being increasingly used for building out the recommendation platforms. This paper mainly focuses on evaluating the classification accuracy metrics using the Apache Hadoop and Mahout. By experiments we conclude that, Mahout can handle large amount of structured data, using the machine learning algorithms. Now days, the data size is increasing with the unstructured format, it is not possible to handle with the Mahout. When we combine Apache Hadoop and Mahout for the recommendation, it can recommend large amount of structured and the unstructured data efficiently and fastly.
8. FUTURE WORK
By using the Apache Hadoop and Mahout, can recommend large amounts of data efficiently. But when it comes to real time, random access is not possible by using Apache Hadoop. Hence, instead of storing the Hadoop sequence
[4] OReilly, “Hadoop Definitive Guide”, 2nd ed, October 2010.
[5] F.Wang, J.Qiu, J.Yang, B.Dong, X.H.Li, and Y.Li, “Hadoop high avail-ability through metadata replication”, Proc. of CloudDB, 2009, pp.37-44.
[6] M.Zaharia, A.Konwinski, A.D.Joseph, R.H.Katz and I.Stocia, “Improving Map-reduce Performance in Heterogeneous Environments”, Proc. Of SDI, 2008, pp-29-42.
[7] Konstantin Shvachko, Hairong Kuang, Sanjay Radia and Robert Chansler, “The Hadoop Distributed File System”, Proc. of OSD, 2010, pp.1-10.
[8] Jeffrey Dean and Sanjay Ghemawat, “Map-reduce: Simplied Data
Processing on Large Clusters”, in Proc. of OSDl, 2004, pp.137- 150.
[9] Sean Owen, Robin Anil, Ted Dunning and Ellen Friedman, “Mahout in Action”, Manning Publications 2012.
[10] Rui Mximo Esteves and Chunming Rong, “Using Mahout for clustering Wikipedia’s latest articles”, Proc. of Third IEEE International Conference on Cloud Computing Technology and Science, 2011, pp.565-569.
[11] Lima, Haihong E and KeXu, “The Design and Implementation of
Distributed Mobile Points of Interest(POI) Based on Mahout”, Proc. Of
IJSER
file in the HDFS, use Hbase or Sqoop for retrieving the data
real time. Also, by combining both the item-based and the
user-based collaborative filtering, recommender system can predict accurate recommendations to user.
Authors Details
1. Dr.Senthil Kumar Thangavel, Assistant Professor(Selection Grade), Department of Computer Science And Engineering, Amrita School Of Engineering, Coimbatore, India. Email: senthan111@gmail.com.
2. Neetha Susan Thampi, M.Tech Student, Department of Computer Science And Engineering, Amrita School Of Engineering, Coimbatore, India. Email: netasusan@gmail.com
3. Johnpaul C I, M.Tech Student, Department of Computer Science And Engineering, Amrita School Of Engineering, Coimbatore, India. Email : johnpaul.ci@gmail.com
REFERENCES
[1] Yueping Wu and Jianguo Zheng, “A Collaborative Filtering Recommendation Algorithm Based on Improved Similarity Measure Method”, Proc. of Progress in informatics and computing, 2010, pp.246-
249.
[2] Xiwei Wang, Erik von der Osten, Xuzi Zhou, Hui Lin and Jinze Liu, “Case Study of Recommendation Algorithms”, Proc. of International Conference on Computational and Information Sciences, 2011, pp.410-417.
[3] Chuck Lam, ” Hadoop in Action”, January 2010.
6th International Conference on Pervasive Computing and Applications,
2011, pp.99-104.
[12] Dhoha Almazro, Ghadeer Shahatah, Lamia Albdulkarim, Mona Kherees, Romy Martinez and William Nzoukou, “A Survey Paper on Recommender Systems”, Proc.of ACM SAC, 2010, pp.1-11.
[13] Xingyuan Li,” Collaborative Filtering Recommendation Algorithm Based on Cluster”, Proc of International Conference on Computer Science and Network Technology, 2011, pp.2682-2685.
[14] FaQing Wu, Liang He, Lei Ren and WeiWei Xia, “An Effective Similarity Measure for Collaborative Filtering”, Proc of International Conference on Computer Science and Service System, 2012, pp.2038-2041.
[15] Xingyuan Li, “Item-based Collaborative Filtering Recommendation Algorithm Combining Item Category with Interestingness Measure”, Proc of International Conference on Computer Science and Service System, 2012, pp.2038-2041.
[16] Dilek Tapucu, Seda Kasap and Fatih Tekbacak, “Performance Comparison of Combined Collaborative Filtering Algorithms for Recommender Systems”, Proc of IEEE 36th International Conference on Computer Software and Applications Workshops, 2012, pp.284-289.
[17] So-Young Yun and Sung-Dae Youn, “Recommender System Based on User Information”, Proc of 7th International Conference on Service Systems and Service Management (ICSSSM), 2010, pp.1-3.
[18] XiaoYan, Shi HongWu Ye and SongJie Gong, “A Personalized Recommender Integrating Item-based and User-based Collaborative Filtering”, Proc of International Seminar on Business and Information Management, 2008, pp.264-267.
IJSER © 2013 http://www.ijser.org
International Journal of Scientific & Engineering Research, Volume 4, Issue 12, December-2013 287
ISSN 2229-5518
[19] Truong Khanh Quan, Ishikawa Fuyuki, and Holien Shinichi, “Improving Accuracy of Recommender System by Clustering Items Based on Stability of User Similarity” , Proc International Conference on Computational Intelligence for Modeling Control and Automation, and International Conference on Intelligent Agents, Web Technologies and Internet Commerce, 2008, pp.1-8.
[20] YU Chuan, XU Jieping and DU Xiaoyong, “Recommendation Algorithm combining the User-Based Classified Regression and the Item-Based Filtering”, Proc ICEC, 2006, pp.574-578.
[21] Carlos E. Seminario David and C. Wilson,” Case Study Evaluation of Mahout as a Recommender Platform”, Proc ACM RecSys, 2012, pp.45-50.
[22] L. Hee-choon, L. Seok-jun and C. Yong-jun, “The Effect of Co- rating on the Recommender System of User Base”, Proc Journal of the Korean Data Information Society, vol.17, no. 3, 2006, pp. 775-784.
[23] M. D. Ekstrand, M. Ludwig, J. A. Konnstan, and J. T. Riedl, “Rethinking the recommender research ecosystem: Reproducibility, openness, and lenskit”, Proc. 5th ACM Recommender Systems Conference (RecSys), October 2011, pp.133-140.
[33] Sarwar, B. and Karypis, “Item-based collaborative filtering recommendation algorithms”, Proc 10th International World Wide Web Conference, 2001, pp.285295.
[34] Y. Koren, “Factor in the neighbors: Scalable and accurate collaborative filtering”, Proc ACM Trans. KDD, 2010, pp.1-24.
[35] Ailin Deng, Yangyong Zhu and Bole Shi, “ A Collaborative Filtering Recommendation Algorithm Based on Item Rating Prediction”, Proc Journal of Software, vol.14, No.9, 2003.
[24] J. L. Herlocker, J. A. Konstan, L. G. Terveen, and J. Riedl, “Evaluating collaborative filtering recommender systems”, Proc ACM
Transactions on Information SystemIs, 2004, pJp.5-53. SER
[25] Manos Papagelis and Dimitris Plexousakis, “Qualitative analysis
of user-based and item-based prediction algorithms for recommendation agents”, Proc Elsevier, 2005, pp.781-789.
[26] Hee Choon Lee, Seok Jun Lee and Young Jun Chung, “A Study on the Improved Collaborative Filtering Algorithm for Recommender System”, Proc Fifth International Conference on Software Engineering Research, Management and Applications, 2007, pp. 297-300.
[27] M. Deshpande and G. Karypis, “Item-based top-N recommendation algorithms”, Proc ACM Transactions information Systems, vol. 22,no. 1, 2004, pp. 143-177.
[28] G. Linden, B. Smith, and J. York, “Amazon.com Recommendations: Item-to-Item Collaborative Filtering”, Proc IEEE Internet Computing, vol.7, no. 1, 2003, pp.76-80.
[29] J. B. Schafer, J. Konstan and J. Riedi,” Recommender systems in e- commerce”, Proc 1st ACM conference on Electronic commerce, ACM Press, Denver, Colorado, USA, 1999, pp.158-166.
[30] P. Resnick, N. Iacovou, M. Suchak, P. Bergstorm and J.Riedl, “GroupLens: An Open Architecture for Collaborative Filtering of Netnews”, Proc ACM 1994 Conference on Computer Supported Cooperative Work, 1994, pp. 175-186.
[31] G. Adomavicius and A. Tuzhilin, “A Survey of the State-of-the-Art and Possible Extensions”, Proc IEEE Transactions on Knowledge and Data Engineering, vol.17, No. 6, 2005, pp. 734-749.
[32] Sebastian Schelter, Christoph Boden and Volker Markl, “Scalable Similarity-Based Neighborhood Methods with Map-reduce”, Proc RecSys, 2012, pp.1-8.
IJSER © 2013 http://www.ijser.org