1
Performance Analysis for Optimization of CDMA 20001X Cellular Mobile Radio Network
Ifeagwu E.N. 1,Onoh G.N.2,Alor M.2, Okechukwu N.1
Abstract- Cellular network operators must periodically optimize their networks to accommodate traffic growth and performance degradation. Optimization action after service rollout is to correct the expected errors in network planning and to achieve improved network capacity, enhanced coverage and quality of service. This paper presents the performance analysis for optimizing mobile cellular radio network with respect to the CDMA 20001X. The various ways of ensuring that the radio parameters are maintained at their standard thresholds after the optimization of the network to enhance the network performance are equally presented. The results obtained before and after optimization were simulated . The results obtained during the various models and techniques clearly showed an improvement in the optimized network performance parameters from the non-optimized network.
keywords:Optimization,multipathpropagation,bandwidth,walshcodes,CDMA20001x
.
1.0 INTRODUCTION
Since the invention of radio telegraph in
1895,wireless communication has attracted great interest and is now one of the most rapidly developing technologies from narrow band voice communication to broadband multimedia communication. The data rate of wireless communications has been increased dramatically from kilobits per seconds to megabits per seconds. However, with increasing demand on wireless internet and personal multimedia, the data rate of wireless communications needs be further expanded.

1.Department of Electronic and Computer Engineering, Nnamdi Azikiwe University, Awka,( scotolysis@yahoo.com)
2Department of Electrical and Electronic Engineering,
Enugu State University of Science and Technology ,ESUT
Future wireless networks face challenges of supporting data rates higher than one gigabytes per seconds[1].
Among numerous factors that limit the data rate of wireless communications, multipath propagation plays an important role[2].In wireless communications, the radio signals may arrive at the receiver through multiple paths because of reflections, diffraction and scattering. This phenomena is called multipath propagation, which causes constructive and destructive effects due to signal phase shifting. Channels with multipath fading fluctuate randomly, resulting in significant degradation of signal quality. When the bandwidth of the signal is greater than the coherence bandwidth of the fading channels, different frequency components
2
of the signals experience different fading. This frequency selective fading may further limit the data rate of wireless communications.
To combat multipath fading, code division multiple access was developed [3].As a spread spectrum modulation, CDMA 20001x over comes multipath fading by transmitting signals which occupy a wider bandwidth. Even a small portion off this wideband channel undergoes deep fading. The loss of signals can be recovered using the rake receiver/maximum ratio combining[4]. By employing multiple antennas at the transmitter and or receiver in a wireless system, the rich scattering channel can be exploited to create a multiplicity of parallel links over the same radio band. This property provides multiple input multiple output(MIMO) with several advantages including array gain, spatial diversity and spatial multiplexing.[5] Array gain refers to the average increase in the signal-to-noise ratio(SNR) that results from a combining of signals from multiple transmit receive antenna pairs. The coherent combining may be achieved at the receiver by maximum ratio combining. Array gain improves the system robustness to noise, thereby improving the coverage of the system.
By providing the receiver with multiple copies of the transmitted signal in space MIMO systems achieve space diversity and effectively mitigate multipath fading thereby improving the quality and reliability of reception .In a scattering environment, a transmitter with an antenna array may transmit multiple independent
data streams within the bandwidth of operating and the receiver with an antenna array which can successfully separate the data streams. In this way, an increase in data rate through spatial multiplexing is achieved.
Wireless communication technologies have basically been developed based on exploring new mobile communication frequency bands, reasonable use of frequency resources and minimization ,portability and multi-functions of mobile stations. The technology of wireless mobile communications with duplex transmission is one of the fastest expanding in the world. The foundation for a widespread commercial deployment of wireless mobile communications was laid with the standardization of the first generation cellular mobile radio systems in the 1980s.
Unlike the TDMA based second generation standards, the IS-95 was developed in the USA, employing code division multiple access (CDMA 2000 1X) with Direct Sequence (DS) spectrum spreading, combined with FDMA. The origin of CDMA 20001X goes back to the beginning of spread spectrum communications in the first half of the 20th century. Code Division Multiple Access (CDMA20001X) is one of the most promising medium access technologies for next generation cellular networks. The primary application of spread spectrum communications was in the development of secure digital communication systems for military use. Since the second half of the 20th
3
century, spread spectrum communications became of great interest also for commercial applications, including mobile multi-user communications. Spread spectrum signals are characterized by their use of bandwidth, which is much greater than the minimum necessary bandwidth for data transmission [7].
The spectrum spreading is achieved by using a spreading code that is independent of the message and is known to the receiver. The receiver uses a synchronized replica of the spreading code to de-spread the received signal allowing recovery of the message. The large redundancy inherent in spread spectrum signals is required to overcome interference caused by the nature of the channel, by intentional disturbances, and by multiple accesses of various users. The exploitation of the spread spectrum technique to enable multiple users a simultaneous access to the channel is called Code Division Multiple Access CDMA [8]. All CDMA20001X users occupy the same frequency at the same time; the frequency and the time are not unique for each user. In CDMA20001X, coding is used to distinguish between users. The interference of CDMA comes mainly from nearby users. CDMA
20001X physical layer Consist of two channels of 1.25 MHz-wide, one from Base Station (BS) to Mobile Station (MS) called Forward Link or Down Link and the other from Mobile Station to Base Station called Reverse Link or Up Link. Each channel made unique by mathematical codes. Code channels in the Forward Link are;
Pilot, Synchronous, Paging, Forward Traffic Channels. Code channels in the Reverse Link are; Access, Reverse Traffic Channels.
CDMA 20001X uses spread spectrum concept and takes benefit from the process gain to increase the number of users per frequency band. There are 8 band classes stipulated in the IS-2000 for the working frequency band of the CDMA 20001X
Recently, there has been an increase in demand for wide-band services such as video-phones and videoconferencing over wireless networks. As a result, networks are fast evolving from voice only networks to multi-service networks supporting a heterogeneous mix of services with varying traffic characteristics. Improved bandwidth allocation is a key requirement for the viability of next generation cellular networks. The challenge comes from efficiently supporting a broad spectrum of services with different Quality of Service (QOS) requirements and traffic characteristics.
CDMA20001X offers some unique features such as soft handoff and the quelling of fast fading through the use of diversity reception, equalization, interleaving and RAKE receivers [9]. A unique feature of CDMA20001X is the universal frequency reuse factor which allows for mobiles to soft handoff between cells. Traditional cellular systems require a break in communication with its current base station prior to making a new connection with the new base station. For analytical purposes, a soft handoff region and normal region is usually
4
defined. Mobile stations in the soft handoff region can be power controlled by two or more base stations, while mobile stations in the normal region are power controlled by the base station in the current cell. During the process of soft handoff, the base stations initially and independently decode the signal that they receive from the mobile station. The base stations then send the information to the mobile switching centre which favors the base station that receives the highest signal strength. On the forward link, the mobile station aggregates the signals from various base stations. Performance is enhanced when the mobile station combines all the different multipath signals to strengthen the received signals. The interference of CDMA comes mainly from nearby users. CDMA physical layer consist of two channels of 1.25
MHz-wide, one from Base Station (BS) to Mobile Station (MS) called Forward Link or Down Link and the other from Mobile Station to Base Station called Reverse Link or Up Link. Each channel made unique by mathematical codes. Code channels in the Forward Link are; Pilot, Synchronous, Paging, Forward Traffic Channels. Code channels in the Reverse Link are; Access, Reverse Traffic Channels.
2.0 CDMA ARCHITECTURE
Code Division Multiple Access (CDMA) is one of the technologies adopted for mobile wireless Communication other than the GSM and it is used also as wireless local loop (WLL).
Beginning with CDMA One this technology is developed towards 3G technologies and CDMA
20001X is now one of the IMT-2000 3G standards. The CDMA 2000 standards are usually implemented technically in two phases.
In the first phase, the CDMA 2000 still adopts the spread spectrum rate of CDMA One, i.e., 1 ×
1.2288Mbps. A single carrier occupies 1.25MHz bandwidth. It adopts DS spread spectrum technology (DS-CDMA). The CDMA 2000 system in the first phase is also called CDMA
20001X. In the second phase, the spread spectrum rate is 3 × /6 × /9 × /12 × 1.2288
Mbps, respectively occupies 5/10/12/15 MHz bandwidth. It adopts multi carrier modulation technology (MC-CDMA).
The CDMA2000 system in the second phase is also called CDMA 2000 3X. In addition, the
1xEVDO Rev A, which serves as an enhanced standard supplemental to IS2000, supports data transmission up to 3.1 Mbps in a bandwidth of
1.25 MHz.[10]
2.1 CDMA Spread-Spectrum Concept Traditional technologies attempt to send the signal into the minimum required bandwidth as quickly as possible. Direct-Sequence Spread spectrum systems merge their input data with a fast spreading sequence and transmit a wideband signal. The spreading sequence is independently regenerated at the receiver side and mixed with incoming wideband signal to recover the original data. [11] .This principle is shown in Figure 1.
5
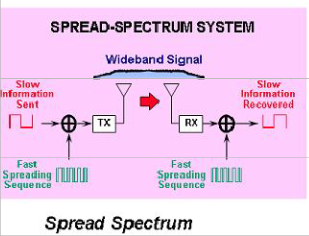
Fig 1: Spread Spectrum concept
Processing Gain: If a signal is deliberately transmitted using more RF bandwidth than required, it is easier to detect at the receiver.
Gain=W (spectrum wide)/R (Bit Rate) (1)
is proportional to the transmitted data rate. Transmitting data symbols of one half-rate frame (4800bps) requires approximately 3dB less power than transmission of one full rate frame (9600bps). Thus, the average transmit power required to support a voice call is proportional to the average vocoded rate of the speech.
Because the total available BS transmit power is limited, a reduction in transmit power required for one user translates to more available power for supporting other users.
Thus, forward link capacity is inversely proportional to the BS transmit power needed for each user. To determine the percentage of change in BS transmit power for mobile B relative to mobile A, we may use the following equation:
Spectrum wide is 1.25 MHz and Bit Rate can be
8kbit for half rate or 13kbit for full rate.
The Processing Gain has big influence on
% B , A

PowerB Power A
Power A
(2)
numbers of user's per bandwidth. CDMA2000
1X can support 22 to 32 voice users per one spectrum.
Since,
Capacity
1

Power
(3)
2.2 Forward Link Capacity Analysis
In a CDMA 20001X system, one of the major factors influencing the forward link capacity is
Resulting difference in forward link capacity due to this difference in channel power can be
determine by:
the availability of base station (BS) transmit
power. Assuming enough walsh codes are
%Capacity
1

PowerB

1

PowerA

1

PowerA 1
PowerB
(4)
available, blocking occurs when the BS does not have sufficient transmit power to support any additional users at their specified target FER. For voice calls, the instantaneous transmit power
PowerA
For examples, using this equation 4, a 50% decrease in channel power translates to a 100% increase in forward link capacity. These
6
calculated forward link capacity increases assume the system is power-limited and not limited by other necessary forward link
resources such as walsh codes. A walsh code-
Ku
I 0W Eb R N 0W
i 1
Where, I 0 is interference density,
(5)
N o is
limited system may not be able to fully achieve the capacity increases calculated from the reduction of required forward transmit power.
thermally noise density, W is the spread
spectrum bandwidth, R is the data rate, and Eb is bit energy.
To maintain system stability, we limit the rise-
I W
2.3. Reverse Link Capacity Analysis
The reverse link of a CDMA20001X system is limited by the level of multiple access interference. Because all users share a common frequency spectrum, each user’s signal interferes
over-thermal ratio
level .
Io

But ,
No
o to a particular outage
N oW
(6)
with the signals of other users. Blocking occurs
Thus,Combining equations 4 and 5, we obtain
when the noise plus interference level caused by users exceeds the background thermal noise level by a specified level. Above this blocking
ku

Eb R ( Io No)W IoW (1 )
i 1
W
(7)
interference-to-noise level, known as outage
Since

Eb Ec .
R
whereE c
represents chip
rise-over-thermal, the addition of only one user
energy, we have
produces a significant increase in interference.
Ku E

c

1 1
K o
(8)
This occurs when, in response to the interference
increase of one user, other users raise their transmit power, thereby increasing their interference to others. Such an occurrence potentially results in system instability. To guarantee stability, the outage rise-over thermal level is typically limited to 6dB to 10dB [12].
i 1 I o
When the condition in equation 2 is not satisfied, the system is considered to be in outage. Therefore, the probability of outage, Pout, is :
k (1 f ) E
To calculate reverse link capacity, we use the
Pout Pr
c K '
(9)
method presented in [13] and assume an isolated cell with ku statistically identical users being independently power controlled. Signals from all users in the cell arrive at the BS with equal strength, so the average noise and interference power I0W at the BS is
i 1 I 0
A Poisson process is a good model for the aggregate traffic of a large number of similar and independent users. Thus, we assume that calls from the entire population in the cell arrive according to a Poisson process with a total
7
average arrival rate of λ calls/second. Call
k (1 f ) E
ku E
c
c
Pout Pr
K0 Pr
ko (11)
service-times are exponentially distributed with
1
Where
i1 Io
i1 Io
average call duration of

seconds. To
' k (1 f )
(12)
determine the occupancy distribution and the profitability of blocked calls, we use the “lost call held” (LCH) model, which assumes that unserved users repeat their call attempts
immediately and remain in the system as typical
Continuing with the probability of outage, we may define the random variable of interest Z ' as the sum of the signals of users in the cell (including the effects of other-cells users).
for mobile communication systems.
The number of active calls in a cell
ku is a

ku
Z ' c
i 1 o
(13)
Poisson random variable with distribution.
The outage probability can now be expressed as
pout
PrZ ' K '
(14)

(
P
u
) K u

e
(10)
Due to inaccuracies in power control loops, the

Ec
ku received
of the R-PICH of a particular
o
ku 0,1,2....
However, the level of interference power at a given base station is caused not only by users in
user is log-normally distributed with a standard deviation of 1.dB to 2.5 dB. Since the strength of the R-FCH is specified as an offset from the
the cell, but also by users in surrounding cells controlled by other base stations. Assuming
R-PICH, the total received

Ec from a user
I o
uniform loading of all cells, interference from users of surrounding cells increases the interference at the base station under analysis by a fraction f of the interference from the
desired cell’s users. If users of surrounding cells are also power controlled and thus have
varies as a function of the data rate. Assuming users exhibit similar data rate characteristics, the

received Ec from different users in the sector
o
may be modeled as independent and identically distributed (IID) random variables. Unfortunately, it is not easy to obtain the exact
similarly distributed
(Ec / Io ) , the average
analytical derivation of the sum of these IID
interference power due to users of surrounding
random variables, the desired random variable
cells can be modeled as
f .ku additional users,
Z ' . Thus, for ease of computation, we can
where
ku is the average number of active users
invoke the Central Limit Theorem to
per cell. Modifying the results of ( 8 ) to include
approximate Z '
as a Gaussian random variable.
the effects of other cell interference, we have
While a stricter upper limit can be obtained by
8
numerically computing the Chernoff bound, simulations run, shows that the Gaussian approximation underestimates this limit by at
most 1%, so it is used here for convenience.

designated blocking probability, which in the above analysis, corresponds to the value of
3.0.RESULTS AND ANALYSIS
Since
Z ' is the sum of '
random variables
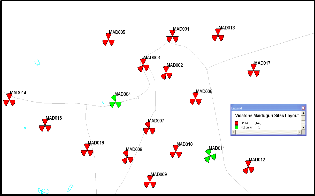
Maiduguri city network area of Visafone
Communications limited, that provides telecommunications services using the
where k '
is itself a random variable.
CDMA 2000 1x technology is used as the
The mean and variance are given by
test bed. This is shown in Figure 2.

EZ' Ek' EEc


1 f .EEc
(15)
u Io
Io

VarZ ' Ek ' VarEc

Vark' EEc
2
(16)
u Io
u Io
Furthermore, since '
variable,
is a Poisson random

Ek ' Vark ' .1 f
(17)
u
so that,
u
Fig .2:Testbed
3.1 (A) System Specification
VarZ '


.1 f .EEc 2
(18)
System Parameter:
Carrier Frequency: 800 MHz
Thus, the normal approximation for probability of outage can be written
Spread Bandwidth: 1.2288MHz
Data Rate: 9.6-153.6 kbps
K '
EZ '
Process Gain: 21 dB
Pout
Q u
(19)
Terminal Noise: 8dBm

VarZ '
Base Station Parameter:
Where
EZ '
is given by equation 15 and

Transmitter Power: 20W
VarZ ' is given equation 16.
The Erlang capacity of the system is measured by the average traffic load corresponding to the number of active users causing blocking with the
Antenna Gain: 15 dBi/directional Feeder loss: 2-5 dB Demodulator’s Eb/No: 3.5 Db
Noise Figure of Receiver: 3.2 dB
9
Subscriber Station Parameter: Transmitter Power: +24 dBm Gain of Antenna: 2 dBm Body Loss: 0 dB Demodulator’s Eb/No: 7.0 dB (at 9.6kps)
Noise Figure Receiver: 8.0dB
Margin:
Shadow Fading Standard Deviation σ: 8 dB Shadow Fading Margin: 5.5 dB Soft-Handoff Gain: 3.7 dB
Interference Margin: 3.01 dB (50% Traffic
Load)
(B) Collation of Data
The researcher was part of the 3 man team of Engineers (2 from Visafone, 1 from Huawei Technologies) that carried out the pre- optimization and post-optimization drive test in the city of Maiduguri, and the collation of data for this research was done using as follows:
A set of drive test equipment with GPS and Qualcomm 1X test mobile station was installed into the test car. Besides, a compatible computer is installed with collection software (Pilot Panorama).The two Mobile stations were set to the status of Markov long call and short call respectively at full rate. MS is used to test Transmit Level (Tx Level), Receive level (Rx Level) and Down link Pilot (Ec/Io) of the primary pilot. The Ec/Io of the primary pilot and Rx level are used to define the forward coverage range of the system. The transmit power of the MS is used to measure the reverse coverage range, Voice long call – origination of outdoor
coverage drive test and Voice short call- origination of outdoor coverage drive test. The data collated from the drive test were processed using the Dingli Panorama equipment and the results of the simulation are shown below
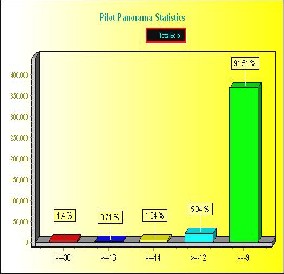
Fig 3 Ec/Io level pre- optimization
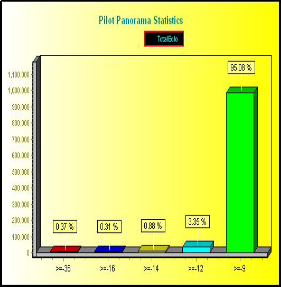
Fig.4:Ec/Io level post-optimization
10
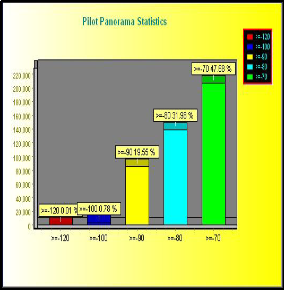
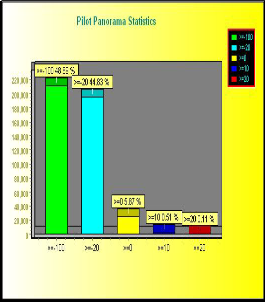
Fig 5. Rx Level pre- optimization
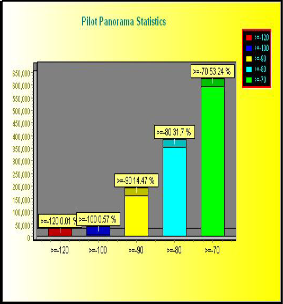
Fig 6: Rx Level post- optimization
Fig.7: Tx Level pre-optimization
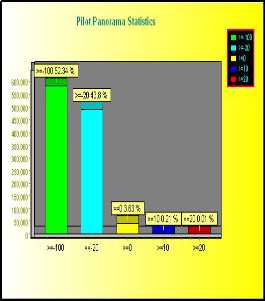
Fig.8:Tx Level post- optimization
11
4.0 SUMMARY OF RESULTS.
The diagrams in Figure 3 and Figure 4 show coverage by Ec/Io in Maiduguri city before and after optimization respectively as was carried out in the network. As shown by statistics in Figure 3, total Ec/Io greater than -9dB was
91.51%, before optimization. However, after optimization, as shown in Figure 4, the value came to 95.08%, which is a remarkable improvement over the previous value for the network. The poor coverage was due to GPS antenna tracking problem of base station sites coupled with some sites with RSSI problems. However, after optimization, all these snags were cleared and the city has excellent Ec/Io coverage. Statistics in Figure 5 show that Rx Level above -90dbm was 99.21%, before optimization. However, after optimization, Rx Level above -90dbm came to 99.41%, which is an improvement as shown in Figure 6. Statistics in Figure 7 shows that TX level below 0 were
93.52%, before optimization. However, as shown in Figure 8, after optimization TX level below 0 came to 96.14%, which is a good improvement over the previous value.
5 CONCLUSION
The optimization process is a long term process that requires the study of the network situation and the provision of solutions to weak features sorted out first, without a hasty implementation, for a successful outcome. The antenna hardware changes (tilt and azimuth) are important issue in
the network optimization, as it is observed that most times the advised changes are not correct. The load on the system increases with time and thus affecting the network performance, hence the need to periodically monitor the carrier loads, and expand the network if necessary. Interference affects network capacity and the overall performance and quality of end user experience (call setup, call drop rate, etc) and these are considered key issues that need to be resolved. Network planning must be based on standard value to predict the demand services area and quality of service(QoS). It is important to know the network layout and QoS before implementing optimization procedure used as performance indicators to effect radio interface optimization.
REFERENCES
[1] Kathryn O.,(2008),“Introduction to Automatic Design of Wireless Networks”, Centre for Intelligent Network Design, Cardiff University, UK, 2008.
[2] Edward B., and Abu S.,(2009), “Effects of Antenna Height, Antenna Gain and Pattern Down tilting for Cellular Mobile Radio”, Proceedings of IEEE infocom,
2009.
[3] Nortel Network., (2001), “CDMA Technology Overview”, February 2001.
12
[4] Al-Hussaini E.k and A.M Al-Bassiouni,
''Performance of MRC diversity systems for the detection of signals with Nakagamifading,''IEEETrans.commun., VolCOM-37,no.1,pp.79-83,Jan 2005.
[5] Chang J., ''SER Analysis of QAM
with Space Diversity in Rayleigh Fading
Channels', ETRIJournal,Volume17,2006 [6] Kohno R., ''Spatial and temporal
communication theory using software antennas for wireless communications,''
2007,in Proc.PIMRC2007,Helsinki, Finland,pp,293-321
[7]. Venugopal V., and Andrew S.,(2009),
''The Coverage-Capacity Tradeoff in
Cellular CDMA Systems”, IEEE Tran.
2009 .
[8]. Dongmei Z., Xuemin S., and Jon M., (2006), “QoS Guarantee and Power Distribution for Soft Handoff Connections in Cellular CDMA Downlinks”, IEEE Transactions on Wireless Communications, Vol. 5, No.
4, April 2006.
[9]. Hafeth H., (2005),''An overview of Adaptive Antenna Systems'', Helsinki University of Technology communication Lab,
[10] Joseph S., (2004), “Enhancement and Utilization CDMA2000 Networks”, CEWIT CDMA Workshop, Nov.2004
[11]. Viterbi A.J., (2008),“CDMA:
Principles of Spread Spectrum
Communication'',Reading, Wesley 2008 [12]. Tansu A., Xingzhe F., Tamer B., Murat A., and Jon T.W., (2004), “Power
Control for Multicell CDMA Wireless Networks: A Team Optimization Approach”, University of Illinois at Urbana-Champaign, 2004.
[13]. John P., and Asim Q.,(2004), “IS-95
CDMA Forward Link Optimization
Tool”, Air Touch Cellular, 2004
.