International Journal of Scientific & Engineering Research, Volume 4, Issue 12, December-2013 1755
ISSN 2229-5518
Parallel Peculiarities and Performance of
GROMACS Package on HPC Platforms
A.H. Poghosyan, H.V. Astsatryan, A.A. Shahinyan
Abstract—A series of benchmarks have been carried out to estimate the parallel performance of GROMACS package on the base of Bulgarian IBM BlueGene/P and fat-node HP cluster located in Szeged, Hungary. An optimal performance for the provided platforms has been found out using different complex systems (97K 100K, 625K and 2.5M atoms size) and parametric options. It is stated that in case of BlueGene/P, for relatively small systems the performance is better when using PP:PME=7:1 ratio, while for the large systems, it is recommended to manually adjust the PP:PME ratio in order to reach better performance. A formula providing the computational throughput depending on a number of cores is suggested. It is shown that the obtained data are in agreement with the suggested formula data.
Index Terms— Parallel Molecular Dynamics, HPC platforms, GROMACS benchmarking.
—————————— ——————————
1 INTRODUCTION
he molecular dynamics (MD) simulation is a suitable method to compute the equilibrium and transport features of a classical many body system [1-7]. To explore a wide
range of interesting phenomena it is required to study systems
65.536 cores [22], where the problems on load imbalance and1
parallel scalabilities were discussed.
The parallel scaling of GROMACS molecular dynamics
code has been studied by many authors [23-26]. Kutzner and
IJSER
with a large number of atoms in long trajectory intervals (from
nano to milliseconds), which is surely unfeasible without us-
ing correspondent HPC (High Performance Computing) re-
sources. A vast range of open source parallel MD codes have
been developed to meet these goals, such as NAMD [8],
GROMACS [9], CHARMM [10], DL_POLY [11] and AMBER
[12]. One of the key challenges of such MD codes is the effec-
tive utilization of the resources (CPUs, memory, network, I/O)
on target HPC platforms for a given scientific problem.
As developers note, due to a number of optimization algo-
rithms and efficiently written code, the GROMACS code is a
“fastest MD” code, aimed at the HPC simulation [13]. There- fore, the parallel implementation makes it possible to have a unique gain in the system size and simulation time, which leads to the significant progress in complex systems modeling
[14-18]. Recently, the comparison simulations between GROMACS and NAMD packages show [19] that the GROMACS is faster than NAMD probably due to united atom character, however the package receives saturation and reach- es worst results with the increase of number of cores. Vice verse, NAMD shows linear increase with increase of number of cores.
Before the parallel scaling of NAMD package has been in- vestigated to evaluate the interconnection (Myrinet, Infini- band, Gigabit Ethernet and BlueGene/P torus) sensitivity on speedup [20]. As it was expected, the benchmarking results show, that the Gigabit Ethernet equipped systems undergo breakdown in scaling when interconnection is activated, meanwhile the systems using Myrinet, Infiniband and Blue- Gene/P network show almost ideally results regardless of system size.
The scaling of NAMD was carried out also on Blue Gene/L
with up to 8000 processors [21] and on BlueGene/P with up to
coworkers have tested GROMACS package on Ethernet
switched clusters and they find the breakdown in scaling,
when more than two nodes were involved and have compared
the benchmarks with Myrinet interconnection [23]. The expen-
sive simulations have been carried out in [24] using different
platforms, where the authors vary runtime conditions and
program module options in order to achieve the optimal set of
parameters for a given platform. Note that the petascaling
molecular dynamics simulation tests were done on AMD Op-
teron system Povel, CRAY XE6 and BlueGene-type resources
using up to 16384 cores. The different system sizes (from 70K
to 1.2M atoms) were analyzed on three different HPC plat- forms using GROMACS package [25]. About 6000 benchmark simulation tests show that the best performance was achieved by GROMACS automatic guess, where 25% of the total num-
ber of cores to PME cores, i.e. particle-particle:PME=3:1 ratio, however double precision calculations lowered the perfor- mance by 30–50%. Loeffler and Winn [26] provided the benchmarks data comparison of AMBER, Gromacs and NAMD packages running on different platforms (Blue- Gene/P, HP Cluster Platform 4000, HPCx and HECToR), where the total number of atoms reached up to 465 000.
In this study, a parallel performance of GROMACS code on two different HPC platforms is reported. The purpose of this work was to evaluate and compare the data depending on system sizes, as well as by varying some programs module and network parameters. The studied testing systems are reaching up to 2.5milion atoms.
————————————————
• Corresponding author: A. H. Poghosyan, Bioinformatics Group at Internation- al Scientific-Educational Center of NAS RA, Armenia.
E-mail: sicnas@sci.am
IJSER © 2013 http://www.ijser.org
International Journal of Scientific & Engineering Research, Volume 4, Issue 12, December-2013 1756
ISSN 2229-5518
2 HPC PLATFORMS AND TESTING DATA
For this investigation, the powerful computer architectures presently available in the South East Europe region are used. The current HPC infrastructure in the region is heterogeneous, comprising of BlueGene supercomputers, Intel/AMD clusters and enhanced with GPU computing accerators. A brief over- view of the systems using in this study follows.
The Bulgarian IBM Blue Gene/P supercomputer, consisting of two racks, 2048 PowerPC 450 based compute nodes, 8192 pro- cessor cores and a total of 4 TB random access memory. Bul- garia’s Blue Gene/P is capable of running 27 trillion opera- tions a second (Rpeak 27 TFLOPS), making it one of the 250- fastest computers in the world in 2009. The nodes are attached by IBM proprietary interconnection type with low latency
(2.5 µs ) and high bandwidth (10Gbps). The Hungarian a fat-
node HP cluster based on blade technology CP4000BL and
consists of 2304 cores, as a one of the flagship of high perfor- mance computing resources in Hungary with 14 Tflops per- formance. It is content the latest AMD Opteron 6174 type pro- cessors with 12-core Magny-Cours (2.1GHz) with the QDR 4x
Infiniband internal high-performance communication. This unique supercomputer run it very effectively in the mixed parallel programming paradigms and each node is a powerful
48 cores SMP computer. In comparison with BlueGene/P IBM
mode with the GROMACS mdrun –ddorder parameter. In case of BlueGene/P the XYZT and TXYZ values have been used for the BG_MAPPING environment variable.
3.1 BlueGene/P results
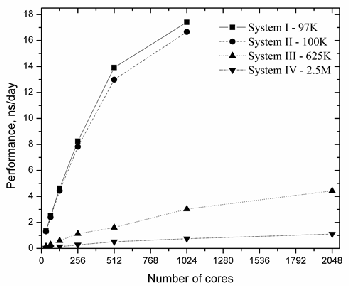
A series of short runs depending on number of processor cores Nc have been performed. Three or four runs for each case have been carried out for statistical analyzes. The performance for the studied systems with the -ddorder interleave and BG_MAPPING=TXYZ default parameters is shown in Fig. 1,
When the –ddorder switched to interleave, it means that the program distributes the PME nodes together with the particle- particle nodes, meanwhile in cartesian and pp_pme modes, the code separates the particle-particle and PME nodes [9].
network, the Infiniband network has a better low latency
(1.1 µs ) and high bandwidth (40Gbps).
The systems with 97K, 100K, 625K and huge 2.5M atoms
available on our official page2 have been used for the simula-
tions with the following parameters: 2fs timestep, the PME electrostatics, van der Waals forces truncated at 1.2nm with corresponding pressure and temperature control. The bench- mark runs were typically for 5000 steps without any writing
outputs. The studied complex systems are:
System I - 97183 atoms: Poly vinyl alcohol (PVA) polymer
consisting of 1024 monomers and 31029 water molecules
(~10x10x10nm3 cell size);
System II – 99656 atoms: PVA polymer consisting of 1024 monomers, 128 sodium pentadecyl sulfonate (SPDS) mol- ecules in water bulk consisting of 31000 water molecules (~10.3x10.3x10.3nm3 cell size);
System III – 624124 atoms: Randomly distributed 128
SPDS molecules in aqueous solution consisting of 207188
water molecules (~18x18x20nm3 cell size);
System IV – 2595136 atoms: Randomly distributed 128
SPDS molecules in aqueous solution consisting of 864192
water molecules (~36x36x20nm3 cell size).
The studied surfactants and polymers have been found al-
ready a wide range of applications in everyday life (deter-
gents, cosmetics, pharmaceuticals, food processing, agrochem-
icals, paints, paper coatings, etc).
3 SIMULATION RESULTS
For both platforms mentioned above, up to 2048 cores are used for the simulations by varying the particle-particle-PME
2 http://www.bioinformatics.am
Fig. 1. The GROMACS performance as a function of number of cores for
all cases. Note that for 97K and 100K, it was impossible to find decompo- sition when using 2048 cores.
To check the performance, we changed mdrun –dd and –npme options for 97K system with 32, 64, 128 and 256 cores and the results are given in Table 1. Indeed, the data for all cores show that the GROMACS guess for particle-particle:PME ratio is good, however a twice decrease of number of PME nodes leads to absence of performance lost and the best performance is reached with PP:PME=7:1 ratio.
It is known that the PP:PME ratio is determined automatically from the particle density and the PME grid dimensions. For all cases, with 7:1=PP:PME ratio we have received a significance increase of performance without any performance lost. On the other hand, it is shown that even a little decrease of PME nodes leads to decrease of performance lost and the progress in performance, i.e. for 64 cores, the automatic guess receives
2.510ns/day with 9.4% performance lost, whereas a little de- crease of PME nodes (14 cores instead of 16 cores) leads to increase of performance (2.560ns/day – 6.6% performance lost) with –dd 5 5 2 and –npme 14. To check this assumption,
IJSER © 2013 http://www.ijser.org
International Journal of Scientific & Engineering Research, Volume 4, Issue 12, December-2013 1757
ISSN 2229-5518
we have tried to test also System II-100K. Note that the differ- ence between System I and II is just the presence of 128 SPDS molecules (about 2400 atoms) in almost same volume box. The results for 7:1 and 3:1 (automatic guess) PP:PME ratios are given in Table 2.
TABLE 1.
THE PERFORMANCE OF A 97K SYSTEM W ITH DIFFERENT –DD AND –

NPME PARAMETERS
DUAL mode – two MPI processes per node and VN mode – four processes per node. It should be noted that for DUAL mode and VN mode, it is frequently better to use the default TXYZ mapping.
TABLE 2.
THE PERFORMANCE OF A 100K SYSTEM W ITH DIFFERENT –DD AND –
NPME PARAMETER
Cores -dd option -npme Performance, ns/day
Performance lost, %
| 7x2x2=28 | 4 | 1.444 | - |
32 | (auto) 4x2x3=24 | (auto) 8 | 1.312 | 9.2 |
| 7x4x2=56 | 8 | 2.638 | - |
64 | (auto) 4x4x3=48 | (auto) 16 | 2.394 | 9.2 |
| 8x7x2=112 | 16 | 4.792 | - |
128 | (auto) 8x4x3=96 | (auto) 32 | 4.432 | 8.7 |
| 8x7x4=224 | 32 | 8.203 | - |
256 | (auto) 8x8x3=192 | (auto) 64 | 7.828 | 8 |
8x8x7=448 64 14.780 -
IJSER
512
(auto)
8x8x7=384
(auto)
128 12.983 6.7
In fact, in case of parallelization, the system box is spitted into small cells and when the PME electrostatics is available, the GROMACS automatically assigns a certain amount of nodes for PME. It should be noted, that the user may manually set the PME nodes by -npme option (should not be more than the half of the nodes), however the automatic choice of GROMACS is pretty correct for all unit cell types (usually, for triclinic unit cells – 3:1 particle-particle/PME ratio, for dodec- ahedral or octahedral unit cells - 2:1 particle-particle/PME). Thus, the choice of particle-particle/PME ratio, also the set of mdrun options are rather important to reduce load imbalance and get a better performance. The load imbalance mainly oc- curs due to the inhomogeneous particle distribution. On the other hand, we have changed the network parameter, which describes the location of process within the 3D mesh or torus network using four coordinates <X,Y,Z,T>, where T represents the core number. This parameter is specified by the setting the environment variable BG_MAPPING, the default value of lat- ter is BG_MAPPING=TXYZ assigning the processors MPI tasks to TXYZ. BlueGene/P systems provide four modes to use nodes - Symmetric Multiprocessor Mode (SMP), Dual Node Mode (DUAL) and Virtual Node Mode (VN). The SMP node each physical node executes a single process per node,
To check the performance, we changed mdrun –dd and – npme options for 97K system with 32, 64, 128 and 256 cores and the results are given in Table 1. Indeed, the data for all cores show that the GROMACS guess for particle- particle:PME ratio is good, however a twice decrease of num- ber of PME nodes leads to absence of performance lost and the best performance is reached with PP:PME=7:1 ratio.
It is known that the PP:PME ratio is determined automati- cally from the particle density and the PME grid dimensions. For all cases, with 7:1=PP:PME ratio we have received a signif- icance increase of performance without any performance lost. On the other hand, it is shown that even a little decrease of PME nodes leads to decrease of performance lost and the pro- gress in performance, i.e. for 64 cores, the automatic guess receives 2.510ns/day with 9.4% performance lost, whereas a little decrease of PME nodes (14 cores instead of 16 cores) leads to increase of performance (2.560ns/day – 6.6% perfor- mance lost) with –dd 5 5 2 and –npme 14. To check this as- sumption, we have tried to test also System II-100K. Note that the difference between System I and II is just the presence of
128 SPDS molecules (about 2400 atoms) in almost same vol- ume box. The results for 7:1 and 3:1 (automatic guess) PP:PME ratios are given in Table 2.
The obtained data indicate that even for 100K, the
7:1=PP:PME ratio is still excellent and the twice decrease of
PME nodes means that we have no performance lost with
highest value of performance. However, the further increase
of system sizes shows the 7:1=PP:PME ratio receives worst
results, i.e. we see the increase of performance lost and corre-
spondingly the decrease of performance. As it is shown in Fig.
IJSER © 2013 http://www.ijser.org
International Journal of Scientific & Engineering Research, Volume 4, Issue 12, December-2013 1758
ISSN 2229-5518
1, in case of System III - 625K the automatic guess for 128 cores is about 0.589ns/day (96 PP and 32 PME nodes). When we change 3:1 to 7:1 ratio, we have received 0.453ns/day with
31.7% performance lost, meanwhile a little decrease of PME nodes (28 PME nodes instead of 32) lead to the absence of per- formance lost (0.582ns/day).
Hence, we can argue that in case of relatively small sys- tems, the highest possible performance is not reached by the automatic choice of GROMACS and if we consider inhomo- geneous systems it is better to manipulate –dd and –npme op- tions in order to get suitable domain decomposition. Particu- larly, the 7:1=PP:PME ratio choice is better than the automatic guess (3:1=PP:PME) for the systems with up to 100K atoms.
performance lost.
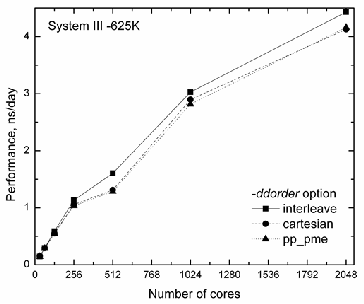
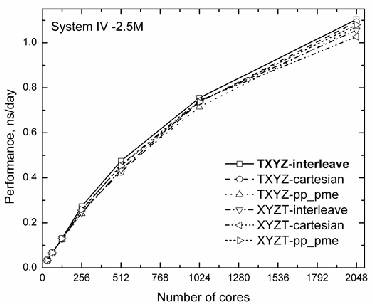
Fig. 3. Performance for System IV – 2.5M changing mdrun –ddorder and BG_MAPPING options.
To estimate and extrapolate the above mentioned bench- mark data, we use the formula, which provides the computa- tional throughput depending on the number of processors [20]. According to [20 ], the estimation can be formulated as:
Fig. 2. Performance for System III – 625K with three values of mdrun –
E = Estimated days = α
N + β
P
(1)
ddorder scheme.
where α and β are coefficients describing the physical na-
ture of cluster (processor type, frequency, etc.) and the net- work (bandwidth, latency) correspondingly, the N is a
The next testing was the variation of mdrun –ddorder option
number of atoms, and the
N P is a number of processors. The
and in Fig. 2, the performance for 625K system is shown. One can see that the difference between the data is small, however, the default mapping with mdrun –ddorder interleave scheme gives the best performance starting at 512 cores.
For a huge system, which contains about 2.5 milion atoms (System IV), besides of GROMACS three decomposition modes, we have also played with the environment variable BG_MAPPING setting up TXYZ and XYZT. The correspond- ing performance data is monitored in Fig. 3. The obtained data show that starting from 256 cores, the highest performance was reached with the default mode – BG_MAPPING=TXYZ and –ddorder interleave. Sure, for other sets we see only slightly shift with compared to the default value starting from 256 cores.
Thus, we conclude that the good performance is obtained when the default set of network parameters are applied, how- ever, for the highest performance, it is strongly recommended to optimize particle-particle and PME nodes so as to avoid any
network coefficient β depends on many factors, like network bandwidth, latency time, etc., whereas the α coefficient can
be interpret as processor frequency. The testing and formula estimated data are shown in Table 3.
As one can see that for huge systems, the testing data are in somewhat agreement with formula data, however, for rela- tively small systems, the formula does not fit well the behavior of changing. In our opinion, the reason is the type of resource, i.e. as we are dealing with the supercomputer with specific network. Note that in case of NAMD package benchmarking [20], a poor agreement with formula data was also achieved, meanwhile when we use a cluster with Gigabit Ethernet or Infiniband network, the good agreement is received.
IJSER © 2013 http://www.ijser.org
International Journal of Scientific & Engineering Research, Volume 4, Issue 12, December-2013 1759
ISSN 2229-5518
TABLE 3.
ANALYZES OF TESTING AND FORMULA DATA DEPENDS ON A SYSTEM SIZE.
Cores | 100K atoms | 625K atoms | 2.5M atoms |
Cores | Test | formula | Test | formula | test | formula |
32 | 1.312 | 0.3199 | 0.146 | 0.0510 | 0.034 | 0.0261 |
64 | 2.394 | 0.6398 | 0.295 | 0.1021 | 0.067 | 0.0523 |
128 | 4.432 | 1.2797 | 0.589 | 0.2043 | 0.132 | 0.1047 |
256 | 7.828 | 2.5594 | 1.132 | 0.4086 | 0.273 | 0.2094 |
512 | 12.983 | 5.1188 | 1.606 | 0.8173 | 0.515 | 0.4189 |
1024 | 16.665 | 10.2377 | 3.027 | 1.6347 | 0.755 | 0.8378 |
2048 | - | 20.4754 | 4.43 | 3.2695 | 1.104 | 1.6756 |
Therefore, to obtain better coincidence, it is recommended to adjust α and β coefficients. Particularly, the network characterized parameter β , which is roughly set to zero, is
estimated to be as follow:
f (χ , λ, N p , N ),...N p < Nc
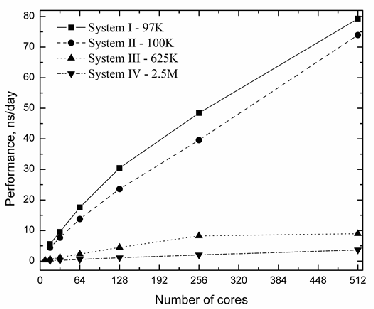
Fig. 4. The GROMACS performance as a function of number of cores for all cases.
β (network ) =
{0 ÷1},...N p > Nc
(2)
TABLE 4.
COMPARATIVE PERFORMANCE DATA FOR ALL SYSTEMS.
IJSER

where N c
is a so called critical (or optimal) number of pro-
Cores 97K 100K 625K 2.5M
cessors, which depends on system size and network type. The
BG/P HP BG/P HP BG/P HP BG/P HP
complex function
f (χ , λ, N p , N ) depends on many factors,
16 0.715 4.657 0.703 4.403 0.076 0.623 0.017 0.149
like network bandwidth, latency time, etc, however the in- creasing processors ( N p > N c ) shows that the network pa- rameter displays as just a correction β → 0 , which is true
only for clusters with regular network and it is better to adjust the network function [20] for BlueGene/P.
3.2 HP-cluster results
Using the default set of parameters, the performances for all sets are given in Fig. 4. As clearly seen from Fig. 4, HP- cluster performance is much better than the BlueGene/P. The values for all cores and systems size have been collected into one table for analyzes (see Table 4.). The comparison of benchmarking data (default parametric set) for the various platforms show that the Szeged HP cluster is normally 5-10
32 1.342 9.492 1.312 7.65 0.146 1.209 0.034 0.292
64 2.510 17.545 2.394 13.766 0.295 2.299 0.067 0.564
128 4.626 30.435 4.432 23.568 0.589 4.492 0.132 1.1
256 8.248 48.426 7.828 33.988 1.132 8.233 0.273 2.035
512 13.916 69.922 12.983 43.586 1.606 8.248 0.515 3.655
1024 17.400 - 16.665 - 3.027 - 0.745 -
2048 - - - - 4.430 - 1.104 -
To estimate the role of interconnection between nodes, we have carried out some additional tests, where the incremental unit of processors was 48xN , as Szeged each node is a pow- erful 48 cores SMP computer. The obtained data were com-
pared with the benchmark data where the increasing unit was 2n , n = 4,5,6,7,8,9 . In Fig. 6, for System II-100K, the
comparison data were shown. The plots show that it is better
times faster that the BlueGene/P supercomputing resource for
the equal number of processor cores.
to choose an increment 48xN
differences in the data.
instead of 2n , as we see large
The above mentioned technical data for both platforms in-
dicate that the latter has more powerful latest processor with high frequency, moreover, the network parameters (latency and bandwidth) also argues that the Szeged resource is faster than the BlueGene/P. As in case of BlueGene/P, here, we also
vary the mdrun –ddorder option accordingly to interleave, carte- sian and pp_pme. The performance data for 100K system are shown in Fig. 5. As we see from the figure, the same assump- tion is true, and for HP cluster, the differences between the data is small, meanwhile, we can argue that the default map- ping with mdrun –ddorder interleave scheme gives the best per- formance starting at 64 cores.
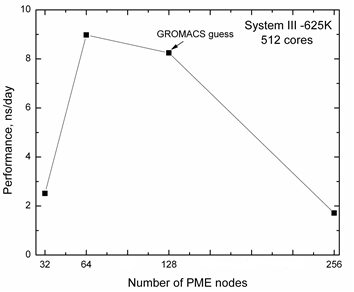
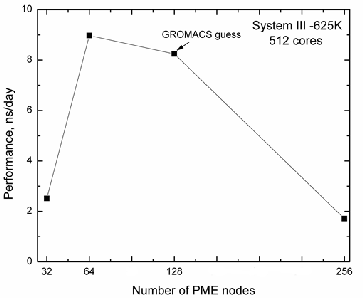
Further, we have tested also the PP:PME ratio and for Sys- tem III-625K and some tests are shown in Fig. 7, where the performances depending on number of PME nodes are moni- tored. As we can see the GROMACS automatic guess is rather good, however, a little decrease of number of PME nodes leads to a small shift.
Thus, we can argue that for mentioned platform the GROMACS automatic guess for PP:PME nodes is good than suggested PP:PME=7:1 ratio, even for relatively small data. The analysis of benchmark data for System II- 100K by varying mdrun –dd and –npme option (4, 8, 14 and 16-auto PME nodes) shows that the decrease of PME nodes brings to the bad per-
IJSER © 2013 http://www.ijser.org
International Journal of Scientific & Engineering Research, Volume 4, Issue 12, December-2013 1760
ISSN 2229-5518
formance and as a result we have low speedup with up to 40% of performance lost (for instance, 100K system, 64 cores at – npme 8, the performance was 5.664ns/day with 39.6% perfor- mance lost).
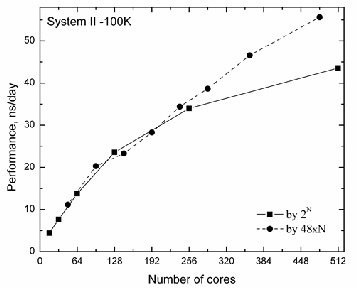
Fig. 5. Performance for System II – 100K with three values of mdrun –
ddorder scheme.
The extrapolation by suggested formula for HP-cluster is in
4 CONCLUSIONS
More than 200 simulations have been performed to check the performance of GROMACS package on the HPC platforms.
For BlueGene/P supercomputer, it is stated that in case of rel- atively small systems, the highest possible performance is not reached by the automatic choice of GROMACS and if we con- sider inhomogeneous systems it is better manually to set –dd and –npme options in order to get suitable domain decomposi- tion. Particularly, the 7:1=PP:PME ratio choice is better than the automatic guess (3:1=PP:PME) for the systems with up to
100K atoms. The obtained data show that starting from 256 cores, the highest performance was reached with the default mode – BG_MAPPING=TXYZ and –ddorder interleave.It is es- tablished, that for relatively small systems, the suggested for- mula [20] does not fit well the behavior of changing.
ER
progress and will be provided soon.
Fig. 7. Performance for System III – 625K with different number of
PME nodes. The total number of cores is 512.
Fig. 6. Performance for System II – 100K with different increment units
- 2 and 48xN , where N = 1...10 .
The comparative benchmarking data with default set show that the Szeged HP cluster is normally 5-10 times faster that the BlueGene/P resource per processor core. The latter is conditioned by the latest processor type and network feature (low latency and high bandwidth). The testing on Szeged HP Resources shows that the default mapping with mdrun – ddorder interleave scheme gives the best performance starting at
64 cores. Another feature of Szeged HP system is that the pro- cessor incremental unit 48xN , shows better results than 2 n ,
which is due to node feature (each node has 48 cores). We also conclude that the decrease of PME nodes brings to the bad performance and in case of HP-cluster it is better to use the automatic choice (PP:PME=3:1) of GROMACS software pack- age.
It is planned to continue simulations using Graphical Pro- cessor Units and to develop multifunctional portals [27] that will provide easy interfaces to end users.
IJSER © 2013 http://www.ijser.org
International Journal of Scientific & Engineering Research, Volume 4, Issue 12, December-2013 1761
ISSN 2229-5518
ACKNOWLEDGMENT
This work was supported in part by the European Commis- sion under EU FP7 project HP-SEE (N261499).
REFERENCES
[1] M. Tuckerman and G. Martyna, “Understanding modern molecular dynam- ics methods: Techniques and Applications“. J. Phys. Chem. vol. 104, pp. 159-
178, 2000.
[2] Rapaport D. The Art of Molecular Dynamics Simulation. Cambridge Univer- sity Press, 2004, pp. 549.
[3] M. Allen and D. Tildesley, Computer simulation of liquids. Oxford University
Press, 1989.
[4] T. Schlick, Molecular Modeling and Simulation. p. 634, Springer 2002.
[5] B. Alder and T. Wainwright, “Studies in Molecular Dynamics. I. General
Method.” J. Chem. Phys. vol. 31, no. 2, pp. 459-466, 1959.
[6] J. Haile, Molecular Dynamics Simulation: Elementary Methods. Wiley, pp.489,
1997,
[7] K. Kholmurodov, Molecular Simulation Studies in Materials and Biological Scienc- es, (Joint Institute for Nuclear Research – Dubna, Russia), Nova Publishers,
2007.
[8] L. Kale, R. Skeel, M. Bhandarkar, R. Brunner, A. Gursoy, N. Krawetz, J. Phil-
tems”. Langmuir. vol. 29, no 1, pp. :29-37, 2013.
[18] A. Poghosyan, H. Gharabekyan and A. Shahinyan, “Molecular Dynamics Simulation of DMPC/DPPC mixed bilayers”. International Journal of Modern Physics C (IJMP C), vol 18, no 1, pp. 73-89, 2007.
[19] A. Poghosyan, G. Yeghiazaryan, H. Gharabekyan and A. Shahinyan, “The GROMACS and NAMD software packages comparison.” Communications in Computational Physics (CiCP). vol. 1, pp. 736-743, 2006.
[20] A. Poghosyan, L. Arsenyan, H. Astsatryan, M. Gyurjyan, H. Keropyan and A.
Shahinyan, “NAMD Package Benchmarking on the Base of Armenian Grid
Infrastructure”, Communications and Network. vol. 4, pp. 34-40, 2012.
[21] S. Kumar, C. Huang, G. Almasi and L. Kale, Achieving Strong Scaling with NAMD on Blue Gene/L, ipdps. Proceedings of the IEEE International Parallel and Distributed Processing Symposium, Rhodes Island, p. 41, 25-29 April 2006.
[22] G. Zheng, A. Bhatele, E. Meneses and L. Kale, “Periodic hierarchical load balancing for large supercomputers”, International Journal of High Performance Computing Applications, vol. 25, no. 4, pp. 371-385, November 2011.
[23] C. Kutzner, D. Van Der Spoel, M. Fechner, E. Lindahl, U. Schmitt, B. L. De Groot, H. Grubmuller, “Speeding up Parallel GROMACS on High-Latency Networks”. Journal of Computational Chemistry, vol. 28, no. 12, pp. 2075-2084,
2007.
[24] F. Affinito, A. Emerson, L. Litov, P. Petkov, R. Apostolov, L. Axner, B. Hess, E.
Lindahl and M. Iozzi, “Performance Analysis and Petascaling Enabling of
GROMACS”. PRACE white paper, pp. 1-12, 2012
[25] C. Christian and P. Jorgen, “Systematic benchmarking of large molecular dynamics simulations employing GROMACS on massive multiprocessing
IJSER
lips, A. Shinozaki, K. Varadarajan and K. Schulten, “NAMD2: Greater Scala-
bility for Parallel Molecular Dynamics”. Journal of Computational Physics, vol.
151, no. 1, pp. 283-312, 1999.
[9] D. van der Spoel van, A. Buuren, E. Apol, P. Meulenhoff, D. Tieleman, A.
Sijbers, B. Hess, K. Feenstra, E. Lindahl, R. van Drunen and H. Berendsen,
Gromacs User Manual Version 3.1.1. Nijenborgh 4, Groningen, 2002.
[10] B. Brooks, R. Bruccoleri, B. Olafson, D. States, S. Swaminathan and M. Karplus “CHARMM: A Program for Macromolecular Energy, Minimization, and Dynamics Calculations”. Journal of Computational Chemistry, vol. 4, no. 2, pp.
187-217, 1983.
[11] W. Smith and I. Todorov, “A short description of DL POLY”, J. Mol. Sim. vol.
32 no. 12, pp. 935-943, 2006
[12] D. Pearlman, D. Case, J. Caldwell, W. Ross, T. Cheatham, S. DeBolt, D. Fergu- son, G. Seibel and P. Kollman, “AMBER, a Computer Program for Applying Molecular Mechanics, Normal Mode Analysis, Molecular Dynamics and Free Energy Calculations to Elucidate the Structures and Energies of Molecules”. Computer Physics Communications, vol. 91, no. 1-3, pp. 1-41., 1995
[13] E. Lindahl, B. Hess and D. van der Spoel, “GROMACS 3.0: a package for molecular simulation and trajectory analysis”. Journal of Molecular Modeling, vol. 7, no. 8. pp. 306-317, 17 August 2001.
[14] A. Poghosyan, L. Arsenyan, H. Gharabekyan, S. Falkenhagen, J. Koetz and A.
Shahinyan, “Molecular dynamics simulations of inverse sodium dodecyl sul- fate (SDS) micelles in a mixed toluene/pentanol solvent in the absence and presence of poly(diallyldimethylammonium chloride) (PDADMAC)”. Journal of Colloid and Interface Science, vol. 358, pp. 175-181, 2011.
[15] A. Poghosyan, G. Yeghiazaryan, H. Gharabekyan, J. Koetz and A. Shahinyan,
“A molecular dynamics study of Na–dodecylsulfate/water liquid crystalline phase.” Molecular Simulation, vol 33, no. 14, pp. :1155–1163, 2007.
[16] A. Poghosyan, L. Arsenyan, H. Gharabekyan, J. Koetz and A. Shahinyan, “Molecular dynamics study of poly diallyldimethylammonium chloride (PDADMAC)/sodium dodecyl sulfate (SDS)/decanol/water system”. The Journal of Physical Chemistry B. vol 113, no. 5, pp. 1303-1310, 2009.
[17] A. Poghosyan, L. Arsenyan and A. Shahinyan, “Molecular Dynamics Study
of Intermediate Phase of Long Chain Alkyl Sulfonate/Water Sys-
facilities”, Journal of Computational Chemistry, vol. 32, no. 4, pp. 600-606, 2011.
[26] H. Loeffler and M. Winn, Large biomolecular simulation on HPC Platforms I.
Experiences with AMBER, Gromacs and NAMS, Tech. Rep. DL-TR-2009-002, STFC Daresbury Laboratory, Warrington WA4 4AD UK, 2009
[27] H. Astsatryan, V. Sahakyan, Yu. Shoukouryan, M. Dayde, A. Hurault, R.
Guivarch, A. Terzyan and L. Hovhannisyan, “On the Easy Use of Scientific Computing Services Enabling Large-Scale Linear Systems of Equations and Algorithms based on Integrated P-Grade Portlal”, Springer Journal of Grid Computing, vol. 11, no. 2, pp. 239-248, 2013.
IJSER © 2013 http://www.ijser.org