International Journal of Scientific & Engineering Research, Volume 5, Issue 7, July-2014 601
ISSN 2229-5518
PREDICTIVE MODELING OF THE EFFECTS OF RESERVOIR PROPERTIES ON THE
EFFECTIVE APPLICATION OF MICROBIAL
ENHANCED OIL RECOVERY (MEOR)
Godwin C.J. Nmegbu, Lotanna V. Ohazuruike
—————————— ——————————
Microbial activity has been known as a potential means of en- hancing the yield of trapped oil [1], [2], [3]. Microbially En- hanced oil recovery (MEOR) can be defined as a microbiologi- cal method for the improvement of oil recovery from under- ground reservoir. Primarily, the term refers to procedures which include water diversion and downhole polymer and surfactant loss which are based on products produced directly in the reservoir matrix by living microorganisms especially the bacteria [4], [5]. This technology finds its role mainly in selec- tive plugging in the control of waterflood, polymer and sur- factant floods, the stability of microbial products for oilfield use and heavy oil recovery [6].
The growth of microbes in-situ in the reservoir has a number of important interactions with the inorganic materials and the oil present in the formation. These microbes will produce bio- genic gases which will mix with the oil and dissolve in the heavy crude and act as a mobilizing agent [7]. These fermenta- tion and metabolic processes produce other useful products like polymer and surfactants downhole that aid further petro- leum recovery. These result in modifications of the rock and fluid properties necessary for production, and may include permeability modification, viscosity reduction and provision of favourable mobility control.
MEOR is not a single technology based on a common ap- proach but an adaptation of microbial systems to specific problems of oil recovery from a chosen target reservoir. Con- sequently, understanding the target reservoir, microbial and operating conditions are vital for effective application of the technology to obtain an optimum recovery [2], [8].
The use of microbes introduces reaction engineering into reservoir engineering, with associated concepts including bio- reactor volume, nutrient reaction kinetics and selectivity, and minimum required level of conversion. These concepts permit quantitative relationships to be established between reservoir
characteristics, operating conditions and microbial perfor- mance as will be developed in this work. These quantitative relationships between microbial performance, reservoir/fluid characteristics (permeability, porosity, thickness, viscosity etc.) and operating conditions (well spacing, injection rates, residu- al oil saturation) can be developed from the adoption of a res- ervoir engineering perspective focusing on issues such as scale up of laboratory results, process design and field implementa- tion and operation [9]. Analysis with plausible values of reser- voir and microbial parameters indicates, from literatures, that a MEOR process using the in-situ carbon must overcome se- vere performance constraints [2], [7], [10]. Use of an ex-situ carbon source avoids these technical/performance constraints but eliminates the logistical and cost advantages of an in-situ source.
The selected, cultured, naturally occurring species (mi- crobes) produce several compounds that have the potential for enhanced oil recovery. These microbial degradation by- products include solvents, gases, alcohols, acids, biosurfac- tants and biopolymers [11], [12], [13]. The in-situ produced gases may increase reservoir pressure and decrease the viscos- ity and gravity of the crude oil, allowing it to move more freely to the producing wells. The gases, solvents and weak acids cause a reduction in the viscosity and the pour point of the crude and an increase in its API (or specific) gravity. Mi- crobial plugging due to biomass activity is also reported [1], [3], [6], [10].
It is also important to point out that some of the microor- ganisms inhibit the activity of SRB (Sulphate-reducing bacte- ria) which also occur naturally in reservoirs and are often re- sponsible for the production of corrosive hydrogen sulphide gas. The surfactants, acids and solvents clean out paraffin, wax and the heavy crude depositions in the pores of the rock im- proving the permeability and partially restoring the rock’s original porosity [4], [5]. These solvents are also responsible
IJSER © 2014 http://www.ijser.org
International Journal of Scientific & Engineering Research, Volume 5, Issue 7, July-2014 602
ISSN 2229-5518
for the reduction in Interfacial tension (IFT) and wettability alteration. An illustration of the above effects is given in the![]()
τrxn = −
1
ln �1 −
![]()
Creq
VNNo
� (2)
table below.
TABLE 1.
CHANGES IN OIL PROPERTIES DUE TO MICROBIAL EOR [2], 3]
For effective interaction with the interstitial oil, the microbes
should be able to exhibit stability or steady-state conditions. Also, reaction engineering considerations suggest that the conversion efficiency of the respective medium is the maxi- mum concentration, Cmax (in mass fraction) of the recovery –
enhancing chemical that can be produced within the bioreac- tor, given by:![]()
![]()
C = V Sor ρo
max H 1−Sor ρw
(3)
*Solvents include gasoline, kerosene and diesels
Since the maximum volume of recovery-enhancing chemi-
cal (the maximum slug volume, Vmax) should be the same as
the reactor volume, then, for ‘n’ number of injectors:
Vmax = nπτ2 hφ(1 − Sor
) (4)
The following analysis introduces the concepts of reaction en- gineering considerations into the reservoir engineering analy- sis.
Two basic time models for microbial systems are residence
Equation (4) models the maximum slug volume of the re-
covery-enhancing chemical that can be produced within the
bioreactor
Assuming a 100% conversion process and expressing Vmax
as a fraction of the reservoir pore volume yields:![]()
![]()
ρo πrm or H
time τres, the amount of time species spends within the reac-
fslug =
2 S V
AC
(5)
w req
tor, and the characteristic reaction time, τrxn, the amount of
time required for the concentration of a reaction product to
reach a desired level [14], [15]. In the MEOR process, the resi-
dence time depends on operating conditions – well spacing, injection rates, residual oil saturations and the reaction time depends on the behaviour of the microbial system (i.e., micro- bial conditions) – concentration of species, pore fraction of the
retained species, conversion efficiency of species etc.
If we assume that the retention (or residence) time is a func-
tion of the injection rate and that the bioreactor is of a contin-
uous-flow type, then the retention time is expressed as:
φπr2 h(1−S )
where fslug is the slug size in reservoir pore volume (PV)
and A is the injection-well spacing.
Equations (3), (4) and (5) are the in-situ carbon source con-
version models.
Nutrient supply to in-situ reactors of microbial systems are through the injection water. Consider the finite aqueous solu- bility of nutrients which will lead to the concept of limiting reactant – the first species to be used up as fluids move through the bioreactor. Consider that the assumed kinetics of the microbial system depend only on concentrations in the![]()
τres =
where,
Q (1)
flowing phase, and no dispersion, the extent of reaction at a
given position will depend only on the time required for the
fluid to move from the reactor inlet (the wellbore) to that posi-
τ res = residence time, day
φ = porosity, volume fraction
tion. Hence, the maximum extent of reaction will be reached
when the fluid arrives at the radial location, rlim, is given as:
rm = radial extent of bioreactor, ft h = thickness of formation, ft
rlim = �−
Q
![]()
K1 πhφ(1−Sor )
ln �1 −
Mo,max
VNNo
![]()
1/2
��
(6)
Sor = residual oil saturation, volume fraction
Q = injection rate, bbl/day/injector
The reaction time, τrxn depends on the microbial conditions.
Assuming that the concentration of the produced bioproduct
C, is proportional to the change in concentration of injected
If N is the rate-controlling nutrient, a similar analysis can be
considered when other reactants are present in excess while
the concentration of N depends on the radial position, r. In
this case, the amount of nutrient at a given radial distance
from the bioreactor inlet (wellbore) becomes:
K1πφh(1−Sor ) 2
![]()
nutrients and that at the reaction time, the concentration of the
Nt = Noexp �−
r � (7)
Q
produced bioproduct is the required concentration, Creq , for
efficient recovery, then:
————————————————
(This information is optional; change it according to your need.)
Equation (7) is the model for nutrient supply to in-situ reac- tors.
Viscosity reduction through in-situ gas production enhanc- es miscible displacement of the target oil [7], [16]. Major bio- genic gases of interest are CO2 and CH4 and nutrient supply is essential for their production.
Practical in-situ generation of CO2 requires an alternative external source like a carbohydrate or an alternative microbial
mechanism that abstracts Oxygen from water molecules. In-
IJSER © 2014 http://www.ijser.org
International Journal of Scientific & Engineering Research, Volume 5, Issue 7, July-2014 603
ISSN 2229-5518
situ generation of Methane requires no external source materi- al, unlike CO2 production. Since one kilogram of crude oil contains approximately 0.17kg H (hydrogen atom), and if we assume that microbes were able to use that hydrogen com- pletely, then 4H (from CH4 ) would consume 0.68 Kg of Hy- drogen. Considering this limiting conversion efficiency, we can develop a relationship that establishes a maximum slug size in a manner similar to that obtained for other recovery- enhancing chemicals to give:
0.68πτ2 S ρ
due to the MEOR process is proportional to the plugging vol- ume in the pore space by cell bodies.
The recovery is calculated by assuming that,
(∆So)MEOR = (SOR)EOR − (SOR)MEOR (20)
However, for the purpose of this work, recovery is calculated
based on the relationship proposed below:
Recovery = (∆So)MEOR = σ(SOR)EOR (21)
fgas =
![]()
A ρg
![]()
(8)
The C++ program source code is the chosen simulation pro-
If we consider the analysis of another in-situ gas, other than
CH4 production, assuming that the gas production is propor- tional to the nutrient consumption, we have:
gram. The simulator is used to test the sensitivity of MEOR
performance and development strategy to variations in reser-
voir properties within a range of possible values. The reservoir
K1 πφh(1−Sor) 2
![]()
Gp = VN No �1 − exp �−
r �� (9)
Q
and microbial system characteristics employed are given in the
table below.
From (7), making the porosity φ, the subject of the formula,
TABLE 2
RESERVOIR AND MICROBIAL SYSTEM CHARACTERIS-
![]()
φ = Q K1 πr2h(1−Sor)
![]()
ln �No � (10)
Nt
TICS
For porosity reduction due to pore plugging, we write:
φi = φo(1 − σ) (11)
Where φ0 is the initial porosity, φi is the instantaneous porosi-
ty and σ (= 1 - Sor ) is the pore fraction occupied by the sessile
phase.
Substituting (10) for φ0 in (11):
Q 1 No
![]()
![]()
φi = K πr2h �σ − 1� ln � N � (12)
1 t
From the fines migration theory of Civan et al [17]], the rate of change in permeability due to selective plugging by microor- ganisms as:
3
![]()
![]()
Ki = � φi �
(13)
Ko φo
Substituting (12) in (13) results in:![]()
1
3
Ki = Ko ��
![]()
K1πr2hφ
![]()
Q ln No �
Nt
− 1�
![]()
K1πr2hφ�
![]()
Q ln No �
Nt
(14)
Assume the deposited biomass (sessile phase) occupies a por- tion of the pore space during the MEOR process. The satura- tion balance equation can be written as:
So + Sw + Sg + σ = 1 (15)
MEOR depends on the production of metabolites, hence, its
recovery can be expressed as:
(∆So)MEOR = (∆So)plugging + (∆So)gas + (∆S0 )surfactant + (∆So)polymer (16)
where ∆So is the respective incremental oil recovery.
Since the surfactant and polymer enhance the plugging and
repressurisation process of MEOR, (16) can be simplified thus:
(∆So)MEOR = (∆So)plugging + (∆So)gas = f(σ, Cg) (17)
where σ is the pore volume fraction of the retained cell bodies
and C g is the gas concentration. But where microbial plugging
is considered to be dominant in the MEOR process, (17) can be
written as:
(∆So)MEOR = f(σ) (18)
If a linear relationship is assumed, it becomes
(∆So)MEOR = λσ (19)
where λ is a constant.
It is evident from the equation that the additional oil recovery
IJSER © 2014 http://www.ijser.org
International Journal of Scientific & Engineering Research, Volume 5, Issue 7, July-2014 604
ISSN 2229-5518
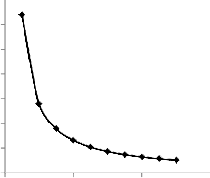
the injected nutrients. Higher concentration of nutrients will require lower reaction time. On the other hand, lower concen- tration of nutrients will take higher reaction time. This is illus- trated in the table and figure below.
TABLE 4
VARIATION OF REACTION TIME WITH CONCENTRATION
The results of the simulation and sensitivity analyses are as follows.
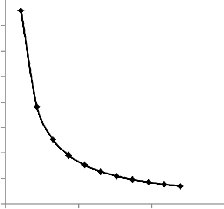
The table below shows the relationship between the microbial residence time and the bioreactor extent.
TABLE 3
VARIATION OF RESIDENCE TIME WITH BIOREACTOR EX- TENT
Radial extent of Bioreactor, rm (ft) | Residence time, τ res (day) |
0 | 0 |
1 | 0.004875 |
2 | 0.0195 |
3 | 0.043875 |
4 | 0.078 |
5 | 0.121875 |
6 | 0.1755 |
7 | 0.238875 |
8 | 0.312 |
9 | 0.394875 |
10 | 0.4875 |
the bioreactor extent increases. This is true as large bioreactor extent will require high microbial residence time to ensure the survival of the microbes within the reactor. The relationship is shown graphically below.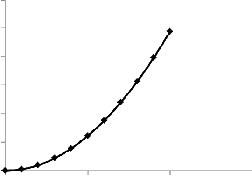
0.6
0
0 0.2 0.4 0.6
Initial Concentration of Injected nutrients
(mass fraction)
0.5
0.4
0.3
0.2
0.1
0
0 5 10 15
Radial Extent of Bioreactor, rm (ft)
Fig. 1. Variation of Residence time with distance
Fig. 2. Variation of Reaction time with concentration Indications from Table 4 and Figure 2 show that the growth rate of microbes increases with concentration, resulting in a decrease in reaction time.
The slug size in the reservoir pore volume (PV) that can be produced within the bioreactor is modeled by Eq. (5). It varies inversely with the injection well spacing. This relationship is further expressed in table 5 and figure 3 below.
It is observed that as the bioreactor extent increases, the time taken by the microbes to migrate through its extent increases.
The rate of microbial kinetics depends on the concentration of
TABLE 5
VARIATION OF SLUG SIZE WITH INJECTION WELL SPAC- ING
IJSER © 2014 http://www.ijser.org
International Journal of Scientific & Engineering Research, Volume 5, Issue 7, July-2014 605
ISSN 2229-5518
4 | 0.049073 |
5 | 0.048559 |
6 | 0.047938 |
7 | 0.047214 |
8 | 0.046393 |
9 | 0.045479 |
10 | 0.044479 |
0.012
0.01
0.008
0.006
0.004
0.002
0.051
0.05
0.049
0.048
0.047
0.046
0.045
0.044
0 5 10 15
Radial distance (ft)
0
0 2000000 4000000 6000000
Injection well spacing (A)
Fig. 3. Variation of slug size with injection well spacing
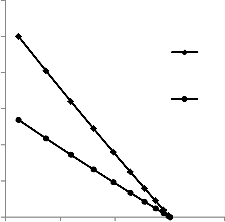
It is also evident from the model that if other parameters are constant, the slug size varies directly with the residual oil sat- uration and also with the square of the radial extent of the bioreactor.
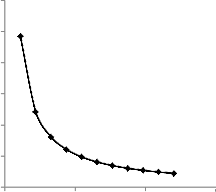
Nutrient supply to in-situ bioreactors of microbial systems are through the injection water. Eq. (7) is the model for nutrient supply to in-situ reactors. It gives the amount of nutrient at a given radial distance. It further shows that the nutrient re- quired for microbial activity is proportional to the porosity of the reservoir rock, if other parameters remain constant. Low porosity rock requires less nutrient and vice versa.
The inverse variation of amount of nutrient and radial dis- tance is clearly shown in table 6 and figure 4 as follows.
TABLE 6
VARIATION OF NUTRIENT WITH RADIAL DISTANCE
Fig. 4. Variation of amount of nutrient with radial distance
The gas size in the reservoir PV is modeled by Eq. (8). It pre- dicts an inverse relationship with injection well spacing and a linear relationship with the residual oil saturation. The table and figure below show the simulation results.
TABLE 7
VARIATION OF GAS SIZE IN RESERVOIR PORE VOLUME AS A FUNCTION OF INJECTION WELL SPACING
Radial dis- tance (ft) | Amount of nutrient (N t ) |
0 | 0.05 |
1 | 0.049942 |
2 | 0.049767 |
3 | 0.049476 |
IJSER © 2014 http://www.ijser.org
International Journal of Scientific & Engineering Research, Volume 5, Issue 7, July-2014 606
ISSN 2229-5518
0.0016
0.0014
0.0012
0.001
0.0008
0.0006
0.0004
0.0002
0
0 2000000 4000000 6000000
0.3
0.25
0.2
0.15
0.1
0.05
0
Original porosity
Instantaneous porosity
Injection well spacing (A)
Fig. 5. Gas size in Reservoir Pore volume as a function of injection well spacing
It can be seen that at lower injection well spacing, a higher gas
size will be produced within the bioreactor, the converse of
which would also be true.
The amount of nutrient needed for microbial activity in the reservoir varies with the reservoir rock porosity. It has been established that since the microbial activity takes place in the pores of the reservoir rock, the amount of nutrient required for effective inoculation of the residual oil will depend on the po- rosity of the reservoir rock. Higher porosity rock will require higher amount of nutrient and lower porosity rock lower amount of nutrient. The results of the simulation presented in table 8 and figure 6 are in agreement with this argument.
TABLE 8
VARIATION OF NUTRIENT WITH ORIGINAL AND INSTAN- TANEOUS POROSITIES
0.044 0.046 0.048 0.05 0.052
Amount of Nutrient (Nt)
Fig. 6. Variation of amount off nutrient with porosity
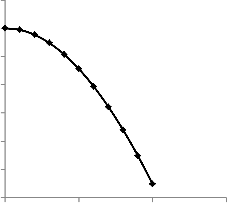
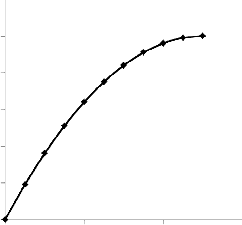
It has been shown that recovery is directly proportional to the pore volume fraction (i.e. concentration) of the retained cell bodies. This is due to the fact that the recovery will depend on the extent to which the microbes inoculate the residual oil. It is also true that since residual oil is a source of carbon (nutrient) for the microbes, a high residual oil saturation will imply high microbial activity which will lead to higher rate of inoculation and subsequently higher recovery. This is illustrated as fol- lows.
TABLE 9
RECOVERY AS A FUNCTION OF RESIDUAL OIL SATURA- TION
Original po- rosity | Instantaneous porosity | Amount of nutrient (N t ) |
0 | 0 | 0.05 |
0.0025 | 0.001346 | 0.049942 |
0.01 | 0.005385 | 0.049767 |
0.0225 | 0.012115 | 0.049476 |
0.04 | 0.021538 | 0.049073 |
0.0625 | 0.033654 | 0.048559 |
0.09 | 0.048462 | 0.047938 |
0.1225 | 0.065962 | 0.047214 |
0.16 | 0.086154 | 0.046393 |
0.2025 | 0.109038 | 0.045479 |
0.25 | 0.134615 | 0.044479 |
IJSER © 2014 http://www.ijser.org
International Journal of Scientific & Engineering Research, Volume 5, Issue 7, July-2014 607
ISSN 2229-5518
0.3
0.25
0.2
0.15
0.1
0.05
0
0 0.2 0.4 0.6
Residual oil saturation (Sor)
[5] H.W. Bang and B.H. Caudle,“Modeling of a Micellar/Polymer Process”, Soc. Pet. Eng. J., Vol. 24, pp.617-627, 1984
[6] G.E. Jennemen, R.M. Knapp, D.E. Menzie, M.J. McInerney, D.E. Re-
vus, J.B. Clark and D.M. Munnecke,“Transport Phenomena and Plugging in Berea sandstone using Microorganisms”, Proc. Int. Conf. on Microbial Enhanced Oil Recovery, Oklahoma, USA, pp.71-75, 1982
[7] J.L. Chisholm, S.V. Kashikar, R.M. Knapp, M.J. McInerney, D.E.
Menzie and N.J. Silfanus,“Microbial Enhanced Oil Recovery: Interfa- cial Tension and Gas-Induced Relative Permeability Effects”, 65th SPE Annual Technical Conference and Exhibition, New Orleans, USA, pp.169-176, 1990
[8] R. Almehaideb and A.Y. Zekri,“Optimization of Microbial Flooding in Carbonate Reservoirs”, SPE Asia Pacific Oil and Gas Conference and Exhibition, Melbourne, Australia, pp.1-10, 2002
[9] M.R. Islam and A. Gianetto,“Mathematical Modeling and Scaling up of Microbial Enhanced Oil Recovery”, CIM/SPE Int. Tech. Meet., Cal- gary, Sep 3-26, 1990
[10] D.M. Updegraff,“Plugging and Penetration of Petroleum Reservoir
Rock by Microorganisms”, Proc. Int. Conf. on Microbial Enhanced Oil
Fig. 7. Recovery as a function of Residual oil Saturation
As expected, a higher residual oil saturation would imply more oil possibly recoverable and consequently, if successful, greater recovery from MEOR application.
The modeling of the effects of reservoir properties on MEOR is an important predictive tool for quantitative analysis of the reservoir/microbial system, as has been presented. To ensure the best possible results from a MEOR project, four considera- tions are indispensable – laboratory analysis of the crude, res- ervoir engineering studies, correct determination of the mi- crobial culture to be used and proper implementation and monitoring of the injection process [18]. Although MEOR will be effective in almost any reservoir scenario, it is advised that only the best candidates, as determined by the factors given above should be considered for MEOR.
However, it is recommended that further studies in this re- spect incorporate reservoir heterogeneity in models proposed. ACKNOWLEDGEMENT
The authors wish to acknowledge Gift Anariochi Emenike for his contributions to this work.
[1] R.M. Knapp, M.J. McInerney, D.E. Menzie. and G.E. Jennemen, “The
Use of Microorganisms in Enhanced Oil Recovery”, Status Report of
US DOE, 1982
[2] C.G.J. Nmegbu,“Numerical Modeling of Microbially Enhanced Oil Recovery”, M.Tech Thesis, Rivers State University of Science and Technology, Nigeria, 2003
[3] R.S., Bryant “Potential Uses of Microorganisms in Petroleum Recov- ery Technology”, National Institute for Petroleum and Energy Re- search, Oklahoma, USA, 1990
[4] S. Maudgalya, M.J. McInerney, R.M. Knapp, D.P. Nagle and M.J.
Folmsbee,“Development of Bio-surfactant Based Microbial Enhanced
Oil Recovery Procedure”, SPE/DOE 14th Symposium on Improved Oil
Recovery, Oklahoma, USA, pp.1-6, 2004
Recovery, Oklahoma, USA, pp.80-85, 1982
[11] A.J. Sheehy,“Field Studies of Microbial EOR”, SPE/DOE 7th Symposi- um on Enhanced Oil Recovery, Oklahoma, USA, pp.785-790, 1990
[12] D. Dejun, L. Chenglong, J. Quanyi, W. Pingcang, F.L. Dietrich and Z..H. Zhou,“Systematic Extensive Laboratory Studies of Microbial EOR Mechanisms and Microbial EOR Application Results in Changqing Oilfield”, SPE Asia Pacific Oil and Gas Conference and Exhi- bition, Indonesia, pp.1-9, 1999
[13] E. Sunde, J. Beeder, R.K. Nilsen and T. Torsvik,“Aerobic Microbial
Enhanced Oil Recovery for Offshore Use”, SPE/DOE 8th Symposium on
Enhanced Oil Recovery, Oklahoma, USA, pp.497-502, 1992
[14] M.J.Jr. Pelczar, E.C. Chan and N.R. Krieg, Microbiology: Environmental and Industrial Microbiology, McGraw-Hill, pp.643-664, 1986
[15] K.L. Jang, M.M. Sharma, J.E. Findley, P.W. Chang and T.F. Yen,“An Investigation of the Transport of Bacteria Through Porous Media”, Proc. Int. Conf. on Microbial Enhanced Oil Recovery, Oklahoma, USA, pp.60-70, 1982
[16] F.I.Jr. Stalkup,Miscible Displacement, Society of Petroleum Engineers, Richardson, Texas, 1984
[17] F. Civan, R.M. Knapp and H.A. Ohen,“Automatic Estimation of Model Parameters for Swelling and Migration of Fine Particles in Po- rous Media”, AIChE Meeting, New Orleans, USA, Mar 6-10, 1988
[18] F.L. Dietrich, F.G. Brown, Z.H. Zhou and M.A. Maure,“Microbial
EOR Technology Advancement: Case Studies of Successful projects”, SPE Annual Technical Conference and Exhibition, Soc. Of Pet. Engrs., USA, pp.633-648, 1996
IJSER © 2014 http://www.ijser.org