efficient and effective system for this measurement purposes.
International Journal of Scientific & Engineering Research, Volume 5, Issue 2, February-2014 417
ISSN 2229-5518
PC Based Low Cost Energy Meter Billing System for Home and Commercial Buildings
Subrata Biswas, Mubinul Haque, Arafat Kabir, Md. Iftekhar Alam, Avijeet Banik
Abstract— Meter reading is an important part of billing system for residential and commercial buildings. The importance of an effective and efficient billing system cannot be over emphasized. This is very critical as small errors can lead to substantial loss of revenue. This often does not reflect the exact or true electricity consumption of such buildings, resulting in an inefficient bill mainly due to human errors. Thus, it is essential to have an efficient and effective system for this measurement purposes. This paper is about the design and construction of a personal computer (PC) based power monitoring system. It is made up of integrated circuits, active and passive hardware devices and a Visual Basic software program which is used for programming the PC serial port. This design monitors the amount of electrical power used, up to 600 watt, transmitting data through a central receiving unit connected to a PC via USB serial (COM) port. The PC displays and stores the data for future recall and simple cost analysis. The device is used to measure accurately the electric power consumed by a residential or commercial buildings which is more economical compared to the electromechanical devices. Utility companies can directly monitor and control electrical power supply billing of its distributed consumers without engaging the services of human oriented meter readers. The meter displays the consumed power per minute. The potential of the developed system are mainly the advantages of virtual instrumentation, flexibility, lower built cost and high performance, high accuracy in power monitoring and power management.
Index Terms— Energy Meter, Advanced Metering Infrastructure, Radio Frequency, Hall-effect, Transmitter, Receiver, Software interfacing.
—————————— ——————————
n energy meter is a type of device which measures the amount of electrical energy supplied to a residence or commercial building. The most common type is more properly known as kilo watt hour meter. Utilities record the values measured by these meters to generate an invoice for the electricity. They may also record other variables including the time when the electricity was used. The meter commonly used at this time is an electromechanical device based on rotor ele- ment which revolves at a speed proportional to power flow and drives a mechanical registering device on which power consumption is integrated. The output is the sum of all the power consumed during the life time of the meter. This value is read manually by meter readers, employed by the power companies specifically for this task. This is very critical as small errors can lead to substantial loss of revenue. In other words it is process that lends itself readily to human errors. This often does not reflect the exact or true electricity con- sumption of such buildings, resulting in an inefficient bill mainly due to human errors. Thus, it is essential to have an
efficient and effective system for this measurement purposes.![]()
• Subrata Biswas is Lecturer, Dept. of Electrical and Electronic Engineering, American International University - Bangladesh, Ba- nani, Dhaka-1213, Bangladesh. E-mail: shuvro1982@aiub.edu
• Mubinul Haque, Arafat Kabir, Md. Iftekhar Alam, Avijeet Banik are with the Dept. of Electrical and Electronic Engineering, American International University - Bangladesh, Banani, Dhaka-
![]()
1213, Bangladesh. E- mail: mubinulaiub@gmail.com; shakil_aiub09@yahoo.com; avijeet_a iub@yahoo.com; tonmoyrav @gmail.com
The PC based power monitoring system is the technology of automatically collecting consumption, diagnostic, and sta- tus data from conventional energy metering devices and transferring data to a central database for billing, trouble- shooting, and analyzing. This technology mainly saves utility of providers and the expense of periodic trips to each physical location to read a meter. Another advantage is that billing can be based on near real-time consumption rather than on esti- mates based on past or predicted consumption. This timely information coupled with analysis can help both utility pro- viders and customers for better controlling the use and pro- duction of electric energy.
This project is about the design and implementation of a personal computer (PC) based remote power monitoring sys- tem. The design monitors the amount of electrical power used by any residence or commercial building transmitting data through a radio link back to central receiving unit connected to a PC via USB (COM) port. The PC displays and stores the data for future recall and simple cost analysis. The device is used to measure accurately the electric power consumed by a residential or commercial buildings which is more economical compared to the electromechanical devices. Utility companies can directly monitor and control electrical power supply bill- ing of its spatially distributed consumers without engaging the services of meter readers.
A PC based energy meter is usually an electrical meter that records consumption of electric energy in intervals of an hour or less and communicates that information at least daily back to the utility for monitoring and billing purposes. This energy meters enable two-way communication between the meter and the central system. Unlike conventional energy
IJSER © 2014 http://www.ijser.org
International Journal of Scientific & Engineering Research, Volume 5, Issue 2, February-2014 418
ISSN 2229-5518
meters, PC based energy meters can gather data for remote reporting. Such an advanced metering system differs from traditional energy meter in that it enables two-way communications with the meter. The term PC based energy meter often refers to an electricity meter. PC based energy monitor usually involves real-time or near real-time sensors, power outage notification, and power quality monitoring. These additional features are more than simple conventional energy meter which only gives reading. They are similar in many respects to Advanced Metering Infrastructure (AMI) meters. This PC based power monitoring system has mainly three parts. First one is the monitoring device which is connected with power supply entering the building. It initially collects the data. The second one is the transmitter which transmits the data to the PC through a Radio Frequency network. There is a receiver connected to the PC which receives the data from the monitoring device to the PC which stores the data. The PC software records the data for analysis and cost measurement. Many additional features may be added like power outage notification, power quality, low voltage notification etc.[1]
Radio frequency used in this PC based power monitoring system can take many forms. The more common ones are handheld, mobile, satellite and fixed network solutions. There are both two-way RF systems and one-way RF systems in use. One of them can be used. In a two-way system, a radio transceiver normally sends a signal to a particular transmitter serial number, telling it to wake up from a resting state and transmit its data. The meter attached transceiver and the reading transceiver both send and receive radio signals and data. In a one-way continuous broadcast type system, the transmitter broadcasts readings continuously every few seconds. This means the reading device can be a receiver only, and PC based energy meter is a transmitter only. Data goes one way, from the monitoring device to the meter reading receiver. This technology of meter reading usually eliminates the need for the meter reader to enter the property or home, or to locate and open an underground meter pit. The utility saves money by increased speed of reading, has lower liability from entering private property, and has less chance of missing reads because of being locked out from meter access.
Energy meters are typically calibrated in billing units, the most common one being the kilowatt hour [kWh]. Periodic readings of energy meters establish billing cycles and energy used during a cycle. In settings when energy savings during certain periods are desired, meters may measure demand, the maximum use of power in some interval. "Time of day" metering allows electric rates to be changed .'s patent and named after him was presented by the Ganz Works at the Frankfurt Fair in the autumn of 1889, and the first induction kilowatt-hour meter was already marketed by the factory at the end of the same year. These were the first alternating- current watt-hour meters, known by the name of Bláthy- meters. The AC kilowatt hour meters used at present operate on the same principle as Bláthy's original invention. Also around 1889, Elihu Thomson of the American General Electric
company developed a recording watt meter (watt-hour meter) based on an ironless commutator motor. This meter overcame the disadvantages of the electrochemical type and could operate on either alternating or direct current. In 1894 Oliver Shallenberger of the Westinghouse Electric Corporation applied the induction principle previously used [10] only in AC ampere-hour meters to produce a watt-hour meter of the modern electromechanical form, using an induction disk whose rotational speed was made proportional to the power in the circuit. The Bláthy meter was similar to Shallenberger and Thomson meter in that they are two-phase motor meter. Although the induction meter would only work on alternating current, it eliminated the delicate and troublesome commutator of the Thomson design. Shallenberger fell ill and was unable to refine his initial large and heavy design, although he did also develop a polyphone version.[1]-[2]

Fig. 1. Mains Monitor and Data Transmitting Part
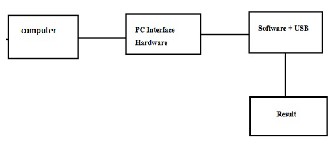
Fig. 2. PC Interface from Receiving Part
Electricity retailers may wish to charge customers different tariffs at different times of the day to better reflect the costs of generation and transmission. Since it is typically not cost effective to store significant amounts of electricity during a period of low demand for use during a period of high demand, costs will vary significantly depending on the time of day. The type of meter described above is used on a single-phase AC supply. Different phase configurations use additional voltage and current coils. The amount of energy represented by one revolution of the disc is denoted by the symbol Kwh which is given in units of watt-hours per revolution. The value 7.2 is commonly seen. Using the value of [Kwh] one can determine their power consumption at any given time by timing the disc with a stopwatch. [3] Some multiple tariff meters use different tariffs for different amounts of demand. These
IJSER © 2014 http://www.ijser.org
International Journal of Scientific & Engineering Research, Volume 5, Issue 2, February-2014 419
ISSN 2229-5518
are usually industrial meters.
Domestic Usage
Domestic variable-rate meters generally permit two to three tariffs ("peak", "off-peak" and "shoulder") and in such installations registers. A simple electromechanical time switch may be used. Multiple tariffs are made easier by time of use (TOU) meters which incorporate or are connected to a time switch and which have multiple. [4]
Commercial Usage
Large commercial and industrial premises may use electronic meters which record power usage in blocks of half an hour or less. This is because most electricity grids have demand surges throughout the day, and the power company may wish to give price incentives to large customers to reduce demand at these times. These demand surges often correspond to meal times or, famously, to advertisements in popular television programs.[4]
The main objectives to implement a PC based power monitoring system are mentioned below.
• Produced using locally available components and resources: this essential for making it feasible for manufacturing by local firms.
• Reliable and cost efficient in long term: the proposed design may require a larger initial investment but would save money in the long run if additional features are added.
• Immune to tampering: an electromechanical device can be easily tampered by adjusting the mechanical parts of the meter. In PC based circuit most of the mechanism would be electronic parts which would not transparent to most of the people and changing it would require replacing one or two components.
• Marketable: PC based power monitoring system is not a project of academic interest only. It is something that we really need today. So, it is very practical and can be immediately deployed in the real world.
• Additional facilities make feasible by digital circuitry: A digital circuit makes possible many features that are difficult or very expensive to implement in a mechanical device. Some of these features have been added to the proposed PC based monitoring device such as voltage, current and power reading.
A software interface may refer to a range of different types of interface at different "levels" with an operating system which also may interface with some pieces of hardwires. Ap- plications or programs running on the operating system may![]()
need to interact via streams, and in object oriented programs, objects within an application may need to interact via methods. For the simulation of power monitoring circuits there are not many available types of software. Our Software was written in C-sharp which is under programming language C. To run the .exe file no need to installed Visual Studio. If running the PC source code via Visual Studio we need com- puter interfacings software. In our project we focused on the amount of power consumption and also data storage, cost analysis, checksum and somewhere multiple unit use of pow- er monitoring circuit and master control circuit. [8]-[9]
C++ is one of the most popular programming languages and is implemented on a wide variety of hardware and oper- ating system platforms. C++ (pronounced "see plus plus") is a statically typed, free-form, multi-paradigm, compiled, general- purpose programming language. It is regarded as an interme- diate-level language, as it comprises a combination of both high-level and low-level language features. Developed by Bjarne Stroustrup starting in 1979 at Bell Labs, C++ was origi- nally named C with Classes, adding object oriented features, such as classes, and other enhancements to the C program- ming language. The language was renamed C++ in 1983, as a pun involving the increment operator. C++ is also used for hardware design where the design is initially described in C++, then analyzed, architecturally constrained, and scheduled to create a register-transfer level hardware description lan- guage via high-level synthesis. The language began as en- hancements to C, first adding classes, then virtual functions, operator overloading, multiple inheritance, templates and ex- ception handling, among other features.[5]
We wrote the software in C-sharp because of the C# language is intended to be a simple, modern, general-purpose, object-oriented programming language and it can be modified. Our software will show lot of things on power monitoring circuit. It works very simply. First of all, the monitoring circuit continuously transmit data to computer by using wireless communication[AM transmitter and Receiver] and USB com port. When we open the software we have to select the com port and click the button. Then software will show the amount of consumed current in Amperes, voltage, power in watt and total amount of cost. If want to save the data for further safety, click save button then it will automatically be saved in excel format in our computer.
For PC and software interfacing first of all we have to connect energy meter with PC via RS 232 serial ports (Com port), then we have to select the com port and baud rate then click the button. Then software will show the amount of con- sumed current in Amperes, voltage, power in watt and total amount of cost. If want to save the data for further safety, click save button then it will automatically be saved in excel format in our computer.
IJSER © 2014 http://www.ijser.org
International Journal of Scientific & Engineering Research, Volume 5, Issue 2, February-2014 420

ISSN 2229-5518

Fig. 3. Voltage and Current Power Showing

Fig. 4. Power Showing of 230V and 2.3W

Fig. 5. Port and Baud Rate Selection after Plugging Com-Port to PC
Fig. 6. Software Interfacing Program

Fig. 7. Software Interface Program Checking in MikroC
Microcontrollers are widely applied in the field of indus- try to solve engineering control problems. A new simulation software package for microcontroller, Proteus virtual system modeling (VSM), is introduced for industrial and educational use. Proteus combines circuit simulation, animated compo- nents and microprocessor models to facilitate co-simulation of complete microcontroller based designs. It is the software of “LABCENTER” Electronics. It is even possible to connect Pro- teus VSM with third party software debugger, and watch an- imated schematic diagram at work as if it was real hardware. This software has a library. From this library any components can be include in the circuit for simulation. It has thousands of components that use in real life and for a certain period of time library can be updated by internet. It is the professional software for embedded designers. It helps a designer to com- plete the work. [7]
IJSER © 2014 http://www.ijser.org
International Journal of Scientific & Engineering Research, Volume 5, Issue 2, February-2014 421
ISSN 2229-5518
We have built the circuit to simulate our project using Proteus v7.8 which is shown in Fig. 8. We have used this soft- ware because this is very much user friendly to design and simulate any circuits instead of using other software’s. As CT is not available in Proteus so we are using resister, diode and capacitor to measuring current. The design of the circuit in Proteus is given below.
Fig. 8. Circuit Diagram of Power Monitoring System


Fig. 9. Example of the LCD Screen Shortly after Starting
We have designed the PCB layout after implementing the whole circuit on the bread board to check whether it works properly or not. By using PCB design tools the work has been
carried out. [6] The back part of the PCB layout is shown in
Fig. 11.
Fig. 10. Back Part of the PCB Layout
As we are making a model of the whole project, it would not be possible to test its functionality with huge load that’s why we added external small load because off our safety. We had observed its functionality. When every function of the project runs properly then the PCB layout has been designed which is shown is Fig. 9 and Fig. 10 and implemented the cir- cuit on the PCB.
Fig. 11. Physical Construction of the Energy Meter
IJSER © 2014 http://www.ijser.org
International Journal of Scientific & Engineering Research, Volume 5, Issue 2, February-2014 422
ISSN 2229-5518

Fig. 12. LCD Display

Fig. 13. Meter Connected with PC via RS-232 Serial Port
The constructed Energy meter can measure up to 230V (RMS)
and 5A (RMS)
→ Voltage → Current → Power → Energy → Time
(second)
→ Reference voltage = 3.05V
[(VR1 ) / (VR1+ R1) ] × Voin = [(5.10k) / (5.10k+460k)] × 325.27 =
3.567V
Step size = Vref/255 = 3.06/255 = 0.012V
ADC = Vinput/Step size = 3.06/0.012 = 255
Our maximum input voltage = 3.06 (Vinput),So scaling is when input voltage is 3.06 the output to the LCD will show
230V.
Here,
A = 230/3.06 = 75.16339869
B = 255/3.06 = 83.33333333
Output = [(Vinput/Step size)/ B] × A [B and A are division
and multiplication factor]
= [(3.06/0.012) / 83.33333333] × 75.16339869
= 230V (RMS) will show in the LCD.
Here in our circuit we found the voltage is 4V (For 25 watt
bulb).By using VR2 we reduce the voltage according to the
data sheet (Appendix - B).For our test we use 25watt bulb. We
found the output of CT directly is 0.023V.According to data
sheet (Appendix-B) of CT for 5A current the output voltage is
0.9994V.
Scaling is for 0.9994V we will get 5A.
Now,
C = 5/0.9994 = 5.003001801
(Step size = 0.012)
Output = [(Vinput/Step size)/ B] × C
= [(0.023/0.012) / 83.33333333] × 5.003001801
= 0.115A (This larger than actual value)
= 0.12 A

Fig. 14. Current Vs. Voltage
Since the inception of electricity deregulation and market- driven pricing throughout the world, utilities have been looking for a means to match consumption with generation. Traditional electrical meters only measure total consumption, and so provide no information of when the energy was consumed at each metered site (market use rates are readily available to utilities however). PC based energy meters provide a way of measuring this site-specific information,
IJSER © 2014 http://www.ijser.org
International Journal of Scientific & Engineering Research, Volume 5, Issue 2, February-2014 423
ISSN 2229-5518
allowing price setting agencies to introduce different prices for consumption based on the time of day and the season. PC based energy meters may include measurements of surge voltages and harmonic distortion, allowing diagnosis of power quality problems. PC based power monitoring system offers potential benefits to utility companies in that they will be able to eliminate many jobs, but there are concerns that many of the "benefits" proponents cite for consumers, not only will fail to be realized, but to the contrary, could increase costs to the consumers. Power companies can install remote PC based power monitoring system specifically to enable remote detection of tampering, and specifically to discover energy theft. The change to PC based power monitoring system is useful to stop energy theft. PC based power monitoring system can provide benefits for utilities, retail providers and customers. Benefits will be recognized by the utilities with increased efficiencies, outage detection, tamper notification and reduced labor cost as a result of automating reads, connections and disconnects. The PC based power monitoring is something that is highly practical and would be useful in real world. It is a remarkable idea, which is viable not only technically but also financially. The PC based power monitoring system presents many advantages over conventional meter due to the fact that it is a centered on the digital circuit rather than moving parts. Since the PC based power monitoring system does not involve any moving parts, it does not suffer from any mechanical wear and tear and remains consistent and accurate throughout its life time. As integrated circuits are getting cheaper day by day, industrial production of PC based power monitoring system will be more economic than the conventional analog meter. Since, the data is available in the digital storage; it can be transmitted through various means through power line carrier or through radio transmitter to the central billing station.
Lastly, Computer based power monitoring billing system technology is an excellent idea for Bangladesh perspective. We tried proposed a cost efficient power monitoring system. We also researched to make a feasible system for Bangladesh perspective. If it is implemented in our country the corruption and inefficient bill mainly due to human errors of electricity sector will be reduced as well as the loss will also be reduced.
Now we are working to improve our technology. In fu- ture we want to add some extra features like-
Touch technology in PC based power monitoring system a meter reader carries a handheld computer or data collection device with a wand or probe. The device automatically collects the readings from a meter by touching or placing the read probe in close proximity to a reading coil enclosed in the touchpad. When a button is pressed, the probe sends an interrogate signal to the touch module to collect the meter reading. The software in the device matches the serial number to one in the route database, and saves the meter reading for later download to a billing or data collection computer. Since the meter reader still has to go to the site of the meter, this
may be referred to as "on-site" PC based power monitoring system. Another form of contact reader may use a standardized infrared port to transmit data.
In GSM or "drive-by" meter reading is where a reading device is installed in a vehicle. The meter reader drives the vehicle while the reading device automatically collects the meter readings. Often for mobile meter reading the reading equipment includes navigational and mapping features provided by GPS and mapping software. With mobile meter reading, the reader does not normally have to read the meters in any particular route order, but just drives the service area until all meters are read. Components often consist of a laptop or proprietary computer, software, RF receiver/transceiver, and external vehicle antennas. This can be introduced in PC based power monitoring system.
Software Interfacing Code for Energy meter
using System;
using System.Collections.Generic;
using System.ComponentModel;
using System.Data;
using System.Drawing;
using System.Linq;
using System.Text;
using System.Windows.Forms;
using System.IO.Ports;
namespace enargy_meter
{
public partial class Form1 : Form
{
public Form1()
{
InitializeComponent();
}
private void Form1_Load_1(object sender, EventArgs e)
{
string[] ports = SerialPort.GetPortNames();
foreach (string port in ports)
{
cmbPortList.Items.Add(port);
}
BaRaComboBox.Items.Add(1200);
BaRaComboBox.Items.Add(2400);
BaRaComboBox.Items.Add(4800);
BaRaComboBox.Items.Add(9600);
BaRaComboBox.Items.Add(19200);
BaRaComboBox.Items.Add(115200);
}
Partial code is given above.
IJSER © 2014 http://www.ijser.org
International Journal of Scientific & Engineering Research, Volume 5, Issue 2, February-2014 424
ISSN 2229-5518
The authors acknowledge the department of Electrical and Electronic Engineering, American International University – Bangladesh for giving permission to access equipment and work in Microprocessor and I/O System Lab, Control System Lab and Analog Electronics Lab and also express their special thanks to the authorities of Bangladesh Power Development Board (BPDB) for preparing the proposed model.
[1] A. Vojdani, "Smart Integration," IEEE Power & Energy
Magazine, vol. 6, pp. 71-79, Nov. 2008.
[2] Wang Tianmiao ; Zheng Suibing “A smart metering sys-
tem for monitoring electricity of building based on wire-![]()
less network” 10th IEEE International
ence , 2012 , Page(s): 26 - 31
[3] Moonsuk Choi, Ju. Seongho Ju and Yonghun Lim. 2008,![]()
“Design of Integrated Meter Reading System based on
Power-Line Communication”, Power Line
Communications and Its Applications, 2008. ISPLC 2008.
IEEE International Symposium on, pp. 280-284
[4] D.M. Han and J.H. Lim, "Smart home energy management
system” IEEE 802.15.4 and zigbee communication," IEEE
Trans. on Consumer Electronics, vol. 56, pp. 1403-1410,
Aug. 2010.
[5] H.G.Rodney, Tan IEEE, C.H.Lee and V.H.Mok, 2007.
Automatic Power Meter Reading System using GSM
Network. The 8th International Power Engineering
Conference, PP: 465-469.![]()
[6] Daniel D. Frey, Assistant Professor, Kevin N. Otto,
Associate Professor, Stan Taketani, “Manufacturing Block
Diagrams and Optimal Adjustment Procedures", Journal
of Manufacturing Science and Engineering, Volume 123,
Issue 1, October 1999.
[7] Bo Su, Li Wang, "Application of Proteus virtual system![]()
modeling (VSM) in teaching of microcontroller", 2010th
International Conference, Volume: 2, page(s) - 375 – 378,
IEEE.
[8] R. Hood, K. Kennedy, and H.A Muller, Efficient
Recompilation of Module Interfaces in a software
Development Environment, in Proc. of the SIGPLAN’![]()
86 Symposium on Compiler Construction, (ACM
SIGPLAN Notices, vol. 21, no 7), pages 180–189, ACM,
June 1986.
[9] Md. Mejbaul Haque, Md. Kamal Hossain, Md. Mortuza
Ali, Md. Rafiqul Islam Sheikh,” Microcontroller Based
Single Phase Digital Prepaid Energy Meter for Improved
Metering and Billing System” , International Journal of
Power Electronics and Drive System (IJPEDS), Vol.1, No.2,
December 2011, pp. 139~147.
IJSER © 2014 http://www.ijser.org