International Journal of Scientific & Engineering Research Volume 3, Issue 4, April 2012
ISSN 2229-5518
1
Optimizing water fountain as community based therapy for better health continuance – Preliminary Study.
Nasser Aly, Jahangir Kamaldin,Yohei Kobayashi, Eva Banninger Huber.
Abstract- Background: The healing aspects of natural sounds therapy including water sound are beginning to get a lot of interest in the medical fields. Numerous studies conducted on the value of natural sounds as a therapy for various psychological treatments. Objective: to observe the influence of water fountain melodies on anxiety level among the experimental groups before undergoing dental chec kup and to compare the effect of different water fountain melodies in reducing anxiety level by measuring the changes of brainwave signals. Methods: 4 types of water fountain melodies have been selected from 100 created melodies for the purpose of lab test. In this preliminary study we analyzed Electroencephalograph (EEG) data of 12 subjects. Volunteers divided into 4 experimental groups each group listen to one type of melody and one control group with no melody. Results: statistical analysis showed that Melody 2 has the first ranking which means that Melody 2 give the most effectiveness to brain in reducing anxiety. C onclusion: Melody intervention may has noticeable effectiveness on the brain in reducing anxiety than no melody and different melodies may have different effectiveness.
Keywords: Natural sounds, W ater fountain, Melodies, Electroencephalograph, Teenagers,
1Background
1 Music has a countless of health-related benefits, both psychologically and physiologically. However, because the healthful effects of music have not been fully explored scientifically, many questions about the efficiency of music have not been answered yet.Scientific attention begin to recognize this concept for alternative treatments especially for pain relief management, stress reduction, improvement of sleep patterns, development of general physical and mental wellbeing (Mullooly et. al, 1988).With the advancing
————————————————————
Nasser Aly; Advanced Medical and Dental Institute, University Sains Malaysia
.Jahangir Kamaldin; Advanced Medical and Dental Institute, University Sains Malaysia
Eva Banninger Huber; Institute of Psychology, University of Innsbruck, Austria
Yohei Kobayashi; Center of Policy and International Studies, University Sains Malaysia
technologies such as EEG (Electroencephalogram) and ECG (Electrocardiogram), physiological effects of sound on human mind and body can be investigated and quantified (Abdul Kadir et. al, 2009). Many authors reported that more researches are needed to study the effects of music on patients’ stress and anxiety reduction (Bradt J and Dileo C 2009).
IJSER © 2011 http://www.ijser.org
International Journal of Scientific & Engineering Research Volume 3, Issue 4, April 2012
ISSN 2229-5518
2
A clinical trial had done on the effects of music therapy on female breast cancer patients’ anxiety following radical mastectomy and concluded that music therapy has positive effects on decreasing their anxiety (Xiao-Mei Li etal 2011). The healing aspects of natural sounds therapy including water sound are beginning to get a lot of interest in the medical fields. Numerous studies conducted on the value of natural
Hypothesis:
It is predicted that water fountain rhythms could affect
teenager’s emotions in managing their uneasiness before
undergoing dental checkup.
sounds as a therapy for various psychological treatments
(Coensel BD etal 2011).
Does water fountain melody reduce anxiety induced by dental checkup? Are there any significance changes between experimental groups with melody intervention and control group?
We expected that there are differences in reducing anxiety among teenagers after melody intervention in term of
brainwave signals.
2 Objectives:
We aim to observe the influence of water fountain melodies on anxiety level among the experimental groups before
undergoing dental checkup.
To compare the effect of different water fountain melodies in reducing anxiety level by measuring the changes of brainwave
signals.
3 Methods:
Nearly 100 types of water fountain melodies have been created.4 types of melodies have been selected from the collection for the purpose of lab test.4 types dynamic white noise have been created one for each type of melody.The sound has been modified based on lab test results.Hands on
training for EEG recording using Enobio.
Recruiting volunteers were selected. Brochure and consent forms have been prepared and distributed for the volunteers to participate in this study.In this preliminary study we analyzed EEG’ data of 12 subjects. The subjects aged 12-16 years old, will be selected according to the inclusive and exclusive criteria:
Inclusion criteria
a. No previous anxious dental experience
b. Not having serious disease that can influence in EEG
examination (e.g., brain disease) Exclusion criteria
a. If in a serious debilitating oral disease (acute periodontal pain, pulpitis, abscess, or other acute infections, attachment loss or gingival recession, root hypersensitivity that might cause tooth hypersensitivity)
b. Patients with severe anxiety and non-cooperative
Once volunteer arrived, divided into groups by sequence of: Volunteer 1 will listen to Melody 1
Volunteer 2 will listen to Melody 2
Volunteer 5 will not listen to any Melody.
c. Have no dentin sensitivity to air stimulation. d. No hearing problem
c. Not interested in music
d. Having medical or psychology disorder that might affect pain thresholds
e. Using pain or anxiety medication
Volunteer 3 will listen to Melody 3
Volunteer 4 will listen to Melody 4
IJSER © 2011 http://www.ijser.org
International Journal of Scientific & Engineering Research Volume 3, Issue 4, April 2012
ISSN 2229-5518
3
Volunteer’s behaviors were not controlled by the experimenter as we would like to study volunteer’s behaviors in the actual state before undergo dental checkup.
Discussionsession to prepare the subject to be more serious
during the experiment’ steps.
In order to determine the effectiveness of water fountain melody in reducing anxiety, Melody Intervention introduced
right before dental checkup. EEG recordings were not implemented during dental checkup session to avoid confounding variables, e.g. facial muscle movement will affect clean data collection. We decided that EEG analysis focus on Melody Intervention section to examine the effectiveness of water fountain melodies in boosting volunteer’s relaxation and
reducing their anxiety level before undergoing dental checkup.
Steps of Composing Raw EEG Data
Since EEG signals consist of robust data, permutation method has been selected for the analysis. Thus, exact significance levels will be obtained rather than approximations. EEG data was analyzed and the sampling frequency was set. Next, the intelligent signal processing techniques were developed in
MATLAB to calculate EEG raw data. The artifacts were filtered
by applying threshold value into the signal analysis program. Afterward, the computed data was separated into 2 minutes data for each condition. Lastly, SPSS was utilized for further statistical analysis.
i.
IJSER © 2011 http://www.ijser.org
International Journal of Scientific & Engineering Research Volume 3, Issue 4, April 2012
ISSN 2229-5518
4
4 Results
Distribution Assumptions
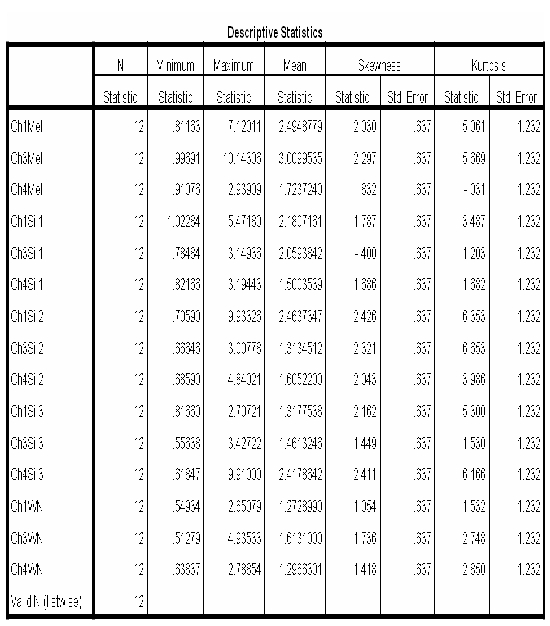
Table 1: shows the descriptive statistics about the EEG data. In the present study, researchers have collected 12 subjects. Each subject was analysed by conditions/channels example melody/channel 1.From here, some of the data is follows the normal distribution and some are not follows the normal
distribution since the value of minimum and maximum is not beyond -1.0 and 1.0and it is permutation method, so we assume that this data will freely follows any distribution.
IJSER © 2011 http://www.ijser.org
International Journal of Scientific & Engineering Research Volume 3, Issue 4, April 2012
ISSN 2229-5518
5
Behavior of Conditions
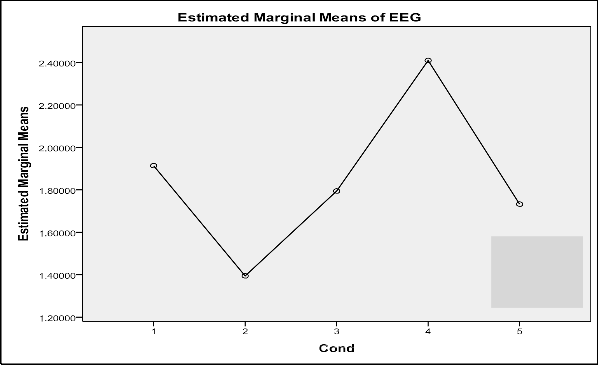
1: Silent 1
2: White Noise
3: Silent 2
4: Melody
5 : Silent 3
Figure 1: Estimated Marginal Means of EEG signal between Conditions.
Figure 1: shows the estimated marginal means of EEG data of all group of melody for each condition. Here, the purpose of this analysis is to see roughly the behaviour of EEG brainwave signals for each condition. From Figure 1.0, there is decrement
of marginal mean from condition 1 (Silent1) to condition 2
(White Noise). Then, there are upward trend of marginal mean from condition 2 (White Noise) until condition 4(Melody). The trend starts to decrease from condition 4 (Melody) to condition
5 (Silent 5).
IJSER © 2011 http://www.ijser.org
International Journal of Scientific & Engineering Research Volume 3, Issue 4, April 2012
ISSN 2229-5518
6
Behavior between Conditions & Channels
1: Silent 1
2: White Noise
3: Silent 2
4: Melody
5 : Silent 3
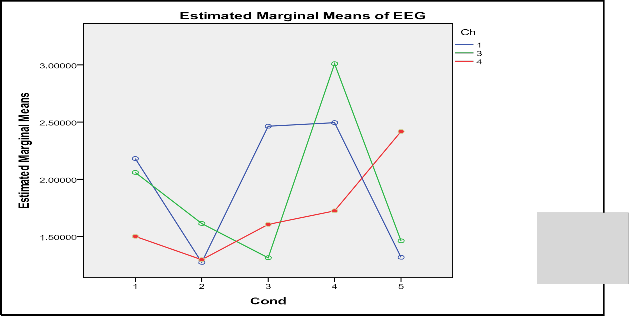
Figure 2: Estimated Marginal Means of EEG signal between Conditions and Channels.
Figure 2: shows the estimated marginal means of EEG signal between conditions and channels. The purpose of this analysis is to see which channel exhibits higher brainwave signal for each condition. From Figure 1.1, it shows that for condition
1(Silent1), the means of Channel 1 has the highest values
followed by Channel 3, and Channel 4. For condition 2 which is White Noise, it seems that the mean of Channel 1 and 4 are same. While for condition 3 (Silent 2), the mean of Channel 1 has the highest values followed by Channel 4 and Channel 3.
For condition 4 (Melody), it seems that Channel 3 has the highest mean compare to Channel 1 and 4. Channel 4 for condition 5 (Silent3) has the highest mean, followed by Channel 3 and 1.
IJSER © 2011 http://www.ijser.org
International Journal of Scientific & Engineering Research Volume 3, Issue 4, April 2012
ISSN 2229-5518
7
Choosing the Most Effective Melody Using ERP
Table 2 Means and Ranking of each Type of Melody Based on Channel
Type Melody | Ch1 Melody | Ranking Channel- 1 | Ch3 Melody | Ranking Channel- 3 | Ch4 Melody | Ranking Channel- 4 | Total Ranking | Ranking of Total Ranking |
Melody 1 | Mean | 1.11329 | 5 | 5.56998 | 1 | 1.37666 | 4 | 10 | 3 |
Melody 2 | Mean | 2.31556 | 3 | 3.35199 | 2 | 2.31255 | 1 | 6 | 1 |
Melody 3 | Mean | 2.19476 | 4 | 1.93915 | 5 | 1.80915 | 2 | 11 | 4.5 |
Melody 4 | Mean | 3.62669 | 1 | 3.13635 | 3 | 1.80330 | 3 | 7 | 2 |
No Melody | Mean | 2.80825 | 2 | 1.52450 | 4 | 1.23446 | 5 | 11 | 4.5 |
Table 2: shows the means and ranking of type of
melody based on channels. The purpose of this analysis is to illustrate which melody is effective in reducing anxiety level among participant during dental check-up. The researchers rank the mean for each channel based on the highest mean value. In order to evaluate which melody gives more
positive effect, the researcher sum up the ranking
of each channels. From column Ranking of Total
Ranking, it shows that Melody 2 has the first
ranking which means that Melody 2 is most effective among four melodies in reducing anxiety level. Followed by second ranking; Melody 4 and Melody 1 as the third melody that shows positive effects toward brainwaves signals. However, it seems that Melody 3 and No Melody have given the less effect on reducing the anxiety to subject
before going to dental treatment.
IJSER © 2011 http://www.ijser.org
International Journal of Scientific & Engineering Research Volume 3, Issue 4, April 2012
ISSN 2229-5518
8
5 Discussions:
• EEG is a study of charging electrical potential of the brain. Each electrode was placed on specific site of the scalp (T3, T4, T1) and measured brainwaves of different frequencies within the brain region (Abdul Kadir et. al, 2010). In our study, each melody has special characterization and accordingly different effect on brain activity (Fig. 3, 4, 5, 6). Changes of
• Figures 3, 4, 5and 6 are the power spectrum of the
part of each data Where Average dB is the loudness of each data. If it is 0, it means loudnessismaximum and
lower value means lower loudness relatively.
several rhythmic frequencies especially Alpha and Beta bands were examined to observe brain responses toward water fountain melodies. By analyzing brain signal activities, it is assumed that increasing alpha band power during listening water fountain melody will reflect relaxation in volunteer’s conscious conditions.
Surround dB is the stereo width of the data. If it is 0, it means the data is narrow perspective and higher
value means wider perspective
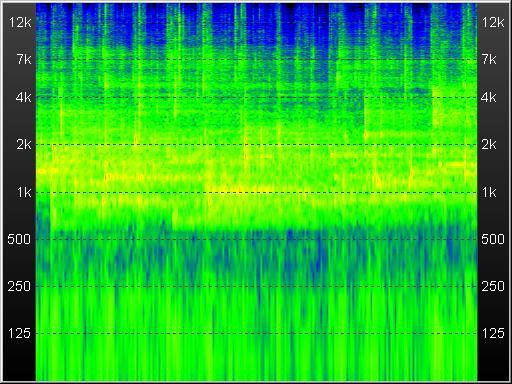
Figure 3: For Melody 1 Average dB -23.40 and Surround dB 1.97
IJSER © 2011 http://www.ijser.org
International Journal of Scientific & Engineering Research Volume 3, Issue 4, April 2012
ISSN 2229-5518
9
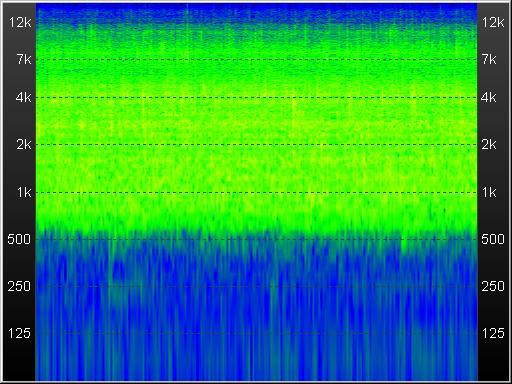
Figure 4: For Melody 2 Average dB -25.58 Surround dB 0.20, for Melody 3 Average dB -34.60
IJSER © 2011 http://www.ijser.org
International Journal of Scientific & Engineering Research Volume 3, Issue 4, April 2012
ISSN 2229-5518
10
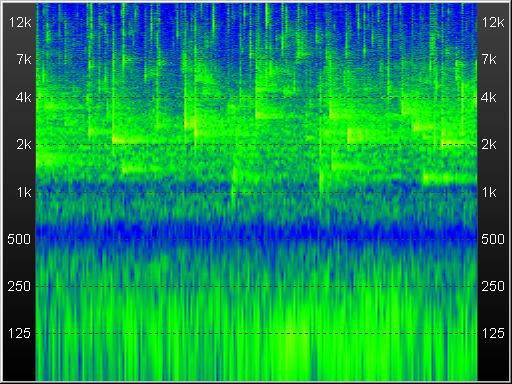
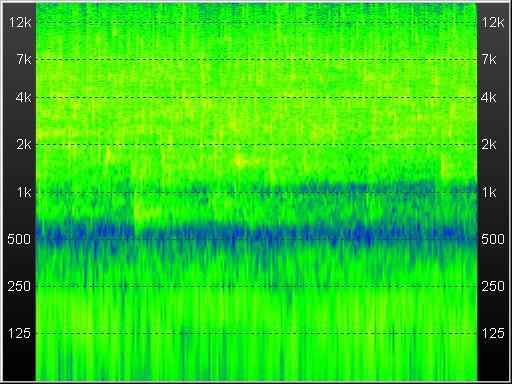
Figure 5: For Melody 3 Average dB -34.60 Surround dB 6.13
• Figure 6: For Melody 4 Average dB -21.82 Surround dB
IJSER © 2011 http://www.ijser.org
International Journal of Scientific & Engineering Research Volume 3, Issue 4, April 2012
ISSN 2229-5518
11
5 Conclusions
Analysis of EEG collected data indicated different changes of the brain wave signals after melody intervention. They showed that melody intervention has noticeable effectiveness on the brain in reducing anxiety than no melody and different melodies have different effectiveness. Within the study
limitations, our findings do not support that there are
significant differences between different melodies or between melody and no melody. Future analysis of data of large sample size should help to have more investigations of the changes in brainwave signals, facial actions and emotional regulations after melody intervention and providemore powerful
statistical implementation.
IJSER © 2011 http://www.ijser.org
International Journal of Scientific & Engineering Research Volume 3, Issue 4, April 2012
ISSN 2229-5518
12
6-Reference
 Abdul Kadir, R. S. S., Ghazali, M. H., Murat, Z., Taib, M. N., Abdul Rahman, H., & Mohd Aris, S. A. The preliminary study on the effect of nasyid song and rock music on brainwave signal using EEG. Paper presented at 2nd International Congress of Engineering Education 2010.
 Abdul Kadir, R. S. S., Yahaya Rashid, A. H., Abdul Rahman, H., Taib, M. N., Murat, Z., & Lias. S. Analysis of correlation
th
between body mass index (BMI) and brain wave using EEG for alpha and beta frequency band. Paper presented at 5
Colloquium on Signal Processing and Its Applications (CSPA) 2009.
 Bradt J, Dileo C. Music for stress and anxiety reduction in coronary heart disease patients. Cochrane Database of Systematic.
Published by John Wiley & Sons, Ltd 2009
 Coensel BD, Vanwetswinkel S, Botteldooren D.Effects of natural sounds on the perception of road traffic noise. J Acoust Soc
Am.2011; 129: 148-53.
 Mullooly, V. M., Levin, R. F., & Feldman, J. D. (1988). Music for postoperative pain and anxiety. Journal of the New York States
Nurses Association, 4-7.

Tilton, S. R. (2008). Review of state trait anxiety inventory (STAI). NewsNotes, 48 (2).
Xiao-Mei Li, Kai-Na Zhou, Hong Yan, Duo-Lao Wang & Yin-Ping Zhang Accepted for publication 23 July 2011
IJSER © 2011 http://www.ijser.org