International Journal of Scientific & Engineering Research, Volume 4, Issue 8, August-2013 1830
ISSN 2229-5518
Optimization of the Utilization of Vacuum Membrane Distillations Lithium Bromida-Water Absorption Refrigeration System Using Response Surface Methodology
Bayu Rudiyanto, Tsair-Wang Chung, Armansyah H. Tambunan
Abstract— Response surface methodology (RSM) has been applied for modeling and optimization in utilization of vacuum membrane distillation on Lithium Bromide-water absorption refrigeration system (ARS). The effect of the operational parameter is initial feed concentration, feed inlet tempera- ture, feed flow rate and interaction on the permeate flux. The developed model has been statistically validated by analysis of variance (ANOVA) and further used to predict the permeate flux. The results for the given factors is a saddle point one, which meant for the range given, there is no optimal value. This saddle point parameter is outside the data range which is concentration of 45.339 %, feed temperature at 62.934°C and flow rate 1.476 L.min-1 while its predicted flux value is 100.392 g.m-2.s-1.
`
Keywords: Response surface methodology; lithium bromide-water; vacuum membrane distillation, optimization.
1 INTRODUCTION
—————————— —————————
traditional generator bulky and heavy to be fitted into small scale device
[6].
Absorption cooling system was developed in 1850s by Ferdinand Care
and became the primary cooling system at that time before the invention of vapor compression refrigeration machine in 1880. As a power resource, absorption refrigeration system uses thermal energy to produce cooling cycle mechanism not compressor which used in vapor compression refrig- eration system. The effect is Coefficient of Performance (COP) product is lower but the system has several advantages i.e. provide more secure environmental effects. It also requires lower energy consumption com- pared with the other [1], [2].There are several heat energy resources such as energy exhaust from machinery or plant, solar energy, geothermal en- ergy and energy produced from agricultural waste [3]. But not all temper- ature generated is able for regeneration process in cooling mechanism. Regeneration is one of the main processes in the mechanism where gener- ator absorbs heat to separate water from the solution of LiBr-H 2 O in high temperature. This requirement of high temperature is the constraint on separation process. [1] stated that generator on absorption system using LiBr-H 2 O which operates at below 80°C will produce low COP. Meanwhile, according to [4], the use of generator in lithium bromide absorption refrigeration system which operates at 80-93°C will produce average COP at 0.725. Increasing COP number was also conducted by [4] by adding steam compressor which placed between generator and condensor. Steam compressor reduced vapor pressure when temperature getting lower and resulted COP at 0.65-0.75. Based on several studies above, it is necessary to develop alternative processes to improve high temperature requirement in generator to separate LiBr-H2 O solution. Moreover, the large contact area was needed to sepa- rate water vapor from aqueous lithium bromide solution which makes
————————————————
• Bayu Rudiyanto is Graduate School in Agricultural Engineering, Bogor
Agricultural University (IPB), Indonesia, Phone +62-81249209273. E-mail: bayu_rudiyanto@yahoo.com
• Tsair-Wang Chung is of Chemical Engineering/R&D Center of Membrane Technology, Chung Yuan Christian University, Chungli, Taoyuan 320, Taiwan, E-mail:twchung@cycu.edu.tw
• Armansyah H Tambunan is Departement of Mechanical and Biosystem
Engineering, Faculty of Agricultural Engineering and Technology, Bogor
Agricultural University (IPB), Indonesia., E-mail: ahtambun@yahoo.co
The membrane distillation (MD) is a process for vapor extraction from aqueous solution at temperature which may be much lower than the boil- ing point of the solution [7-12]. Vacuum membrane distillation (VMD) is another variant of MD. In this configuration low pressure or vacuum is applied on the permeate side of the membrane module by means of vacu- um pumps [13-16]. The applied permeate pressure is lower than the satu- ration pressure of volatile molecules to be separated from the feed solu- tion and condensation takes place outside the membrane module at tem- peratures much lower than the ambient temperature . The development of membranes used in the absorption cooling system still focuses on the selection of membrane types. [3] performed separation of LiBr-H 2 O solu- tion using vacuum membrane distillation with polyvinylidene fluoride (PVDF) to overcome the requirement of high regeneration temperature which resulted in lower temperature up to 67°C.
Using VMD in absorption refrigeration system ARS will cause several problems, including the achievement of optimal conditions to operate. The influential parameter in this process which were temperature, pressure, flow rate and concentration of the solution. Thus, to identify the optimal parameter VMD application on absorption refrigeration system, it is nec- essary to use statistical study. The purpose of this study was to determine the important parameters in the process of separation-aqueous LiBr.
2 EXPERIMENTAL SET UP
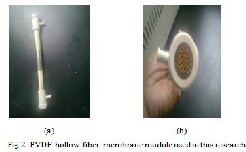
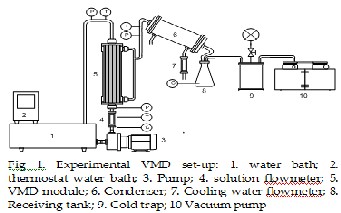
The experimental device was showed in Fig 1. The central part is a com- mercial shell-and-lumen membrane module UMP-0047R, supplied by Mycroza is trademark of Asahi Kasei Corporation. Basically, it consists of a set of equal polyvinylidene fluoride (PVDF) porous hydrophobic capillar- ies, assembled and made into a shell-and-lumen module. Hot feed of aqueous lithium bromide solution flows into the lumen side while the shell chamber is keeping in a vacuum state by cooling water or by vacuum pump. Fig 2 (a and b), shows the hollow fiber membrane module, in which twenty one of PVDF capillaries are assembled in plastic body and sealed securely to both ends. The principal characteristics of the hollow fiber membrane, as specified by the manufacturer, are showed in Table 1 and Table2.
IJSER © 2013 http://www.ijser.org
International Journal of Scientific & Engineering Research, Volume 4, Issue 8, August-2013 1831
ISSN 2229-5518
The temperature and pressure of the liquid feed were measured at the inlet and outlet of the membrane module. The temperature and pressure were measured continuously, in steady state. The temperature of the hot feed was measured at the inlet and outlet of the membrane module, while the temperature of water vapor was measured at the outlet of the permea- tion side. The temperatures was measured with thermocouple which con- nected to a digital multi-meter, with an accuracy ± 0.1 °C and the pressure was measured with pressure control type GP-D-0040GAPX, with an accu- racy of 0.001 bar. The feed inlet temperature was controlled by a thermo- stat Water Bath G-20 DENG YNG, with a temperature fluctuation of less than ±0.1°C.
The liquid feed was circulated with a circulation pump FLOJET MOD:
2130-546-115 and the feed flow was measured with a flowmeter HJ-
981204-25D-S, with precision ±2%. The volume of solution in water bath was determined in the beginning of experiment.
A water circulating vacuum pump GAST Model DAA-V503-EB) with a pressure adjuster was connected to the permeation side of the membrane module to produce the vacuum condition before the test began, and then the vacuum pressure would maintain constant at the condensing tempera- ture of cooling water during the test. A glass cold trap by cooling water was connected to the permeation side to recover the water vapor.
The flux of distilled water was calculated, in every case, by measuring of the permeate flux every ten minutes, during two hours, and by measuring the concentration before and after the process of using refractometer index (RI). Permeation flux means the quality of permeation water per unit area in an hour. The permeation flux is described as followed :
𝐽 = 𝑊�(𝑆. 𝑡)
(1)
Where J is the permeation flux, (kg.m-2h-1); W is the quantity of water, kg;
S is the membrane area, m2; and t is the time, h.
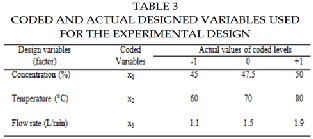
The operating parameter region of solution concentration, temperature and flow rate was showed in Table 3. Volume of the aqueous lithium bro- mide solution used in the experiment was 5 liter, but effective internal membrane area of hollow fiber module was only 0.02 m2. Table 3 shows the operating region and the levels of the variables in actual and coded values. The measured VMD distillate fluxes, the responses and the stand- ard deviations are also presented in table 4. The experimental design and analysis of data were done by using a commercial statistical package, JMP software version 7. By using the software, a Box–Behnken design with 3 center points was employed with three factors and three levels. This de- sign is not randomized. The Box–Behnken design contains of 15 experi- ments with three center points.
IJSER © 2013 http://www.ijser.org
International Journal of Scientific & Engineering Research, Volume 4, Issue 8, August-2013 1832
ISSN 2229-5518
3 RESULT AND DISCUSSION
The response surface model (RS-model) with interaction terms was
developed for the VMD distillate flux using eq 2 and the experimental data was summarized in the table 4.
𝑦 = 𝑏0 + ∑𝑛
𝑏𝑖 𝑥𝑖 + ∑𝑛
𝑏 𝑥 2 + ∑𝑛
𝑏 𝑥 𝑥
(2)
𝑖 =1
𝑖=1
𝑖𝑖 𝑖
𝑖<𝑗
𝑖𝑗 𝑖 𝑗
Where y is the predicted response, x i is the coded variables, and b 0 , bi, bii , bij are the regression coefficient. The values of the regression coefficients were determined using the ordinary least square method written as fol- lows [17] :
−1
𝑏 = �𝑥 ′𝑥�
𝑥 ′𝑦 (3)
Where b is a column vector of the regression coefficients, x is the de- sign matrix of the coded levelsof the input variables and y is column vec- tor of the response.
The obtained RS-model is written in eq 4, as a function of the coded variables and permits to predict the distillate flux ,Jw ( in kg/m2.s), as fol- lows :
𝒀 = 𝟏𝟏𝟏. 𝟏𝟏𝟒 + 𝟏𝟏𝟏. 𝟓𝟒𝟓𝒙𝟏 + 𝟏𝟐𝟓. 𝟏𝟓𝟏𝒙𝟏 + 𝟒𝟔. 𝟐𝟑𝟏𝒙𝟐 − 𝟓𝟔. 𝟏𝟓𝟐𝒙𝟏𝒙𝟏 −
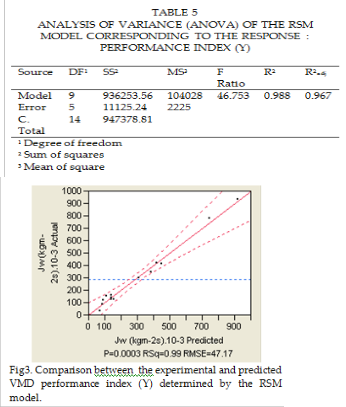
The mathematical equation used to calculate the ANOVA estimators (i.e. SS, MS, F-value, R2, R2 adj ) are detailed elsewhere. As can be seen in Table 5, the F-value is high, P- value smaller than 0.0003 and R2 value is about
0.988 in agreement with the adjusted coefficient of determination R2 adj . These indicate that the RS-model eq 4, is statically valid and can be used for prediction of the VMD distillate flux.
The significance of the regression coefficient of the models writ- ten as function of the coded variables could be tested with statistical Stu- dent t–test. Table 6 shows the t– test result for the experiment. From the test results, it shows that the feed initial temperature (x2 ), concentration (x1 ) and flow rate (x 3 ) are significance. Furthermore, its interaction effect with the feed initial concentration and temperature, concentration and feed flow, temperature and feed flow are still significant.
𝟏 𝟏 𝟏
𝟓𝟑. 𝟔𝟒𝟒𝒙𝟏𝒙𝟐 + 𝟏𝟑𝟏. 𝟒𝟓𝟏𝒙𝟏 𝒙𝟐 − 𝟏𝟐. 𝟒𝟓𝟓𝒙𝟏 + 𝟏𝟏𝟑. 𝟓𝟏𝟏𝒙𝟏 + 𝟑𝟏. 𝟒𝟔𝟐𝒙𝟐
(4)
It should be pointed out that the RS-model includes only the significant term. The significance of the regression coefficients was given in eq 4. Fig 3, gives the plot of experimental and predicted value. Moreo- ver, the statistical validation of the RS-model was performed by means of analysis of variance (ANOVA). The results were presented in Table 5.
The response surface for the given factors and response is a saddle point one, which meant for the range given, there is no optimal value. This sad- dle point parameter is outside the data range which set is concentration of
IJSER © 2013 http://www.ijser.org
International Journal of Scientific & Engineering Research, Volume 4, Issue 8, August-2013 1833
ISSN 2229-5518
45.339 %, feed temperature at 62.934°C and flow rate 1.476 L.min-1 while its predicted value is 100.392 g.m-2s-1.
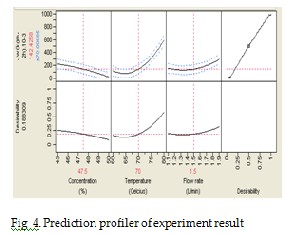
To have a more understanding on the effect of each parameter and their interaction, a prediction profiler of the experiment is show at Fig 4. As can be seen, the feed inlet temperature shows an obvious increasing curvature since its significance. The initial feed concentration show a slight decreas- ing curvature which shows its effect on the response. The feed flow shows a slight increasing curvature which shows its effect on the response.
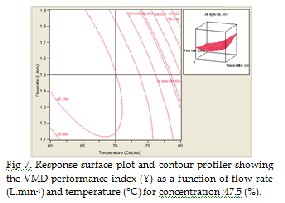
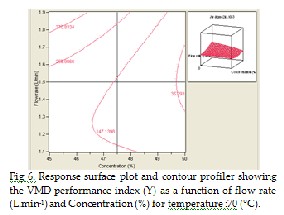
Fig 6, shows the effect of flow rate (x3 ) (L.min-1) and concentra- tion (x3 ) (%) on the response Y. The main effect of flow rate (x 3 ) (L.min-1) is greater than the main effect of concentration (x 1 ) %. The increase of both variable leads to the enhancement of Y. As it is mentioned before, due to the quadratic effect of x 1 , the response Y increases up to a maximum and then decreases for high x 1 values. Interaction effect x3 and x1 on the re- sponse Y is significant, although these interactions give negative values.
The effect of the VMD operating parameters on the distillate flux are plot- ted in Fig 5-7 in 3-D and 2-D contour plots. For example, Fig 5, shows the effect of the feed inlet temperature (x 2 ) and initial feed concentration (x 1 ) on the permeate flux. As can be seen, the increase of initial feed concentra- tion will leads to a decrease of the permeate flux while the increment of feed inlet temperature will leads to an increase of the response. At high concentration, the effect of temperature is stronger than at low concentra- tion. For example, at concentration between 45%-50%, at temperature of
60°C and feed flow 1.5 L.min-1 will produce permeate flux from 112.497 g.m-2.s-1 to 67.511 g.m-2.s-1. In contrast, at concentration 45 % and tempera- ture between 60°C-80°C will produce permeate flux from 112.497 g.m-2.s-1 to 739.764 g.m-2.s-1 .The graph also confirms the strong effect of the feed inlet temperature over the initial feed concentration.
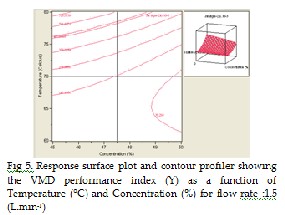
Fig 7, shows a strong main effect of temperature (x2 ) (°C) on the response Y. The increment of this variable conducts to an increase of Y and the main effect of flow rate (x 3 ) (L.min-1) is smaller compared to the main effect of temperature. However, the quadratic effect of x2 is greater than the quad- ratic effect of x3 , and the interaction effect between temperature and flow rate is significant and gives a positive value.
4 CONCLUSIONS
Design of experiments and response surface methodology (RSM)
were applied for desalination by VMD. According to the predictions of the performance index the highest positive effect was attributed to the feed inlet temperature. The feed flow rate had small positive and the concen- tration had negative effect, i.e. the increase of this factor led to a gradual reduction of the permeate flux. All factors have quadratic effects and a small interaction effect on the specific performance index was detected between concentration versus flow rate, and concentration versus temper- ature.
ACKNOWLEDGMENTS
This project is support by Departement of Chemical Engineering,
Chung Yuan Christian University, Taiwan and Heat and Mass Transfer Laboratory, Department of Mechanical and Biosystem Engineering, Bogor Agricultural University, Indonesia
IJSER © 2013 http://www.ijser.org
International Journal of Scientific & Engineering Research, Volume 4, Issue 8, August-2013 1834
ISSN 2229-5518
Nomenclature
DF degree of freedom
F-value ratio of variances (ANOVA test)
i and j subscripts (integer variables) Jw permeate flux
MS mean square (ANOVA test)
P -value probability in statistical significance testing (ANOVA test) R2 coefficient of multiple determination
R2 adj adjusted statistic coefficient
SS sum of squares (ANOVA test)
x1, x2, x3 coded levels of variables (factors) Y performance index
* superscript indicating optimal values of variables
Process and Product Optimization Using Designed Experiments. JohnWiley & Sons 2002.
REFERENCES
[1] Vargas, J.V.C., Ordonez, J.C., Dilay, E. and Parise, J.A.R.; “ Modeling, simulation and optimization of a solar collector driven water heating and absorption cooling plant,” Sol. Energy, 83 (8), 1232–1244 (2009)
[2] Satha, A. and Thanarath, S.; “Experimental studies of single effect ab- sorption refrigerator using aqueous lithium-bromide: Effect of operat- ing condition to system performance,” Exp. Therm. Fluid Sc.i, 32, 658-
669 (2007)
[3] Wang, Z.S., Ghu, Z., Feng, S. and Yun, L.; “Application of vacuum membrane distillation to lithium bromide absorption refrigeration system,” Int. J. Refrig., 32, 1587-1596 (2009)
[4] Gu, Y.X., Wu, Y.Y. and Ke, X.;”Experimental research on second generator in pump-free lithium bromide absorption chiller system. Journal of Xi’an Jiaotong University, 01,67-73 (2006)
[5] Wu, J.F.,Chen, Y.P., and Shi, M.H.; “Promotion of compressor assisted LiBr absorption chilling cycle driven by solar energy,” J. Eng. Ther- mophys., 01, 21–23 (2007)
[6] Kim, Y.J., Joshi, Y.K. and Fedorov, A.G.; “An absorption based miniatur heat pump system electronic cooling,” Int. J. Refrig., 31, 23-33 (2008)
[7] El-Amali, A., Bouguecha S. and Maalej M.; “Experimental study of air gap and direct contact membrane distillation configurations: applica- tion to geothermal and seawater desalination,” Desalination, 168, 357–
357 (2004)
[8] Khayet, M. and Cojocaru, C.; ”Air gap membrane distillation: Desalina- tion, modeling and optimization,”Desalination, 287, 138–145 (2012)
[9] Khayet, M., Cojocaru, C. and Baroudi, A.; "Modeling and optimization of sweeping gas,” Desalination, 287, 159–166 (2012)
[10] Khayet, M. and Mengual, J.I.; “Effect of salt concentration during the
treatment of humid acid solutions by membrane distillation,” Desali- nation, 168, 373–381 (2004)
[11] Sudoh, M., Takuwa, K. and Iizuka H.;“ Nagamatsuya K. Effect of thermal and concentration boundary layers on vapor permeation in membrane distillation of aqueous-lithium bromide solution,” J. Membrane Sci., 131, 1-7 (1997)
[12] Abdullah, A., Naif D. and Nidal H.; “Membrane distillation: A com- prehensive review,” Desalination, 287, 2–18 (2012)
[13] El-Bourawi, M.S., Khayet, M., Maa R., Ding, Z., Li Z. and Zhang X.; “Application of vacuum membrane distillation for ammonia removal,” J. Membrane Sci., 301, 200-209 (2007)
[14] Toraj, M. and Mohammad, A.S.; “Application of taguchi method in optimization of desalination by vacuum membrane distillation” De- salination 249, 83-89 (2009)
[15] Fawzi, B., Fahmi A.A. and Khalid B.M.; ”Desalination by vacuum membrane distillation: sensitivity analysis” Sep. Purif. Technol., 33 75-
87 (2003)
[16] Mengual, J.I., Khayet M. and Godino M.P.; “Heat and mass transfer in vacuum membrane distillation,” Int. Jur. Heat and Mass Transfer, 47,
865-875(2004)
[17] Myers, R.H. and Montgomery, D.C.; Response Surface Methodology:
IJSER © 2013 http://www.ijser.org