International Journal of Scientific & Engineering Research Volume 2, Issue 8, August-2011 1
ISSN 2229-5518
Optimization of shaft design under fatigue loading using Goodman method
Deepan Marudachalam M.G, K.Kanthavel, R.Krishnaraj
Abstract— In this paper frequent failure of a shaft employed in a spinning machine is studied. Failure occurred at the vicinity of change in cross section of the shaft where a relief groove is present. Considering the drive system, forces and the torques acting on the shaft are determined using which the stresses occurring at the failure section are calculated. Stress analysis is also carried out by using finite element method (FEM) and the results are compared with the calculated values. Stress concentration factors at the failure cross section are calculated using least square method from which fatigue stress concentration factors are calculated. Endurance limit using Goodman’s method, fatigue factor of safety and the theoretical no of cycles sustained by the shaft before failure is estimated. In conclusion it is seen that the increase in fillet radii of the shaft and change in the position of the support decreases the stress concentration factor, increase the endurance limit and fatigue factor of safety of the shaft.
Index Terms— Shaft, Fatigue, Goodman, Relief groove, Stress concentration, Fillet radii, Support
—————————— ——————————
1 INTRODUCTION
shaft is a rotating member, usually of circular cross- section for transmitting power. It is supported by bearings and supports gear, sprockets, wheels and rotors. It is subjected to torsion, traverse or axial loads, acting in single or in combination. Generally shafts are not of uniform diameter but are stepped to provide shoulders for locating gears, pulleys and bearings. The stress on the shaft at a particular point varies with rotation of shaft there by introducing fatigue. The first scientific investigation on fatigue failure was made by AugustWohler on railway axles. Even a ‗perfect‘ component when repeatedly subjected to loads of sufficient magnitude, will eventually propagate a fatigue crack in some highly stressed region, normally at the surface, until final fracture occurs. Extensive work has been carried out by failure analysis research community investigating the nature of fatigue failures using analytical, semi-empirical and experimental methods [1]. According to Osgood all machine and structural designs are problems in fatigue [2]. Failure of an elevator shaft due torsion-bending fatigue was given in [3]. The failure of a shaft due improper fastening of support was explained in [4]. Some gear shaft failures have been reported and common causes of failure have been high stresses, friction or fretting [5-7]. J.F Darlington and J.D. Brooker have proposed that stress relieving, change to simply supported, increase of diameter and a change of
————————————————
Deepan Marudachalam M.G is currently pursuing masters degree program in Engineering Design in Anna University of technology, Coimbatore, In- dia, PH-919865052762. E-mail: deepan.mg@gmail.com
K.Kanthavel is currently working as Assistant Professor in department of Mechanical engineering in Anna University of technology, Coimbatore, India, PH-919894666288. E-mail: kanthavel_k@gmail.com
material can reduce the impact of fatigue by 45%, 20%,
20% and 10% respectively [8]. Accurate stress concentration factors for shoulder fillet in round and flat
bars for different loading conditions are given in [9]. Effect of steady torsion on fatigue crack initiation and propagation under rotating bending subjected to multi- axial fatigue and mixed mode cracking is discussed in [10]. Failure analysis of a locomotive turbocharger main- shaft and rear axle of an automobile were discussed in [11, 12]. Celalettin Karaagac and M.Evren Toygar considered an agitator shaft with a circumferential groove for which the fatigue life has been estimated [13]. Michele Zappalorto, Filippo Berto and Paolo Lazzarin predicted the notch stress concentration factors of round bars under torsion [14].
2 SHAFT MODEL
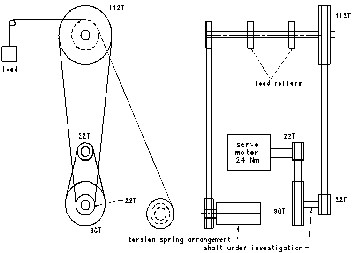
The shaft investigated in this paper failed after 35days of installation at 24 hr duty cycle. The basic drive arrangement is shown in (Fig. 1) which is required to lift a load of 960 kg. The drive arrangement consists of a 24Nm servo motor, torsion spring and timing belt drive for power transmission. The function of this arrangement is to lift the weight up and down through a distance of
230mm. As the load starts to move in upward direction
the torsion spring untwists there by increasing the load
on the servo motor and subsequently on the 22T-90T shaft
shown in Fig. 2. The load moves at a velocity of 10 mm/s thereby allowing the shaft under consideration to rotate
at 4 rpm. The geometry of the shaft with its components is shown in Fig. 2. The material of the shaft under consideration is C55Mn75 (En9). The mechanical properties are shown in Table 1 and its chemical composition according to IS 1570 consists of C and Mn in
IJSER © 2011
http://www.ijser.org
International Journal of Scientific & Engineering Research Volume 2, Issue 8, August-2011 2
ISSN 2229-5518
percentage of 0.55 and 0.75 respectively [15]. The microstructure corresponding to this material is lamellar- pearlite with a grain size of 5-8 ASTM. Since the shaft is working in a textile mill the operating temperature is at around 35°C. It can be seen that the failure has taken place at the relief groove that has been provided in the shaft for bearing seating as shown in Fig. 3 were the stress concentration would be more due to abrupt change in cross section of the shaft.
marks are noticed along the circumference of the shaft (Fig. 3). The boundaries between adjacent fracture planes, i.e., between each pair of ratchet marks is a fracture origin, and as these individual cracks grow inward they eventually join together on a single plane. The small instantaneous zone indicates the stress at the time when the shaft finally broke was low, but the multiple origins and the ratchet marks show that there was enough stress to cause cracking at many points around the perimeter almost simultaneously. From this it can concluded that there must have been a significant stress concentration.
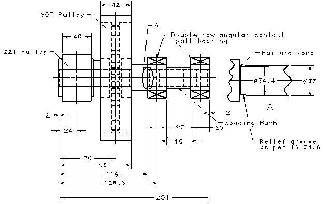
Fig. 1. Basic arrangement of drive system
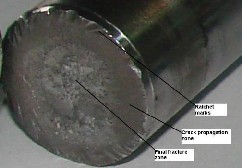
Fig. 3. Fracture surface
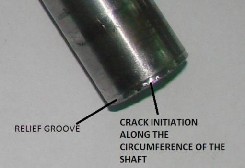
Fig. 4. Ariel view of shaft
Fig. 2. Shaft and its components
TABLE 1
MECHANICAL PROPERTIES OF SHAFT
Tensile strength (MPa) | Yield strength (MPa) | % Minimum elongation | Brinell hardness (BHN) | Pois- sions ratio | Modulus of elasticity (GPa) |
720 | 400 | 13 | 265 | 0.3 | 206 |
It can be seen that the failure has taken place at the relief groove that has been provided in the shaft for bearing seating as shown in Fig. 4 were the stress concentration would be more due to abrupt change in cross section of the shaft. From visual examination a series of ratchet
3 GOODMAN METHOD
The final endurance limit of the shaft is found using Goodman‘s equation by taking mean stress (σM) in to account. Goodman curve is a plot between the mean stress along X-axis and amplitude stress along Y-axis.
3.1 Force Analysis
From drive arrangement shown in Fig. 1 the shaft under consideration is subjected to horizontal and vertical component of forces, for both 22T and 90T pulleys. In addition to the above the shaft has to transmit some amount of torque to lift the weight. The forces and torque on the shaft increases as the mass moves in upward direction and these would be maximum at 230mm traverse and minimum at initial position. When the mass travels through 230mm the main shaft and 22T-90T shaft would rotate by 130.6 and 670 degrees respectively. The
IJSER © 2011
http://www.ijser.org
International Journal of Scientific & Engineering Research Volume 2, Issue 8, August-2011 3
ISSN 2229-5518
values of forces and torques at initial and final positions of the mass are given in Table 2.
TABLE 2
FORCES AND TORQUES ACTING ON SHAFT
Lift (mm) | Force due to 22T pulley(N) | Force due to 90T pulley(N) | Torque transmit- ted (Nm) |
Lift (mm) | X- Component | Y- Component | X- Component | Y- Component | Torque transmit- ted (Nm) |
0 | 104.2 | 468.5 | 66.2 | 167 | 10.31 |
230 | 827.2 | 3625.4 | 388.2 | 757.6 | 81.5 |
3.2 STRESS ANALYSIS
The shaft under consideration is being subjected to bending and shear stress due to vertical and horizontal component force, and shear stress due to torque transmis- sion. So as the shaft rotates there is a fluctuation of stress, the point which is subjected to maximum stress value is found and shown in Fig. 5. The various bending (σnom) and shear stress (τnom) at the failure surface is found. Ac- cording to [9] the accurate stress concentration factors corresponding to shear and bending stress can be found using least square method. The radii at relief groove was found to be 0.6mm corresponding to IS 3428, correspond- ing to which stress concentration due to bending (Ktb) and stress concentration due to shear (Kts) was found to be
2.85 and 1.91 respectively which were calculated using
[9]. For dynamic loading, we need to modify the theoreti-
cal stress-concentration factor based on the notch sensitiv-
ity of the material. Fatigue stress concentration factor Kf
can be calculated as [3]:
Kf = 1 + q (Kt – 1) (1)
where q is the notch sensitivity it can be defined from the
Kunn-Hardarth formula in terms of Neuber‘s constant (a)
and the notch radius (r).
q = 1 / (1+ (√a / √r)) (2)
From the value of √a corresponding to the given ultimate strength was found to be 0.062 inch. Substituting the val- ue of √a and √r in inches we get q = 0.712. Using the above values the fatigue stress concentration factor due to bending (Kfb) and shear (Kfs) were found to be 2.31 and
1.64 respectively. The actual bending (σactual) and the shear
stress (τactual) at the fractures surface was calculated by multiplying the stresses obtained at that section by the fatigue stress concentration factors Kfb and Kfs respective-
ly [3]. Fig.6 depicts the magnitude of the various stresses acting on the maximum loaded point at various positions of the shaft. It is seen that the bending stress due to ver- tical force is predominant. The equivalent stress acting on shaft can be calculated using ―Shape Deformation Energy Hypothesis‖ [3] as
σEQ = √( ( Kfb . σactual.)2 + 3 . ( Kft . τactual )2) (3) Fig.7 shows the fluctuation of equivalent stress with the degree of rotation of the shaft and, it is seen that its value would be maximum at the top most position of the mass, for the point under investigation.
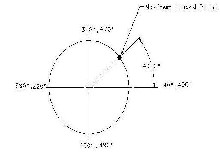
Fig. 5. Determination of point subjected to maximum loading
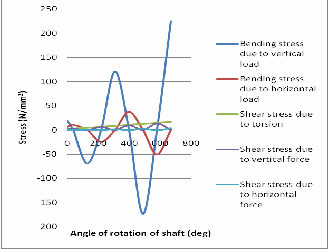
Fig. 6. Fluctuation of stresses at different position of shaft
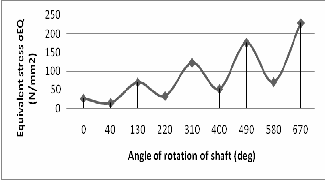
Fig. 7. Fluctuation of equivalent stresses at different position of shaft
3.3 Fatigue strength analysis by Goodman method
Fatigue strength (endurance limit σE) of the shaft
material was calculated as [3]
σE = 0.5 . UTS = 0.5 . 720 = 360 N/mm2
Considering the corrections factors for endurance limit we find the new endurance
limit (σEI) as
σEI = σE . Cload . Csize . Csurf . Ctemp . Creliab (4)
IJSER © 2011
http://www.ijser.org
International Journal of Scientific & Engineering Research Volume 2, Issue 8, August-2011 4
ISSN 2229-5518
The calculated correction factors are given in the Table 3.
TABLE 3
CALCULATED CORRECTION FACTORS
Cload | Csize | Csurf | Ctemp | Creliab |
1 | 0.843 | 0.788 | 1 | 0.814 |
Using the values given in Table 3 modified endurance limit was calculated as 195 N/mm2. From our above calculations we know that average stress value (σM) is not zero. To calculate σM, we have to consider the change of stress value occurring at the fracture surface in time. From our calculation we found that the value of stress in not constant with time as shown in fig.7. Therefore this accounts for a ―Variable-amplitude stress‖.To calculate average stress value, we have to transform ―Variable- amplitude stress‖ into ―Constant-amplitude stress‖ by considering the point subjected to maximum loading shown in fig.5. Fig.7 shows the variation of stress with the rotation of the shaft from which the average stress can be found. In this case average stress value is 121.5
N/mm2.Considering average stress value, earlier calculated endurance limit is modified. By the analysis, criteria of Goodman [3] the modified endurance limit (σEII) is calculated as
(σEII) = σEI. (1-(σM/UTS)) (5) Substituting the values for the above expression the
modified endurance limit was found to be 162 N/mm2 as shown in Fig.8. Considering the modified endurance limit (σEII) and the maximum equivalent stress, fatigue safety factor (ν) can be calculated as [3]
ν = σEII/ σEQ = 162/228 = 0.71 (6)
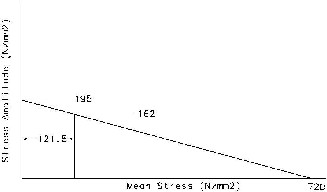
Fig. 8. Endurance limit determination using Goodman method
3.4 Fatigue life analysis
For further fatigue analysis, stress-cycle (S-N) curve of the shaft is estimated. To draw the S-N curve of the shaft, stress value (σF) where fatigue failure cycle at 103 cycles occur, can be calculated as [3]
σF = m.UTS (7)
where m = 0.9 for bending. The stress value at Nf = 103 according Eq. (7) is 648 N/mm2. The second point at the graph is the endurance limit value, which is 106 cycles for steel corresponding to modified endurance limit calculated using the Eq. 5, 162 N/mm2 as shown in Fig. 9. The shaft is subjected to a maximum stress value of 228
N/mm2 for this stress value the shaft life would be 201342 cycles as shown in Fig. 9 which supports our thesis.
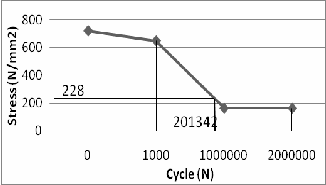
Fig. 9.Calculated S-N curve
4 FINITE ELEMENT ANALYSIS
To examine stress distribution at the fracture surface, finite element method (FEM) was employed. ANSYS program was used for analysis to cross check the calculated values of stress. The element meshes were generated, boundary condition corresponding to maximum loading condition was given and stress values for the input conditions are shown in fig.10. Stress analysis through ANSYS also show that maximum value of stress occurs at the vicinity of change in cross section of the shaft where a relief groove is present.
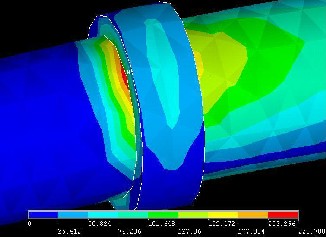
Fig. 10. Stress distribution at the fracture zone for maximum loaded condition
IJSER © 2011
http://www.ijser.org
International Journal of Scientific & Engineering Research Volume 2, Issue 8, August-2011 5
ISSN 2229-5518
5 RESULT AND DISCUSSION
By increasing radius of curvature (RC) at the shaft shoulder [8], stresses occurring the fracture zone can be decreased effectively. The effect of fatigue stress concentration on different radii is calculated using [9] and shown in Fig. 11. As the shoulder fillet radii is increased from 0.6 to 2 the fatigue factor of safety increases from
0.71 to 1.05 shown in Fig. 12. To further increase the fatigue safety factor the shaft supports can be redesigned to a simply supported beam [8] from over hung beam. The variation of equivalent values of stress with angle of rotation of the shaft for simply supported beam is shown Fig. 13. It was observed that the fatigue factor of safety of
2.04 was obtained after doing the above said modifications in the shaft configuration.
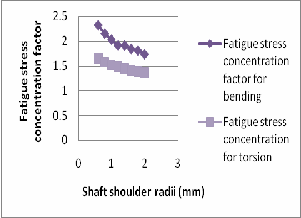
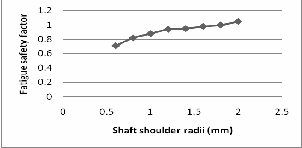
Fig. 11. Variation of fatigue stress concentration with shaft shoulder radii
Fig.12. Effect of shoulder radii with fatigue safety factor
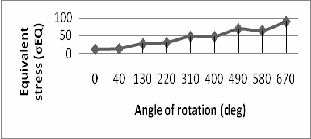
Fig.13. Fluctuation of equivalent stress for modified support position
6 CONCLUSION
Failure analysis of the shaft is investigated in detail. Mechanical properties of the shaft are determined. After visual investigation of the fracture surface it is concluded that the failure occurred due to torsional-bending fatigue. Fatigue crack has initiated at the relief groove. Forces and torques acting on the shaft are determined; stress occurring at the fracture surface are calculated. Endurance limit and fatigue safety factor is calculated, fatigue life of shaft is estimated. Fracture of the shaft occurred due to faulty design, causing a high notch effect. In conclusion effect of change in radius of curvature on stress intensity, effective placements of supports and precautions which have to be taken to prevent a similar failure is clarified.
REFERENCES
[1] Rice RC. Fatigue design handbook. 3rd ed. York: SAE; 1997. [2] Osgood CC. Fatigue design. Oxford: Pergamon press; 1982.
[3] A.Goksenli, I.B. Eryurek ‗Failure analysis of an elevator drive
shaft.‘ Engineering failure analysis 16 (2009) 1011-1019
[4] S.Cicero, R.Cicero, R.Lacalle, G.Diaz, D.Ferreno ‗Failure analysis of a lift gear shaft: application of the FITNET FFS procedure fatigue module.‘ Engineering fracture analysis 15 (2008) 970-980
[5] Xu X, Yu Z, Ding H. Failure analysis of a diesel engine gear shaft.
Eng Fail Anal 2006;13(8):1351-7
[6] Ping JJ,Guang M. Investigation on the failure of the gear shaft connected to extruder.Eng Fail Anal 2007.
[7] Truman CE, Brooker JD. Analysis of a shrink-fit failure on a gear hub/shaft assrmbly. Eng Fail Anal 2007;14(4):557-72.
[8] J.F Darlington, J.D. Booker ‗Development of design technique for the identification of fatigue initiating features.‘Engineering failure analysis 13 (2006) 1134-1152
[9] Nao-Aki Noda, Yasushi Takase and Keiji Monda ‗Stress concen-
tration factors for shoulder fillets in round and flat bars under vari-
ous loads.‘ Int. J. fatigue vol19 no.1, pp. 75-84,1997
[10] M.de Freitas, L.Reis, M.da Fonte, B.Li ‗Effect of steady torsion
on fatigue crack initiation and propagation under rotating bending: Multiaxial fatigue and mixed-mode cracking.‘ Engineering fracture mechanics xxx (2010) xxx-xxx
[11] Xu Xiaolei, Yu Zhiwei ‗Failure analysis of a locomotive turbo- charger main-shaft.‘ Engineering fracture analysis 16 (2009) 495-502 [12] Osman Asi ‗Fatigue failure of a rear axle shaft of an automobile.‘ Engineering failure analysis 13 (2006) 1293-1302
[13] Celalettin Karaagac, M.Evren Toygar ‗Fracture and fatigue analysis of an agitator shaft with a circumferential notch.‘ Engineer- ing fracture mechanics 73 (2006) 2034-2052
[14] Michele Zappalorto, Filippo Berto, Paolo Lazzarin ‗Practical expressions for the notch stress concentration factors of round bars under torsion.‘ International fatigue journal 33 (2011) 382-395
[15] ASM metals handbook. Properties and selection: irons, steel and
high-performance-alloys, vol. 1.Metals Park (OH): American society of metals; 1990
IJSER © 2011
http://www.ijser.org