Figure 1: Pareto Analysis of Disc Brake.
International Journal of Scientific & Engineering Research, Volume 5, Issue 7, July-2014 632
ISSN 2229-5518
Khomdram Herojit Singh1, Abhishek Kumar2, Rajender Kumar3
Abstract: Safety aspect in automobile engineering has been considered as a number one priority in development of new vehicle. In view of that data was collected from a servicing center of Thoubal District that the failure of disc brake is frequently happened now a day. After identifying mostly failure part (i.e. Disc Brake) through general observation, the reason of failure of disc brake is found through fish bone analysis and further evaluated by Pareto analysis to priorities and select the major reason of disc brake failure in this study. After finding the major reason it is again evaluated experimentally using Taguchi approach. Three control factors, back plates thickness, slots width and slots angle, for each higher and lower levels are identified and an orthogonal array layout of L8 are performed with the signal to noise (S/N) ratio. Analysis of variance (ANOVA) used to analyze the effect of selected process parameters along with their levels of influence. The optimized process parameter i.e. slot width of 3 mm is obtained and which lead to minimize the defects of disc pads.
Keywords: Taguchi approach, Fish Bone Analysis Pareto Analysis, ANOVA and S/N Ratio.
—————————— ——————————
Brake pads convert the kinetic energy of the vehicle to thermal energy by friction when the brakes are hydraulically applied; the caliper clamps or squeezes the two pads together into the spinning rotor to slow/stop the vehicle. Different types of brake pads mostly used in automotives are semi metallic brake pads, non-asbestos organic, low-metallic nao & ceramic brake pads.
Brakes are crucial system for stopping the vehicle during any moving conditions including braking while high speed, sharp cornering, traffic jam and downhill. All of those braking conditions give different temperature distribution and thermal stress. Performance of disc brake pads depend upon good material with better mechanical and thermal
————————————————
1Scholar M.E. Department, Manav Rachna International
University, Faridabad, India
2Associate Professor, Manav Rachna International University, Faridabad, India
3Assistant Professor, Manav Rachna International University, Faridabad, India
properties [9].
Present study analyzes the disc brake pads and suggests design improvement of pads. GLOBAL MOTORS SERVICING CENTER, Thoubal Athokpam Khunou cooperated and provided the one year warranties data of motor bikes. According to which the failure of disc brake is found commonly of
1. Bend of plate, 2. Oil leakage and 3. Damage of pad. Then through Pareto analysis damage of pad is found as
most occurring for finding design parameters influencing damage. Fishbone analysis is used before putting select parameters in Taguchi method to solve the problem and to optimized parameters to reduce damage of pad.
Cause and Effect Analysis was devised by Professor Kaoru
Ishikawa, a pioneer of quality management, in the 1960s. The technique was then published in his 1990 book, "Introduction to Quality Control." The diagrams created through Cause and Effect Analysis is known as Ishikawa Diagrams or Fishbone Diagrams [5]. Cause and Effect Analysis can be used in number of ways. Few of them are
• Quality control.
• Discover the root cause of a problem.
• Uncover bottlenecks in your processes.
• Identify where and why a process isn't working.
On the other hand a Pareto analysis technique is useful where possible courses of action many and is competing for attention. In this estimation of the benefit delivered by each action is alone, and then selection of number of the most effective actions to deliver total benefit reasonably close to the maximal possible. Pareto analysis is a creative way of
IJSER © 2014 http://www.ijser.org
International Journal of Scientific & Engineering Research, Volume 5, Issue 7, July-2014 633
ISSN 2229-5518
looking at causes of problems because it helps stimulate thinking and organize thoughts, but the restriction to use this is combining it with other analytical tools such as failure mode and effects analysis and fault tree analysis [6].
Taguchi methods [7] are statistically developed to improve the quality of manufactured goods, and also applied to other i.e. engineering, biotechnology, marketing and advertising. Researchers, Professional statisticians have welcomed the goals and improvements and development of designs for studying variation brought by Taguchi methods.
Taguchi method is based on specially three phase of design are 1. System design, 2. Parameter design and 3.Tolerance design. In the system design, a basic functional prototype design is produced depending on engineering knowledge but it may be far from optimum in terms of quality and cost. The parameter design is used to optimize and settings of the parameter values to improve quality characteristics and to identify the product parameter values at optimal condition. Finally, the tolerance design is required if the reduced variation obtained by the parameter design does not meet the required product performance (Tarng and Yang 1998) [10] around the optimal settings recommended by the parameter design. All machines or set-up are classified as engineering systems. Those systems can be classified in to two categories. They are: i) Static and ii) Dynamic. For improvement of parameters of disc brake components is a static system. In which parameter design is used to arrive at the optimum levels for types of parameters in order to minimize of the damage occurrence during braking. According to Taguchi, two major tools are employed to achieve any quality goal or any robust design (Phadke 1989) [11] are
1. Orthogonal arrays, which are used to study many parameters simultaneously.
2. Signal -to- Noise ratio (S/N ratio), which measures
quality.
Taguchi method includes the following steps:
1. Identify the quality characteristics and parameters to be evaluated.
2. Determine the number of levels for the parameters and possible interactions between the parameters.
6. Select the optimal levels of parameters.
confirmation experiment.
2 Literature review: Disc-style brakes use and development begin in England during 1890’s which is the first ever automobile disc brakes were patented. (F.W. Lanchester, 1890) [1]. It was patented at Birmingham factory in 1902, though it took another half century for the innovation to be widely adopted. The first designs resembling modern-style disc brakes began to appear in Britain in the late 1940 and early 1950. The first appeared on the low-volume Crosley Hotshot in 1949, although it had to be discontinued in 1950 due to design problems. Modern- style disc brakes offered much greater stopping performance than comparable drum brakes, including much greater resistance to "brake fade" which is caused by the overheating of brake components. Meanwhile, from the late 1990 to present, North American automotive industry accelerated the pace on brake research and application to catch up with Japanese quality performance. It has been more tailored towards American vehicle brake designs which often have more challenges to balance between brake performance and quality. Discs have now become the more common form in most passenger vehicles.
The literature review within the scope of research found to be very limited and the most related available investigations are reviewed. The recent investigation by N. Chand, S.A.R. Hashimi, S Lomash and A. Naik [2] was towards development of asbestos free brake pad. In this experiment focuses on physical of new material asbestos- free with wear properties and found that it is said that the asbestos-free friction lining material can be used for brake as well as other friction lining applications. Mikael Eriksson, Filip Bergman, Staffan Jacobson [3] has investigated the surface characterization of brake pads after running under silent and squealing conditions.
Rashid and Asim [4] worked on disc brakes evolution over time to be a reliable method of decelerating and stopping a vehicle. There have been different designs of disc brake systems for different applications. This review gives a detailed description of different geometries of the components and the materials used in a disc brake system. Manuel González, Raúl Díez and Esteban Cañibano (2004-
3. Select the appropriate orthogonal array and assign the
10-10)
[12]
studied on noises in braking system have been
parameters to the orthogonal array.
4. Conduct the experiments based on the arrangement of
the orthogonal array.
5. Analyze the experimental results using the signal-to- noise ratio and statistical analysis of variance.
classified according to its typology and frequency range.
On the “groan” noises, a few studies have been published in comparison with other noises better known, such as “judder” and “squeal”.
IJSER © 2014 http://www.ijser.org
International Journal of Scientific & Engineering Research, Volume 5, Issue 7, July-2014 634
ISSN 2229-5518
competing for attention. In essence, the problem-solver estimates the benefit delivered by each action, then selects a number of the most effective actions that deliver a total benefit reasonably close to the maximal possible one.
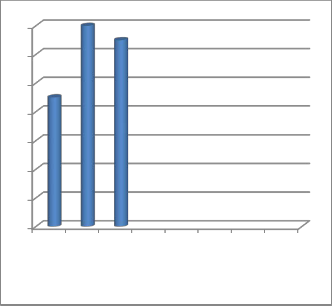
failure are bending of plate, leakage of oil and damage on pads. From the data collected, the score of bending of plate is 9, 14 for pads and 13 for oil leakage. Now we draw the Pareto diagram using the score obtained. From the diagram, we saw the defect on pad is highest among the problems. So if we solved this problem, then 80 % of the brake system will be solved.
Table 1: Analyzing the data’s collected
SL/NO. | Problem | Cause | Score |
1 | Disc Brake | Bend of plate | 9 |
2 | Disc Brake | Defects on pad | 14 |
3 | Disc Brake | Oil leakage | 13 |
Figure 1: Pareto Analysis of Disc Brake.
14
12
10
8
6
4
2
0
BendDoeffpeclattseoOnilplaedaksage
1. Identify the problem: Defects on the disc brake system are bending of plate, leakage of oil and damage on pads. Brake pad is the major problem among the problems and it put on the box at right site of the main line.
2. Work out the major factors involved: Major factors
involved in the brake pad are put on the upper and
lower box of main line. They are Young modulus of back plate, friction material chamfer, slot angle, back plate thickness, slot width and distance between slots.
3. Identify possible causes: Possible causes are shown
on the left and right sides of major factor lines as arrow indication. They are as the bones of the diagram.
4. Analyze your diagram: After analyzing the diagram, selecting back plate thickness, slot width and slot angle are the important cause that failure the brake pads. For designing the pads we need to know about the parameters involved in this.
Figure 2: Cause and effect analysis of Brake Pad.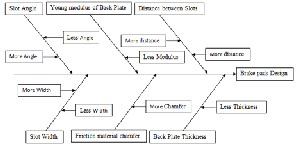
Table 2: Parameters and their levels for Taguchi method
IJSER © 2014 http://www.ijser.org
International Journal of Scientific & Engineering Research, Volume 5, Issue 7, July-2014 635
ISSN 2229-5518
3.3.1 Selection of Orthogonal Array: The present set of simulations is conducted as per the Taguchi L8 orthogonal design array to identify the “most significant” variables by ranking with respect to their relative impact on the occurrence. The L8 orthogonal array consists of six control parameters at two levels.
Table 3: Experimental L8 Array.
quality characteristics. Lower the better S/N ratios are computed for each of the 8 trials and sample calculations are also given as under.
Lower is better: S/NLB ratio = -10 log [(∑y2i)/n]
For the case of minimizing the performance characteristic, the following values of the S/N ratio is calculated as:![]()
For the case of maximizing the performance characteristic, the S/N ratio is calculated as:![]()
Where, n is the number of observation and yi are the different experimental values for various trials.
Table 5: Design defect values and S/N ratio against trial number
The average of the pads defects are computed for each trial
condition and it is shown in Table 7. A total number of eight trials are conducted and a set of data is collected as per the structure of CCD of experiments. Using the tool CCD, the percentage defects in experiment are calculated for each trial at two levels. The results of percentage defects in experiment are computed in table 4.
Table 4: Percentage defects in Experiments.
Experiment no. | Trials | |
Experiment no. | 1 | 2 |
1 | 31.21 | 27.32 |
2 | 19.33 | 13.80 |
3 | 18.53 | 13.76 |
4 | 8.00 | 7.00 |
5 | 22.37 | 20.90 |
6 | 17.00 | 11.78 |
7 | 12.10 | 8.54 |
8 | 4.87 | 4.12 |
The mean response, referring to the average value of the performance characteristics (the design defects and S/N ratios) for each parameter at different levels is given in Table 6. The Figure shows the graphical representation of the crimping leakage defects at different levels.
For Example: Trial No.1, Table Number 7;
Sum of defects = percentage defect at level 1 + percentage defect in level 2
= 31.21 + 27.32 = 58.32
Average percentage defect = Sum of defects/ 2 = 29.27
IJSER © 2014 http://www.ijser.org
International Journal of Scientific & Engineering Research, Volume 5, Issue 7, July-2014 636
ISSN 2229-5518
Average S/N ratio = -10log {(31.21 2 + 27.32 2) / 2} = - 26.90
Table 7 shows the design defect values and S/N ratios as shown below.
Defect at level 1, A1 = (Sum defects at level 1) / No. of observation = 19.27
Similarly, A2 = (20.90+ 11.78 + 8.54 + 4.12) / 4 = 11.3
S/N ratio at level at 1, A1 = (Sum of S/N ratio at level 1) / No. of observation = - 23.30
Similarly A2 = (- 26.71 – 23.30 – 20.40 – 13.09) / 4 = - 20.88
Table 6: Average value for design defects and S/N ratios at different levels
Figure 3 shows the graph of average values of pads defects on different levels. X-axis denotes the values of defects and Y-axis represent the different levels of parameters like A1 to F2 . From this graph, we can easily identify which parameters are high in defects and which are low.
Figure 4: shows the graphical representation of the average values of S/N ratio at different levels.
Similarly, in figure 4 also shows the average values of S/N ratio at different levels. X-axis denotes the values of S/N ratio and Y-axis denotes the different parameters at different levels.
Table 7: Sum of Squares for various parameters
Factors | Average value of design defects and S/N ratio at different levels | |||
Factors | Level 1 | Level 2 | ||
Factors | design Defect | S/N ratio | Design Defect | S/N ratio |
A | 19.27 | - 23.30 | 15.47 | - 20.88 |
B | 22.48 | - 25.35 | 8.36 | - 18.82 |
C | 17.9 | - 21.89 | 12.56 | - 22.28 |
Figure 3: Average value of pads Defect on different levels.
Sum of Squares of A, SSA = {No. of trial at A1 × (S/N ratio at
A1 + Average S/N ratio) 2} +
{No. of trial at A2 × (S/N ratio at A2 + Average S/N ratio) 2} =
{4 × (- 23.30 + 22.085) 2} + {4 × (- 20.88 + 22.085) 2} = 11.7
Similarly, the sums of squares for other parameters are calculated, as shown in Table 7.
software, found the following results.
IJSER © 2014 http://www.ijser.org
International Journal of Scientific & Engineering Research, Volume 5, Issue 7, July-2014 637
ISSN 2229-5518
S = 6.8041
R-sq = 89.49%, R-sq (adi) = 26.41%

Table 8: Result and percentage contribution of disc brake parameters
Diagnostics | |||||||||
Stand ard Orde r | Ru n Or der | Act ual Val ue (Y) | Fitt ed Val ue (YF ) | Resid ual | Standar dized Residual | Studen tized Residu al | Extern al Studen tized Residu al | Lever age | Cook 's Dista nce |
IJSER © 2014 http://www.ijser.org
International Journal of Scientific & Engineering Research, Volume 5, Issue 7, July-2014 638
ISSN 2229-5518
B | 85.28 | 1 | 85.28 | 82. 88 | Signific | 19.36 | ||
B | 85.28 | 1 | 85.28 | 82. 88 | ant | 19.36 | ||
A×B | 40.86 | 1 | 40.86 | 39. 71 | 9.28 | |||
C | 0.39 | 1 | 0.39 | 0.3 8 | 0 | |||
A×C | 2.25 | 1 | 2.25 | 2.1 9 | 0.51 | |||
B×C | 18.85 | 1 | 18.85 | 18. 32 | 4.28 | |||
A×B ×C | 16.59 | 1 | 16.59 | 16. 12 | 3.77 | |||
Erro r | 264.4 8 | 257 | 1.029 | |||||
Tota l | 440.4 | 264 |
It is clear from the ANOVA table that Slots Width has significant effect on the Disc Brake Pads. The optimum levels for this factor can be obtained by examining the level averages of the factor, as shown in Table 9.
Table 9: Affecting Parameter value at the different levels average
Parameter | Level Average | |
Parameter | 1 | 2 |
Slot width | 22.48 | 8.36 |
Various experiments are conducted on disc brake. ANOVA, along with interpretation method is used to obtain the percentage contribution of each parameter and optimum levels of each parameter are shown in Table 10.
Table10: Process parameter optimum level with optimal value
Parameter designati on | Process paramet er | Optimu m level | Optimu m value | Percentage Contributi on (%) |
D | Slot width | 2 | 3 | 19.36 |
From Table 9 (Affecting Parameters value at the different levels average) clearly shows that the most significant parameter affect both the mean and variation of the design of pad defects and also shows the optimal settings of each parameter to reduce the pad design defects and hence improves the quality of disc brake assembly at lowest cost. Before the application of Taguchi’s method, the parameters of the design process were more arbitrary and difficult to control and, of course, the product quality has instability problems. Taguchi’s method yielded optimized control factors, resulting in superior product quality and stability. From the analysis, it is found that the improvement in the design at the lowest possible cost can be achieved by Taguchi’s method of parameter design. It is also possible to identify the optimum levels of signal factors at which the noise factor’s effect on the response parameter is minimized. The optimized process parameters i.e. slots width of 3 mm are obtained by Taguchi methodology, which lead to minimize the failure of disc brake.
1 Gladwell, Vijay (1975): Applied Mechanics Reviews, Volume 47, Issues 10-12.
2 Lawrence (2000).The book of The Politics of Force: Media and the Construction of Police Brutality, University of California Pr A1Books.co.in
3 N. Chand, AR Hashmi, S. Lomash, A Naik,
―Development of Asbestos Free Brake Pad‖. Wear,
Vol. 85, pp. 13-16. 2004.
4 urn:nbn:se:liu:diva-94282.
5 Ishikawa, Kaoru (1976). Guide to Quality Control. Asian
Productivity Organization. ISBN 92-833-1036-5.
6 Nancy R. Tague (2004). "Seven Basic Quality Tools".
The Quality Toolbox. Milwaukee, Wisconsin: American
Society for Quality. p. 15. Retrieved 2010-02-05.
7 ROSA, Jorge Luiz; ROBIN, Alain; SILVA, M. B.;
BALDAN, Carlos Alberto; PERES, Mauro Pedro. Electrodeposition of copper on titanium wires: Taguchi experimental design approach. Journal of Materials Processing Technology, v. 209, p. 1181-1188, 2009. http://dx.doi.org/10.1016/j.jmatprotec.2008.03.021
8 Nouby M. Ghazaly “Study on Automotive Disc Brake Squeal Using Finite Element Analysis and Design of Experiments” PhD. Thesis, Department of Mechanical Engineering, Anna University, India (2011)
9 Henderson, Bob; Haynes, John H. (1994). "Disc Brakes".
The Haynes Automotive Brake Manual. Haynes North
America. pp. 1–20.
10 Solving the Optimal Force Distribution Problem in Multilegged Vehicles. By: Jeng-Shi Chen, Fan-Tien Cheng, Kai-Tarng Yang, Fan-Chu Kung, York-Yin Sun In: ICRA, 1998.
IJSER © 2014 http://www.ijser.org
International Journal of Scientific & Engineering Research, Volume 5, Issue 7, July-2014 639
ISSN 2229-5518
11 Quality Engineering Using Robust Design by Madhav
S. Phadke (1989, Hardcover)
ISBN-10: 0137451679 | ISBN-13: 9780137451678.
12 González, M., Díez, R., and Cañibano, E., "Comparative Analysis of Vented Brake Discs in Groan Noise Test on Dynamometer," SAE Technical Paper 2004-01-2789,
2004, doi:10.4271/2004-01-2789.
IJSER © 2014 http://www.ijser.org