International Journal of Scientific & Engineering Research, Volume 4, Issue 1, January-2013
ISSN 2229-5518
Optimization of Injection Moulding Process using
Taguchi and ANOVA
Rishi Pareek, Jaiprakash Bhamniya
Abstract— Now a day’s demand of plastics product is very high because of their better quality, design and appearance in comparison to other material product. The use of best operating parameters is needed to produce better quality of plastics product. This paper deals with the effects of parameters selection on injection moulding using Taguchi and ANOVA. The objective of this paper is to define suitable parameters in producing plastic product in term of strength. The paper describes the effect of temperature, pressure and cooling time. Plastic material polycarbonate was studied in this paper which commonly used in industries. The operating parameters have to be correct and can produce better product. There is changes occurs in product with change in parameters. Optimum parameter is related to the quality to produce product without defects such as short moulding, flashing and others.
Plastic product (Tea Plate) of polycarbonate plastic material is produced with De-Tech85 LNC5 injection moulding machine with different melt temperature, injection pressure, and cooling time. Tensile strength test of each workpiece has done with Tinius Olsen H10K-T UTM. Each plate has shown different strength, surface finish and some differences in other properties. By using Taguchi and ANOVA an optimum value or the best value of melting temperature, injection pressure and cooling time is obtained.
Index Terms— ANOVA, plastic injection moulding, polycarbonate, tensile strength, Taguchi
—————————— • ——————————
The injection Moulding is the most salient process for plastic parts mass production. Among the all plastic products about one third are made by injection moulding, and for the injection moulding process over half of the world’s polymer processing equipment is used [1]. Selecting the proper injection moulding process settings is crucial because during shaping the behavior of the polymeric material is highly influenced by the process parameters. Consequently, the process parameters govern the quality of the part produced. A substantial amount of research has been directed towards determining the process settings for the injection moulding process as well as the optimal location of the injection gate. There are many parameters which affect the properties of plastic product. Melting temperature, injec- tion pressure and cooling time are the main processing para- meters. There are different processing parameters for all dif- ferent materials.
Polycarbonate plastic consists of high impact-
resistance, very light with dimensional stability, stronger, opt-
ical clarity, and heat resistance and very good as an electrical
insulator. It is highly transparent and has better light trans-
mission characteristics than many kinds of glass. The property of polycarbonate to undergo large plastic deformations with- out cracking or breaking makes it different from most ther- moplastics. So, this thesis demonstrates a process for finding the Optimum parameters for producing polycarbonate plastic products with high strength.
————————————————
• Rishi Pareek is currently pursuing masters degree program in pro- duction engineering in Sri Balaji College of Engineering and Tech- nology, Rajasthan Technical University, Kota, India, PH-9602235226. E-mail: pareekrishi10@gmail.com.
• Jaiprakash Bhamniya, Asst. professor in Mechanical Deptt., Sri Balaji College of Engineering and Technology, India, PH- 9660024253. E- mail: jaibhamniya@gmail.com
In this project polycarbonate as a raw material is used to pro- duce tea plate with the help of De-Tech85 LNC5 injection moulding machine. Polycarbonate is processed by using dif- ferent combinations of processing parameters. Different com- binations of melt temperature, injection pressure and cooling time have taken and polycarbonate tea plate and test specimen is produced. After this, tensile test of the all specimen has done by using Tinius Olsen H10K-T universal testing machine.
2.1 Design of experiment
The design of experiment by means of Taguchi method is selected to identify the best set of parameters among the effective factors by cutting down a number of experiments. The major steps to complete an effective designed experiment are: [2]
A. Factors Selection
B. Selection of Orthogonal Array and Factor Levels
C. Conduct tests described by trials in orthogonal arrays
D. Analyze and Interpret results of the experimental trials
In injection moulding there are a number of possible factors that produce significant effects on tensile strength which are mould temperature, filling time, gate dimensions, injection pressure, melt temperature and cooling time [3]. In this expe- riment, the factors taken into considerations are only melt temperature, injection pressure and cooling time.
In an L16 (43) orthogonal array four levels of each factor are conducted where the selection of the array is because of its suitability for three factors with four Levels [2]. The L16 (43)
IJSER © 2013 http://www.ijser.org
International Journal of Scientific & Engineering Research, Volume 4, Issue 1, January-2013
ISSN 2229-5518
orthogonal array is shown in Table 1. The four different levels of melt temperature are chosen based on the thermal proper- ties of Polycarbonate. The levels and factors suggested are all shown in Table 2.
TABLE 1
L16 (43) ORTHOGONAL ARRAY
The tests are conducted on De-Tech85 LNC5 injection mould- ing machine according to the sets of control factors (processing parameters) obtained from trials of orthogonal array. The con- trol factors and levels of control factors according to ortho- gonal array are shown in Table 3.
TABLE 3
CONTROL FACTORS AND LEVELS FOR FACTOR A, B & C
TABLE 2
LEVELS AND SELECTED FACTORS
Factors | Levels | |||
Factors | 1 | 2 | 3 | 4 |
Melt temperature,A (oC) | 260 | 280 | 300 | 320 |
IJSER © 2013 http://www.ijser.org
International Journal of Scientific & Engineering Research, Volume 4, Issue 1, January-2013
ISSN 2229-5518
The tensile test of specimen produced during above tests is completed on Tinius Olsen H10K-T universal testing machine. The tensile strength of each test specimen produced according to trials of orthogonal array is shown in Table 4.
The tensile strength obtained is used to calculate the signal-to-noise (S/N) ratio to obtain the best setting of the pa- rameters arrangement. Signal to noise (S/N) ratio is calculated as shown in Table 4. The results obtained are analysed by us- ing analysis of variance (ANOVA). The significance of factors to affect strength is determined by calculating the percentage of contribution from this method.
TABLE 4
SUMMARY OF RESULTS OF TENSILE STRENGTH TESTS AND S/N VAL- UES
Strength of injection moulded product is necessary. Therefore, the higher the strength is better and S/N ratio is calculated for higher the better. For calculating S/N ratio for this case of higher the better Taguchi has outlined an equation. The equa- tion to obtain the values of S/N ratio is shown below [4]:
S / N = -10 log10 (MSD)
For larger is better![]()
![]()
MSD = 1 1
i
MSD = Mean Square Deviation y = Observations
n= No. of tests in a trial.
Since for trial no. 1 n = 1 and y = 61.40
Therefore,
S / N = -10 log
![]()
1 (
10 1
![]()
1 )
61.40 2
S / N = 35.7633
Similarly S/N ratio for other trials is obtained and show in
Table 4.
S/N ratio for Level 1 of melt temperature is obtained as fol-
lows:
Level 1 =
(35.7633 + 35.6923 + 35.6033 + 35.8618)
![]()
4
= 35.7309
Similarly the S/N ratio for each level of each factor is obtained and the results of S/N ratio for each level are shown in table 5.
TABLE 5
RESPONSE TABLE OF S/N RATIO FOR EACH LEVEL OF EACH FACTOR
Level | A | B | C |
1 | 35.7309 | 35.5875 | 35.6418 |
2 | 35.5157 | 35.5916 | 35.5708 |
3 | 35.5755 | 35.5911 | 35.5846 |
4 | 35.5982 | 35.6501 | 35.6232 |
Max. Difference | 0.2152 | 0.0626 | 0.071 |
From the S/N ratio response as shown in Table 5, the best combination of parameters can be identified by selecting the highest difference value from each factor. In this case, the most significant factor that has an effect on strength are melt tem-
IJSER © 2013 http://www.ijser.org
International Journal of Scientific & Engineering Research, Volume 4, Issue 1, January-2013
ISSN 2229-5518
perature (A) followed by cooling time (C) and injection pres- sure (B). Table 6 shows the summary of best combinations of parameters.
TABLE 6
f A = k A - 1
Where kA = No. of levels for factor A
BEST COMBINATION OF PARAMETERS
Therefore
f A = 4 - 1 = 3
Similarly,
f B = 3 and
f C = 3
For error,
f e =
f T - ( f A + f B + f C )
Therefore,
f e = 15 - (3 + 3 + 3) = 6
After this sum of squares for all factors is calculated and sum of square is calculated as shown below:
By using minitab16 software the main effects plot for S/N ra-
Total sum of squares
2
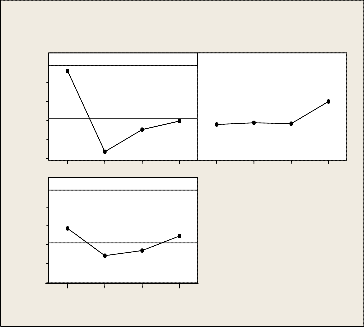
tios is obtained and shows in fig.1.
S = (T 2 + T 2
(T + T + .... + T )
![]()
+ .... + T 2 ) - S1 S2 S N
T S1 S 2 S N N
2
35.70
35.65
35.60
Melt Temp.
Data Means
Inj. Pr.
![]()
S = (61.42 + 60.92 + 60.32 +....+ 60.72 ) - (61.4+ 60.9+ 60.3+....60.7)
T 16
ST = 7.4625
35.55
For factor A
Cooling Time
S = ( I 1
+ .... + I 4 ) - S1 S 2 S N
35.70
260
280
300
320 90
110
130
150
( A ) 2
A
1
![]()
( A ) 2
4
(T + T
+ ... + T ) 2
35.65
35.60
(61.40+ 60.90+ 60.30+62.10)2
![]()
4
(59.20+59.80+59.90+59.80)2
![]()
4
35.55
35.50
7.5
15.0
22.5
30.0
(60.30+59.90+ 60.30+59.85)2
![]()
+
4
(59.80+60.20+60.28+ 60.70)2
![]()
+
4
Signal-to-noise: Larger is better
Fig. 1 Main Effect Plot for SN ratios
3.1 ANOVA calculation
First of all calculate the degree of freedom for all factors and degree of freedom is calculated as shown below:
Total degree of freedom
(61.40+ 60.90+...+60.70)2
![]()
-
16
S A = 4.8173
Similarly, for factor B
S (I B1 ) =(I B4 ) (TS1 + TS2 + ... + TS N )
2 2 2
fT = N - 1
![]()
B k k N
1 4
S B = 0.5369
Where N = no. of trials
For factor C
fT = 16 - 1 = 15
For factor A
IJSER © 2013 http://www.ijser.org
International Journal of Scientific & Engineering Research, Volume 4, Issue 1, January-2013
ISSN 2229-5518
S = ( I 1
) + ... +
I 4
) - S1 S2
SN Similarlly for factor B, F = VB
( C ) 2
C k
1
( C )2
k
4
(T + T
+ ... + T ) 2
N
![]()
B
e
0.1789
SC = 0.6374
FB =
![]()
0.24515
= 0.72975
For error
S e = ST - (S A + S B + SC )
S e = 1.4709
For factor C, FC
0.2124
![]()
= VC
Ve
Then the values of variance for all factors are calculated as
FC =
![]()
0.24515
shown below:
For factor A
At the last the percentage contribution P (%) for all the factors are calculated as shown below:
V = S A
For factor A, P![]()
= ( S A ) x 100
![]()
A A S
A T
4.8173
![]()
V = 4.8173 = 1.6057
A 3
PA = (
![]()
7.4625
![]()
P
) x100 = 64.5534%
S B
![]()
Similarly for factor B, V = S B
B
For factor B,
B = (
ST
) x 100
![]()
V = 0.5369 = 0.1789
B 3
PB = (
0.5369
![]()
7.4625
) x100 = 7.1946%
SC
![]()
For factor C, V = SC
C
For factor C, PC![]()
= ( ) x 100
ST
![]()
V = 0.6374 = 0.2124
C 3
![]()
P = ( 0.6374 )
C 7.4625
x100
= 8.5413%
TABLE 7
![]()
For variance error, V = S e
e
ANALYSIS OF VARIANCE FOR TENSILE STRENGTH
![]()
V = 1.4709 = 0.24515
e 6
After this the F-Ratio for all factors are calculated as shown below:![]()
For factor A, F = VA A V
FA =
1.6057
![]()
0.24515
e
= 6.54
In Table 7, f = Degree of freedom, S= Sum of squares, V = Val- ues of variance, F = F- Ratio, p (%) = Percentage contribution.
IJSER © 2013 http://www.ijser.org
International Journal of Scientific & Engineering Research, Volume 4, Issue 1, January-2013
ISSN 2229-5518
The percentage of contributions p (%) for all factors is shown in Table 7. This results shows that the melt temperature con- tribute the most by 64.55% and this is followed by cooling time by 08.54% and injection pressure 07.19% . This proves that melt temperature is the most significant parameter contri- bute to improve tensile strength in the process while cooling time and injection pressure only have small effects towards the tensile strength.
In injection moulding process of Polycarbonate, for tensile strength melt temperature is found to be the most significant factor which contributes 64.55% followed by cooling time by
08.54% and injection pressure 07.19%. The results show that, for polycarbonate the best combination of processing parame- ters in terms of tensile strength are 260 oC melting tempera- ture, 150 bar injection pressure and 7.5 seconds cooling time. The influence of all factors has been identified and believed can be a key factor in helping mould designers in determining optimum process conditions injection moulding parameters.
I would like to express my gratitude to my guide Mr. Jaipra- kash Bhamniya (Asst. Prof. Mechanical Deptt., SBCET) for his wisdom, endurance and encouragement during his supervi- sion period to finish the project and dissertation for complet- ing my M.Tech (Production Engineering) thesis. I also thanks to Mr. Ashok Choudhary (H.O.D, Mechanical Deptt., SBCET) and Mr. Deepak Agarwal (Asst. Prof. Mechanical Deptt., SBCET) for his advice and suggestion.
I acknowledge my sincere indebtedness and gratitude
to my parents for their love, dream and sacrifice throughout my life. And thanks to my all friends for encouraging me in each situation during dissertation.
Recommendations for future research in the injection mould- ing would include investigating best combination of parame- ters for tensile strength of other plastic materials. Optimum parameters for tensile strength of polycarbonate are obtained in this paper, in future optimum parameters for hardness and good surface finish of different materials may also obtain. We used Taguchi method for obtaining the optimum processing parameters combination for a single quality characteristic only that is tensile strength. Since, the Taguchi method does not give any consideration to the relationship between multiple quality characteristics and processing parameters [4]. There- fore Grey relational analysis may be use to obtain the opti- mum processing parameters combinations for multiple quality characteristics in the mean time.
[1] Tim A. Osswald, Lih-Sheng Turng, Paul J. Gramann “Injection Moulding
Handbook”, ISBN 978-3-446-40781-2, Hanser Publisher, Munich (2002).
[2] Phillips.J.Ross, “Taguchi Techniques for Quality Engineering”, Mc Graw Hill
Publication, ISBN 0070539588, (1996).
[3] M.F. Ghazali, Z. Shayfull, N.A. Shuaib, S.M. Nasir, M. Mat Salleh, “Injection Mould Analysis in Reducing Warpage of Nylon PA66 Side Arms Using Ta- guchi Method and ANOVA”, International Journal of Basic & Applied Sciences IJBAS-IJENS Vol:11 No: 01,(2011).
[4] P.K. Bharti, “Recent Methods for Optimization of Plastic Injection Moulding
Process –A Retrospective and Literature Review”, International Journal of
Engineering Science and Technology Vol. 2(9), 2010.
IJSER © 2013 http://www.ijser.org