International Journal of Scientific & Engineering Research, Volume 5, Issue 7, July-2014 1083
ISSN 2229-5518
Optimization and Analysis of a Hybrid system in Tromso, Norway by using HOMER Software Gelareh Hajian, Mohammad Saeed Ahadi, Mohamadreza eskandari
KW h/day primary remote load with 7.8 kW peak load in order to obtain the most feasible configuration of a hybrid renewable energy system. Meteorological data about solar radiation throughout a year and wind speed in the Tromso city are taken from RETScreen software.
—————————— ——————————
ince solar, wind and tidal energies mainly depend upon statistical parameters with respect to changing climate and environment, focus on hybrid generation system design increases the availability of the power generation system. The hybrid system also reduces the dependence on one environ- ment parameter thus providing the consumer with reliable and cheap electricity [1]. For example, the wind and solar en- ergy which are individually less reliable could have a higher reliability when used together. [2] In the past, the hybrid sys- tems have been considered as preferred for remote systems like radio telecommunication and satellite earth stations. [3, 5,
10] These days, in remote areas, where grid connection is al- most not possible, renewable energy generation system can be a reliable and optimized source of energy for households and other usages because these two sources of energies are able to compensate each other minima. The combination of solar and wind should be especially favorable for locations at high lati- tudes such as Nordic countries with a very uneven distribu- tion of solar radiation during the year.[3] Therefore, it is better to use hybrid systems than stand-alone PV systems in Nordic countries, because of the uneven distribution of the solar radi- ation causing high costs in PV-alone system, if the system needs to be sized for a constant load throughout the year. While, the average wind power at the most locations in Nordic countries is higher during the seasons with low irradiation,
hybrid system can compensate the low irradiation of solar during these periods.
The hybrid system consists of renewable energy sources: solar and wind energy, an electrical load, and other system such as solar array, wind turbines, battery and converter. For this hybrid system, the meteorological data of Solar Radiation and monthly wind speed are taken for Tromso which is locat- ed in Latitude 69.7° North and Longitude 18.9° East.
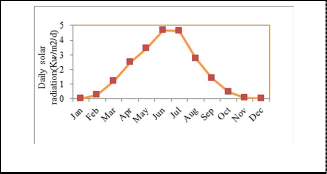
In this study, monthly average global radiation data has been taken from RETScreen software which is used NASA (National Aeronautics and Space Administration) data. Trom- so has an average annual daily solar radiation 1.79 Kw/m²/d.
————————————————
Fig. 1. Solar radiation data throughout the year.
Wind speed also varies seasonally. Average wind speed of the mentioned area is 4.3 m/s. These data were collected from
IJSER © 2014 http://www.ijser.org
International Journal of Scientific & Engineering Research, Volume 5, Issue 7, July-2014 1084
ISSN 2229-5518
RETScreen Software.
According to below graph, Tromso has an appropriate po-
tential for using wind and solar power together. As can be
seen, during the seasons in which the solar irradiance is low,
the power of wind is high, as well as in seasons with better
solar radiation; the wind power has less speed. Therefore, in-
stalling hybrid system can be more effective.
In this report a PV-Wind-Hybrid system has been studied in Tromso, Norway. The aim was to analysis of a several hybrid energy system models for optimization. The analysis of the hy- brid systems are modeling in the HOMER software which was utilized as the assessment tool with modeling performed with hourly load data. In this study, a discussion of the cost optimi- zation analysis of a hybrid energy generation system is per- formed. Here, HOMER is used to examine the most cost effec- tive configurations among a set of systems for electricity re- quirement of 53 KWh/day primary load.
The costs of PV arrays are based on their technology. The PV
array which is considered in this work, has the size from 1 to
35Kw. HOMER will simulate the system within the given range
and will give the output with the optimal size of PV. The cost of
installing a solar system is considered around $2 per watt, therefore, 1 kW PV array cost was assumed to be $2000 and the replacement cost was considered 1500$. Operating and Mainte- nance costs are not high for a PV system.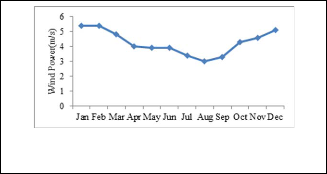
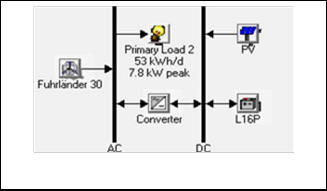
Fig. 4. Complete hybrid energy renewable system.
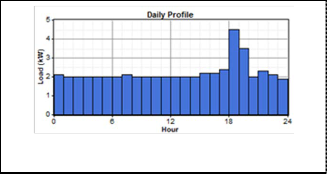
Fig. 2. W ind Speed data throughout the year.
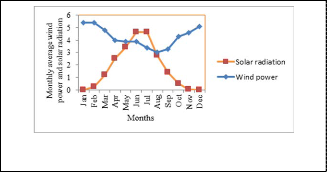
Fig. 5. Daily load profile
Fig. 3. Monthly average wind power at 10 m height and monthly average horizontal solar radiation in Tromso.
The hybrid generation system consists of an electrical load, renewable energy sources and other system components such as PV, wind turbines, battery and converter. Fig.4 shows the hybrid energy renewable system in HOMER software.
The system size has been limited to 35 Kw PV power and 30 kW wind turbine power. A load which is considered as a re- mote load is a 53 Kwh/d with the peak of 7.8 kW. Fig 5 shows the load profile on a day.
The hybrid system is designed to meet the electrical de- mands of this load.
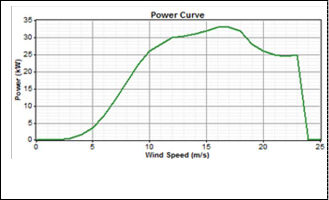
The technical parameters of selected wind turbine (Fuhr- lander 30) are stated in table1. The capital cost and replacement cost are assumed 68000$ and 20000$ respectively. (The prices of capital and replacement cost for Fuhrlander 30 turbine were asked from Fuhrlander Company.) Some parameters which are considered in HOMER for wind source are:
1)Weibull k Value: The Weibull k value, or Weibull shape factor, is a parameter that reflects the breadth of a distribution of wind speeds. Lower k values correspond to broader wind speed distributions. So a very gusty location may have a Weibull k value as low as 1.5 or so, whereas a location charac- terized by very steady winds (like tropical trade wind environ- ments) may have a k value as high as 3 or 4. So The Weibull k value is taken 1.6 in this report.
2) Autocorrelation Factors: According to the HOMER soft- wareThe complexity of local topography has a significant effect on the autocorrelation factor. Areas surrounded by a variety of different types of topography tend to have low (0.70 - 0.80) au- tocorrelation factors. The topography around Tromsø is ex- tremely varied. High mountains mean that thick snow can be
IJSER © 2014 http://www.ijser.org
International Journal of Scientific & Engineering Research, Volume 5, Issue 7, July-2014 1085
ISSN 2229-5518
falling on one side, while stars glitter in the clear, biting cold on the other. It means that in the Tromsø region, you can find very different weather conditions by driving relatively short distanc- es. So the autocorrelation factor is taken 0.75.
3) The diurnal pattern strength: is a number between 0 and 1 that reflects how strongly the wind speed tends to depend on the time of day. Higher value s indicates that there is strong dependence on the time of the day. In this study, 0.3 is used.
4) Hour of Peak Wind speed: The hour of peak wind speed is the hour of the day that tends to be the windiest, on average (Typical Range: 14-16) 15 is used in this study.![]()
TABLE I SPECIFICATIONS OF WIND TURBINE
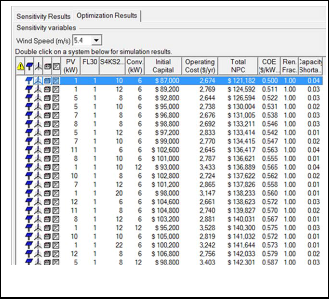
sent Cost). The combination of a PV array (1KW), a wind tur- bine (30 KW), and 10 Surrehe 4ks25p batteries is economically organized with the minimum COE 0.5 $ /Kwh and a mini- mum NPC of $121.182, with 4% annual energy shortage. (This optimized configuration is an appropriate in situation in which the wind speed is considered as 5.4).
Fig. 7. HOMER simulation results
After HOMER's calculations are complete, the optimal sys- tems are shown as winning sizes. Gold-colored values ap- peared in the optimal system for at least one sensitive case. In this study, wind speed is considered as sensitive parameter. Therefore, each of these winning sizes matches with the sensi- tivity variables of wind speed. (Values of wind speed as a sen- sitive parameters are considered: 3, 3.4, 4, 4.3, 5, 5.1, 5.4).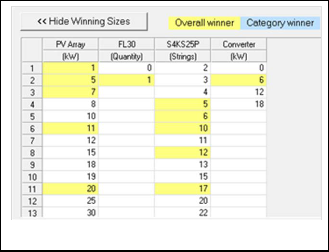
Fig. 6. Power curve of Fuhrlander 30Kw wind turbine.
Simulation results which include each component size, each system configuration’s costs and total net present cost of the first some optimal combinations are shown in Fig 7. Lots of simulations have been done to find out the most optimized and cost effective configuration of the hybrid system. In simu- lation Results by clicking on each of the displayed solution we can access a comprehensive set of data providing high level of detail on each system component. In addition it is possible to display many economical information essential to run a thor- ough business case. Above list presents of different configura- tions with respect respective of cost/ KWh and NPC (Net Pre-
Fig. 8. W inning Sizes results
For example, HOMER winning sizes for the wind speed is
5.4 (m/s) are: PV Array (1 Kw), wind turbine (30 KW), and 10
Surrehe 4ks25p batteries and NPC $121.182, while the winning
IJSER © 2014 http://www.ijser.org
International Journal of Scientific & Engineering Research, Volume 5, Issue 7, July-2014 1086
ISSN 2229-5518
sizes for situation in which wind speed is 4 are: PV Array (11
Kw), wind turbine (30 KW), and 20 Surrehe 4ks25p batteries. In
addition, the winning sizes for an annual average wind speed
4.3 are PV Array (7Kw), wind turbine (30 KW), and 20 Surrehe
4ks25p batteries. In Fig 9 all the sensitivity results by consider-
ing the various wind speed are shown according to having the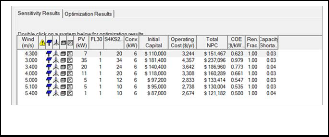
minimum NPC.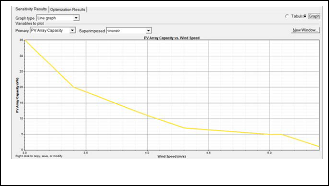
Fig. 9. W inning Sizes according to sensitivity variables.
Fig. 10. the relation between PV array and wind speed.
As can be seen in this graph, the amount of PV array is in- creasing by the decreases in the rate of wind speed. Therefore, the choice of appropriate configuration is a complex trade-off among financial, renewable, technical and design requirements. For example, a hybrid system which is selected to meet the load demands in this study is considered in worse condition in which the wind speed has its minimum speed during the year:3m/s and the winning sizes for this condition are PV Array (35Kw), wind turbine (30 KW), and 34 Surrehe 4ks25p batteries with COE 0.979$/kw.
These parameters which are calculated by HOMER software as a winning size are the best option economically for this study in which the wind speed is the lowest (3m/s).
This paper presented a proposed hybrid power system for a remote load site where the grid extension is not feasible, in Tromso, Norway. System sizing and designed system configu- ration is presented. A particular aim of this study was to show that at a site in Nordic countries where solar and wind re- sources are available has the potential to meet the electricity load demands, while other resources like oil, coal and so on are not used to produce energy. It was shown that the obtained optimal configuration of the hybrid wind-PV-battery system could overcome the effect of the climatic change on the reli- able supply of the load.
[1] Jong Hwan Lim, “Optimal Combination and Sizing of a New and Renewa- ble Hybrid Generation System,” International Journal of Future Generation Communication and Networking, 2012; 5(2), pp. 43 – 60.
[2] Castle JA, Kallis JM, Marshall NA and Moite SM, “Analysis of Merit of Hy- brid Wind/Photovoltaic Concept for Stand-Alone,” Systems Proceedings of
15th IEEE PV specialists, 1981.
[3] Wei Zhou, Hongxing Yang, Zhaohong Fang, “Banery Behavior Prediction and Battery Working States Analysis af A Hybrid Solar–Wind Power Genera- tion System,” Renewable Energy 2008; 33(6), pp. 1413 – 1423.
[4] Frank Fiedler, Victor Pazmino, Irati Berruezo, Victor Maison, “Pv-Wind Hybrid Systems for Swedish Locations,” Solar Energy Research Center (SERC), Högskolan Dalarna, S-78188 Borlänge.
[5] S. Diaf, M. Belhamel, M. Haddadi, A. Louche, “Technical and Economic Assessment of Hybrid Photovoltaic/Wind System with Battery Storage in Corsica Island,” Energy Policy 2008; 36(2), pp. 743 – 754.
[6] Hongxing Yang, Zhou Wei, Lou Chengzhi, “Optimal Design and Techno- Economic Analysis of Hybrid Solar– Wind Power Generation System,” Ap- plied Energy 2009; 86(2), pp. 163 – 169.
[7] McGowan, J. G., Manwell, J. F., Avelar, C., and Warner, C. L., “Hybrid Wind/PV/Diesel Hybrid Power Systems Modeling And South American Applications,” Renewable Energy 1996; 9(1-4), pp. 836 – 847.
[8] Website: http://www.nordnorge.com/en
[9] HOMER V2.68 beta, “National Renewable Energy Laboratory (NREL),” 617
Cole Boulevard, Golden, CO 80401-3393, URL: http://www.nrel.gov/homer. [10] , “Renewable and Sustainable Energy Reviews,” 13(8), pp. 2096 – 2103.
[11] HOMER Software Training Guide for Renewable Energy Base Station Design
Areef Kassam – Field Implementation Manager.
[12] Sthitaprajna Rath, S.M Ali, Md. Nadeem Iqbal, “Strategic Approach of Hy- brid Solar-Wind Power for Remote Telecommunication Sites in INDIA,” In- ternational Journal of Scientific & Engineering Research 2012; 3(6), 1 ISSN 2229-
5518.
IJSER © 2014 http://www.ijser.org