International Journal of Scientific & Engineering Research Volume 2, Issue 11, November-2011 1
ISSN 2229-5518
Optimal Wavelet for Bangla Vowel Synthesis
Shahina Haque, Tomio Takara
Index Terms— Bangla vowels, Wavelet Transform, Daubechies, Coiflet, Symmlet, Biorthogonal, Reverse Biorthogonal
—————————— ——————————
ignal processing and filtering is, in its modest way, is an attempt to find a better form for a set of information, either by reshaping it or filtering out selected parts that are some-
times labeled as noise. In other words, signal processing al-
lows us to uncover a form of the signal that is closer to the true signal. Speech analysis systems generally carry out analysis which is usually obtained via time-frequency representations such as Short Time Fourier Transforms (STFTs) or Linear Pre- dictive Coding (LPC) techniques. In some respects, these me- thods may not be suitable for representing speech; as they as- sume signal stationarity within a given time frame and may therefore lack the ability to analyze localized events accurate- ly. Furthermore, the LPC approach assumes a particular linear (all-pole) model of speech production which strictly speaking is not the case. The main disadvantage of a Fourier expansion however, is that it has only frequency resolution and no time resolution [1]. This means that although all the frequencies present in a signal can be determined, the presence of distur- bances in time is not known.
To overcome this problem, several solutions have been de-
veloped to represent a signal in the time and frequency do- mains at the same time. The WT is one of the most recent solu- tions to overcome the shortcomings of the FT. In the wavelet analysis, the use of a fully scalable modulated window solves the signal-cutting problem. The window is shifted along the signal and for every position the spectrum is calculated. This process is then repeated many times with a slightly shorter or longer window for every new cycle. In the end, the result will be a collection of time-frequency representations of the signal, all with different resolutions. WT overcomes some of .these limitations; it can provide a constant-Q analysis of a given signal by projection onto a set of basis functions that are scale variant with frequency. Each wavelet is a shifted scaled ver- sion of an original or mother wavelet. These families are usually orthogonal to one another, important since this yields computational efficiency and ease of numerical implementa-
————————————————
S.H. Author is with the Department of Electronics and Telecommuniaction
Engineering, Daffodil International University, Dhaka, Bangladesh.
T.T. Author is with Faculty of Information Engineering, University of the
Ryukyus, Okinawa, Japan.
tion. Other factors influencing the choice of WT over conven- tional methods include their ability to capture localized fea- tures. Also, developments aimed at generalization such as the Bat-Basis Paradigm of Coifinan and Wickerhauser [2] make for more flexible and useful representations. The indications are that the WT and its variants are useful in speech parameter extraction due to their good feature localization but further- more because more accurate (non-linear) speech production models can be assumed [3]. The adaptive nature of some exist- ing techniques results in a reduction of error due to speaker variation. Similarly, the continuous WT (CWT) is defined as the sum over all time of the signal multiplied by scaled, shifted versions of the wavelet function.
In different languages, WT has been used for analyzing
various speech corpora e.g. speech analysis, pitch detection, recognition, speech synthesis, speech segmentation [4,5,6,7,8] etc. But as far as it is known, no work has been reported yet on Bangla phoneme analysis and synthesis using WT.
Therefore, we consider the possibility of providing WT
based complete Bangla speech processing in the most compu-
tationally efficient manner. As an initial stage of our work, we selected the seven Bangla vowel phonemes. We analyzed and synthesized the Bangla vowels using the widely used Daube- chies family of wavelets with WT.
The organization of the paper is as follows. In section 2,
theory of WT, wavelets, speech waveform decomposition and reconstruction using WT is discussed. Section 3 discusses about the procurement of the experimental data. Section 4 dis- cusses about application of the WT for Bangla phoneme analy- sis and synthesis. Then section 5 discusses about the result and performance evaluation of our experiment. Section 6 provides the conclusion and scope for future work.
The fundamental idea behind wavelets is to analyse according to scale. The wavelet analysis procedure is to adopt a wavelet prototype function called an analysing wavelet or mother wavelet. Any signal can then be represented by translated and scaled versions of the mother wavelet. Wavelet analysis is ca- pable of revealing aspects of data that other signal analysis techniques such as Fourier analysis miss aspects like trends, breakdown points, discontinuities in higher derivatives, and
IJSER © 2011
International Journal of Scientific & Engineering Research Volume 2, Issue 11, November-2011 2
ISSN 2229-5518
self-similarity. Furthermore, because it affords a different view of data than those presented by traditional techniques, it can compress or de-noise a signal without appreciable degrada- tion [4].
WT can be viewed as transforming the signal from the time domain to the wavelet domain. This new domain contains more complicated basis functions called wavelets, mother wavelets or analyzing wavelets. A wavelet prototype function at a scale s and a spatial displacement u is defined by Eq.1.
![]() (1)
(1)
The conti- nuous wavelet
transform (CWT) is given mathematically by Eq. 2.
![]() (2)
(2)
which is the sum over all time of the signal multiplied by scaled and shifted versions of the wavelet function ψ. The re- sults of the CWT are many wavelet coefficients C, which are a function of scale and position. Multiplying each coefficient by the appropriately scaled and shifted wavelet yields the consti- tuent wavelets of the original signal.
The basis functions in wavelet analysis are localized in fre-
quency making mathematical tools such as power spectra
(power in a frequency interval) useful at picking out frequen- cies and calculating power distributions. Individual wavelet functions are localized in space. This localization feature, along with wavelets localization of frequency, makes many functions and operators using wavelets “sparse” when trans- formed into the wavelet domain. This sparseness, in turn re- sults in a number of useful applications such as data compres- sion, detecting features in images and de-noising signals.
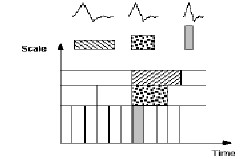
Time-Frequency Resolution
A major drawback of Fourier analysis is that in transforming to the frequency domain, the time domain information is lost [9]. Fig.1 shows a time-scale view for wavelet analysis. A low- scale compressed wavelet with rapidly changing details cor- responds to a high frequency. A high-scale stretched wavelet that is slowly changing has a low frequency.
Examples of Wavelets
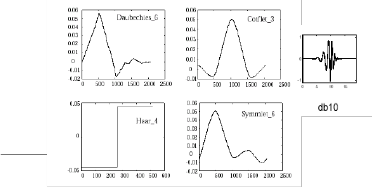
Fig.2 illustrates four different types of wavelet basis functions. The different families make trade-offs between how compactly the basis functions are localized in space and how smooth they are. Within each family of wavelets (such as the Daubechies family) are wavelet subclasses distinguished by the number of filter coefficients and the level of iteration. The construction of a minimum phase Daubechies wavelet is described in detail in [10,11] by Vetterli and Daubechies. To construct a minimum phase wavelet, we need a low pass filter with the frequency response Ho(z) and a high pass filter with the frequency re- sponse H1(z). These two functions should satisfy the following condition as given by Eq.3 [10].
H1(z) = H0(z) (3)
The Discrete Wavelet Transform ([12,13,14,15])
![]()
The Discrete Wavelet Transform (DWT) involves choosing scales and positions based on powers of two, so called dyadic scales and positions. The mother wavelet is rescaled or dilated, by powers of two and translated by integers. Specifically, a function f(t)є L2 (R) (defines space of square integrable func- tions) can be represented as
The function ψ(t) is known as the mother wavelet, while φ(t) is known as the scaling function. The set of functions where Z is the set of integers, is an orthonormal basis for L2(R). The The numbers a(L, k) are known as the approximation coefficients at scale L, while d(j,k) are known as the detail coefficients at scale j.![]()
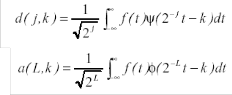
The approximation and detail coefficients can be expressed as given by Eq. 4 and Eq. 5:
(4) (5)
Multilevel Decomposition
The decomposition process can be iterated, with successsive approximations being decomposed in turn, so that one signal is broken down into many lower resolution components.
Figure 1: Wavelet Resolution
IJSER © 2
http://www.ij
International Journal of Scientific & Engineering Research Volume 2, Issue 11, November-2011 3
ISSN 2229-5518
Figure 2: Different wavelet families [7]
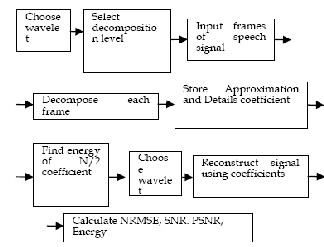
Figure 3: Design Flow of Wavelet Based Speech Analysis-Synthesis Pro- cedure
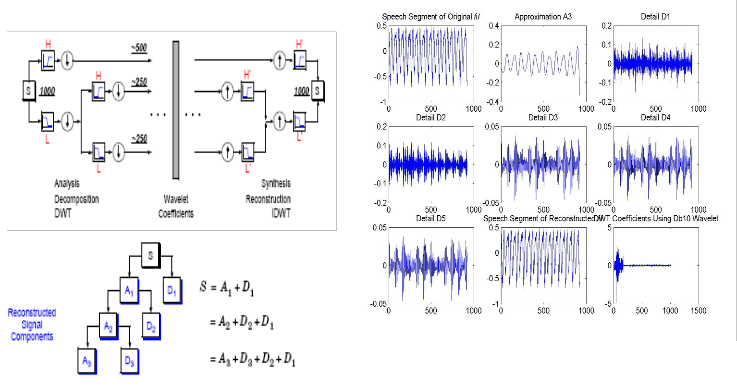
Figure 4: Process of decomposing and reconstructing the speech signal
.This is called the wavelet decomposition tree. The wavelet decomposition of the signal s analyzed at level j has the fol- lowing structure [cAj, cDj, ...,cD1]. Looking at a signals wave- let decomposition tree can reveal valuable information. Since the analysis process is iterative, in theory it can be continued indefinitely. In reality, the decomposition can only proceed until the vector consists of a single sample. Normally, howev- er there is little or no advantage gained in decomposing a sig-
nal beyond a certain level. The selection of the optimal decomposition level in the hierarchy depends on the nature of the signal being analyzed or some other suitable criterion, such as the low-pass filter cut-off.
Signal Reconstruction
The original signal can be reconstructed or synthesized using the inverse discrete wavelet transform (IDWT). The synthesis starts with the approximation and detail coefficients cAj and cDj, and then reconstructs cAj-1 by up sampling and filtering with the reconstruction filters. The reconstruction filters are designed in such a way to cancel out the effects of aliasing introduced in the wavelet decomposition phase. The recon- struction filters together with the low and high pass decompo- sition filters, forms a system known as quadrature mirror fil- ters (QMF). For a multilevel analysis, the reconstruction process can itself be iterated producing successive approxima- tions at finer resolutions and finally synthesizing the original signal.
The aim of this section is to acquire the speech samples. The
Figure 5: Waveform of Original, Reconstructed, Approximations, Details (at Different Scales) and energy of N/2 coefficient for vowel /i/ using db10 wavelet
Bangla oral vowels ![]() at a normal speaking rate three times in a quiet room by three male native Bangla speakers (age around 27 years) in a DAT tape at a sampling rate of 48 kHz and 16 bit value. The best one of these three speakers voice and the best speech sample was chosen for our work. These digitized speech sound are then downsampled to 10 kHz and then normalized for the purpose of analysis.
at a normal speaking rate three times in a quiet room by three male native Bangla speakers (age around 27 years) in a DAT tape at a sampling rate of 48 kHz and 16 bit value. The best one of these three speakers voice and the best speech sample was chosen for our work. These digitized speech sound are then downsampled to 10 kHz and then normalized for the purpose of analysis.
IJSER © 2011
International Journal of Scientific & Engineering Research Volume 2, Issue 11, November-2011 4
ISSN 2229-5518
A suitable criterion used by [4] for selecting optimal wavelets, is the energy retained in the first N/2 (where N=Total no. of
data points in a frame) coefficients. Based on this criterion alone, the Daubechies10 (db10) wavelet preserves perceptual information better than all the other wavelets tested. The db10 wavelet also provides the lowest NRMSE. However its value is also affected by the scarcity of the wavelet domain representa- tion of the signal and also the mother function used [4]. So we adopted db10 wavelet as well as other wavelets as mentioned previously for analyzing and synthesizing Bangla vowels. We examined which wavelet among the selected wavelets per- forms best for Bangla vowel analysis and synthesis. Fig.3 illu- strates the different processes involved in analyzing and syn- thesizing the selected Bangla speech signals using wavelet transform.
Choosing the right decomposition level in the DWT is im- portant for many reasons. For processing speech signals no advantage is gained in going beyond scale 5. At higher levels, the approximation data is not as significant and hence does a poor job in approximating the input signal. Therefore if all the approximation data is to be kept, the ideal decomposi- tion for this signal is level 5. The multi-level decomposition implements an analysis-synthesis process which breaks up a signal S, to obtain the wavelet coefficients (A1, D1 etc.), and reassembling the signal from the coefficients. If needed, we may also modify the wavelet coefficients before performing the reconstruction step for any purpose. Fig.4 shows the process of decomposing and reconstructing the waveforms using high pass and low pass filters. First we choose a wavelet among the selected wavelets as the analyzing wavelet and choose 5 as the decomposition level. Then we decomposed the speech signal using WT and calculated the approximation and the details coefficients. Then we stored the coefficients. Again we reconstructed the speech signal using the stored coeffi- cients. Applying the steps as given by Fig.3 and Fig.4, we get the waveforms at different scales as shown in Fig.5 for vowel
/i/ using db10 wavelet. It can be seen from Fig.5 that the recon- structed waveform is almost similar to the original waveform. This process is repeated for other selected wavelet.
In this section we discuss the performance of the synthesized signal by four parameters. We calculate the retained energy in the first few coefficients of the WT and then the NRMSE be- tween the original and the reconstructed vowel at decomposi- tion level 5.
The normalized root mean square error is given by
where x(n) is the speech signal, r(n) is the reconstructed signal, and µx(n) is the mean of the speech signal.
2. Signal to Noise Ratio (SNR):
This value gives the quality of reconstructed signal. Higher the
value, the better. It is given by:
where σx2 is the mean square of the speech signal and σe2 is the mean square difference between the original and the recon- structed signals.
![]()
Peak signal to noise ratio is given by
In the above equation, N is the length of the reconstructed sig- nal, X is the maximum absolute square value of the signal x and ||x-r|| is the energy of the difference between the origi- nal and reconstructed signals.
The retained energy in the first N/2 wavelet coefficient is given by the following equation![]()
where ||x(n)|| is the norm of the original signal and
||r(n)|| is the norm of the reconstructed signal. For one-
dimensional orthogonal wavelets the retained energy is equal
to the L2-norm recovery performance.
A suitable criterion for measuring the performance of the
wavelet is related to the amount of energy a wavelet basis
function can concentrate into the level 1-approximation coeffi-
cients. The speech signal was divided into frames of size 1024
samples and then analyzed using the selected Daubechies,
Coiflet, Symmlet, Biorthogonal and Reverse Biorthogonal
IJSER
http://www
International Journal of Scientific & Engineering Research Volume 2, Issue 11, November-2011 5
ISSN 2229-5518
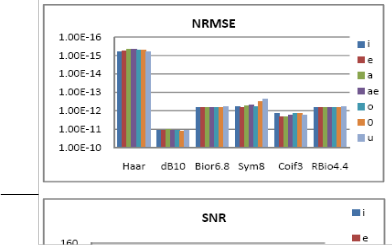
tions are reconstructed from the coarse low frequency coeffi- cients in the wavelet transform vector. This figure shows that the original speech data is still well represented by the level 5 approximation. The NRMSE between the original and the re- constructed waveform for all the seven Bangla vowels is given in Fig.6 which is very small in the order of 10-10.
Fig. 6 shows the result of the experiment performed on Bangla vowel synthesis for selecting optimalwavelet. As can be ob- served from Fig.6, that lowest NRMSE between the original and reconstructed signal and highest SNR, PSNR is obtained using Haar wavelet. But in case of Haar the RE is smallest among the other wavelets used. There fore it is not suitable for reconstruction. Among the other wavelets sym8 has lowest NRMSE and highest SNR, PSNR, RE which shows that it is suitable for reconstruction. Therefore sym8 has the best per- formance among the other selected wavelets.
We examined the performance of various families of wave- lets using the synthesized signal by several parameters. First, the NRMSE of the reconstructed vowel waveform is calculated for all the seven vowels of Bangla and is found to be in the order of 10-10. Secondly, the SNR and PSNR also shows great- est value for sym8. The RE of the first few approximation coefficient of WT is calculated. It is found that for all the seven vowels, almost 98% of the energy is confined in the first few approximation coefficients of the WT. It may be said that the reconstructed vowel waveform obtained by WT is almost simi- lar to the original waveform. Therefore, we may say that WT preserves the important speech information with few parame- ters. So, for synthesis, it is sufficient to store the first few pa- rameters of the wavelet coefficients.
Our future work will be to make a standard oral and nasal vowel space for Bangla from a large amount of data. Then to synthesize the data for oral-nasal vowel pairs to evaluate which of the two methods is synthetically better for Bangla. The work may be further extended to analysis of other speech units and store the speech parameters in a database for further work of synthesis, recognition or coding.
Figure 6: NRMSE, SNR, PSNR and Energy of the first N/2 coefficient and of each Bangla vowel using various wavelets
wavelet. The wavelet transform was computed to scale 5. Fig.6 shows the NRMSE, SNR, PSNR and signal energy retained in the first N/2 transform coefficients for all the seven Bangla vowels. This energy is equivalent to the energy stored in the level 1-approximation coefficients. It is seen from the calculated energy of the first N/2 coefficient that the first few approximation coefficient of the WT stores more than 98% of the vowel speech energy.
Fig.5 shows a sample speech signal /i/ and approximations of the signal, at five different scales for db10. These approxima
In this paper, a comparative study of different wavelet family on to test Bnagla vowel speech signal has been done using NRMSE, SNR, PSNR and RE. This study gives the choice of optimal wavelet for each Bangla vowel synthesis. The effects of Haar, Daubechies, Symlets, Coiflets, Biortho- gonal and R. Biorthogonal wavelet family on the seven Bangla phonemes have been examined. The values of the extracted parameters are also presented. We used, these parameters for synthesized signal quality measure. We analyzed results for a wide range of wavelets and found that wavelet sym8 provides the best reconstruction performance for the test Bangla vowel signals. Therefore, conclusively we can say that the best wave- let choice in the Bangla vowel reconstruction is dependent on to the type of phoneme signal and desired speech quality.
The difference between the original and the reconstructed vowels have very negligible error. As by using this technique
IJSER © 2011
International Journal of Scientific & Engineering Research Volume 2, Issue 11, November-2011 6
ISSN 2229-5518
the error of the synthesized waveform is very low and most of the energy is preserved by the first few coefficient of the WT, therefore WT with sym8 is appropriate for applying to Bangla phoneme analysis and synthesis. It may be observed from our study that sym8 wavelet at decomposition level 5 can repro- duce the signal with a very small NRMSE and high SNR, PSNR. As more than 98% of the energy is stored in the first few approximation coefficients. Therefore, few parameters are sufficient to preserve all the important characteristics for the reproduction of the signal.
Our future work will be to extract and store various Bangla
speech unit parameters which will be later used by speech
synthesis, coding or speech recognition system. We can also
examine the performance of different wavelets for phoneme
synthesis besides examining the synthesized result by listen-
ing.
.
[1] R. Polikar, “The Wavelet Tutorial’, 136, Rowan Hall, Department of Electrical and Computer Engineering, Rowan University, Glassboro, NJ 08028. June 1996.W.-K. Chen, Linear Networks and Systems. Bel- mont, Calif.: Wadsworth, pp. 123-135, 1993. (Book style)
[2] R.R. Coifman, and ML. Wickerhauser. „Entropy based algorithms for best-basis selection, ” IEEE Transactions on information Theory, vo1.32, pp.712-718, March 1992K. Elissa, “An Overview of Decision Theory," unpublished. (Unplublished manuscript)
[3] Kadambe, S; Srinivasan, P. “Applications of Adaptive Wavelets for
Speech,” Optical Engineering 33(7). pp.2204-2211,(July 1994).
[4] I. Agbinya, “Discrete Wavelet Transform Techniques in Speech Processing”, IEEE Tencon Digital Signal Processing Applications Pro- ceedings, IEEE, New York, NY, 1996, pp 514-519.
[5] S. Kadambe, and Boudreaux-Bartels, G.F., 1992, “Applications of the Wavelet Transform for Speech Detection”, IEEE Trans., on Information Theory, Vol.-38, no.2, pp 917-954.
[6] O. Farooq, S. Datta, “Phoneme recognition using wavelet based fea- tures”, Journal of Information Sciences—Informatics and Computer Science, Vol-150, Issue 1-2, March 2003
[7] M.Kobayashi, M. Sakamoto, T.Saito, “Wavelet Analysis in Text-to- Speech Synthesis”, IEEE Trans. On Circuits and Systems –II, Analog and Digital Signal Proc., Vol-45, No.8, Aug-98.
[8] Speech segmentation, Bartosz Zi´ołko¤, Suresh Manandhar¤, Richard C.
Wilson¤ and Mariusz Zi´ołko, “Wavelet Method of Speech Segmentation”,
14th European Signal Processing Conference (EUSIPCO 2006), Florence, Italy, September 4-8, 2006.
[9] A. Graps, “An Introduction to Wavelets,” IEEE Computational Sciences and Engineering, http://www.amara.com/IEEEwave/IEEEwavelet.html (current Mar. 15, 2001).
[10] M. Vetterli, „Wavelets and Filter Banks: Theory and Design,” Technical Report no. CU/CTR/TR 206/90/36, Center for Telecommunication Research, Dept. of Elect. Engg., Columbia University, New York, August, 1990.
[11] I. Daubechies,”Orthogonal Bases of Compactly Supported Wavelets”,
Communications on Pure and Applied Mathematics, Vol. XLI, pp 909-996,
1988.
[12] B. Lin, B. Nguyen and E.T. Olsen, “Orthogonal Wavelets and Signal Processing, Signal Processing Methods for Audio, Images and Telecommu- nications”, P.M.Clarkson and H.Stark, ed., Academic Press, London, 1995, pp. 1-70.
[13] S. Mallat, A Wavelet Tour of Signal Processing, Academic Press, San
Diego, Calif., 1998.
[14] Y. Nievergelt, Wavelets made easy, Birkhäuser, Boston, 1999.
[15] J. Ooi and V. Viswanathan, Applications of Wavelets to Speech Processing,Modern Methods of Speech Processing, R.P. Ramachandran and R. Mammone, ed., Kluwer Academic Publishers, Boston, 1995, pp. 449-
464.
IJSER © 2011