International Journal of Scientific & Engineering Research, Volume 4, Issue 9, September-2013 396
ISSN 2229-5518
Open-System Predictive Assessment of Lead Extraction Rate during
Biooxidation of Galena by Acidithiobacillus Ferrooxidans (ATF)
C. I. Nwoye*1, J. U. Odo1, S. O. Nwakpa1 and O. O. Onyemaobi2
1 Department of Metallurgical and Materials Engineering, Nnamdi Azikiwe University, Awka, Nigeria.
2Department of Materials and Metallurgical Engineering, Federal University of Technology, Owerri, Nigeria.
Corresponding author: chikeyn@yahoo.com ; 0806 8006 092
Abstract
Open-system predictive assessment of lead extraction rate during biooxidation of galena by
acidithiobacillus ferrooxidans (ATF) has been carried out based on the leaching time and
final pH of leaching solution using a derived model. The model;
γ = - 0.0176 ( ln t + ln α ) + 0.135
indicates an logarithmic relationship between lead extraction rate and combined input of time and pH. Results were predicted using regression model (standard model) and then plotted along side with results from the experiment and derived model to compare their respective spread and trend so as to establish the degree of validity of the derived model. The standard errors incurred in predicting lead extraction rate for each value of the leaching time and final leaching solution pH considered, as obtained from derived model and experiments are 5.15 x
10-4 and 4.66 x 10⁻⁴ % as well as 1.26 x 10⁻³ and 1.54 x 10⁻³ % respectively. The correlations between lead extraction rate and leaching time as obtained from derived model and
experimental results were evaluated to be same (0.9959), and between lead extraction rate and final pH of leaching solution 0.9596 and 0.9749 respectively. The concentration of lead
extracted within a leaching time interval 210-490 hrs as obtained from derived model and experiment are 3.136 and 3.108 g/dm3 respectively. Deviational analysis indicates that the maximum deviation of the model-predicted lead extraction rate from the corresponding experimental value is less than 10%. It was also found that the validity of the model is rooted
on the core expression 7.4074 γ = - 0.1304 ( ln t + ln α) + 1 where both sides of the expression are correspondingly approximately equal.
Keywords: Open-System, Prediction, Lead Extraction Rate, Biooxidation, Acidithiobacillus Ferrooxidans.
1. Introduction
About two decades ago, the application of bioleaching to the treatment of refractory gold
deposits has been of great interest to mining companies all over the world. The majority of the gold in these deposits is locked up in a sulphide matrix within the ore, and provides for very poor gold recoveries unless the sulphide minerals are removed first.
The pyrite and arsenopyrite minerals are basically the two most common sulphides associated with these refractory gold ore. In the past, the treatment method used involves first making a sulphide concentrate that contains the gold and then roasting this concentrate at a high temperature to drive off the sulphides as gases. This is then followed by recovery of the gold from the residue that is left behind.
Roasting of these sulphides has since become increasingly unacceptable due to the accompanying production of sulphurous gases which are very harmful to the environment.
IJSER © 2013 http://www.ijser.org
International Journal of Scientific & Engineering Research, Volume 4, Issue 9, September-2013 397
ISSN 2229-5518
On the other hand, bioleaching is environmental friendly and an alternative technique to roasting in that gaseous emission is not created.
Results of study [1] on the factors affecting bioleaching kinetics of sulphide ores using acidophilic microorganisms revealed that the major draw back in the process is the slow kinetics of dissolution of metal valuables from the sulphide ores. The research work also highlighted various factors which determine the overall kinetics as including: bacterial activity and concentration, iron and sulphur oxidation, oxygen consumption, reactor design and nature of ore.
Acidithiobacillus ferrooxidans is an aerobic microorganism that uses oxygen as a final electron acceptor during the oxidation process. However, in absence of oxygen, it is still able to grow in the presence of inorganic reduced sulphur compounds by using the ferric ion as an alternative electron acceptor [2]. In this condition however, its growth is slower [3].
Reduction in the bioleaching rate has been deduced [4] to result from presence of high concentrations of solids which initiates an increase in the friction between particles, and probably avoiding the adhesion between the particles and bacteria. This friction has been reported [5] to be capable of causing mechanical damage to the cell.
Successful attempts have been made [6] to model data generated from bioleaching process using regression analysis [6]. The work shows time (days), used as the only independent variable, and so data collected fits in as a third order polynomial regression model. The resulted general equation of the model shows (Minitab 13.0):
Arsenic = 23.888. – 1.0597 Days + 0.5161 Days2 – 0.0131 Days3 (1) Equation (1) resembles the general three phase bacterial growth model. The determination
coefficient evaluated from results generated by the model was 0.3237, which represents a value relatively low due to absence of other significant factors such as particle size, pulp density, air injection, 9K medium, CO2 , and ferric chloride added.
Orthogonality permits the comparison between low and high levels for each factor affecting bioleaching in their ability to dissolve the metal. In the research work [6], the low level was taking as 0 and the high level as 1. Furthermore, time (days) was also included as the only quantitative factor, hence expanding the model to:
Carbon
Arsenic = β0 + β1 Pulp Density + β2 Surface Area + β3 Ferric Chloride + β4
Dioxide + β5 Air + β6 9 K Medium + β7 Strains + β8 Days (2)
Where
β0 , β1 …… β8 = Regression coefficients
Based on the foregoing, on analyzing the experiment [6] as time series (time as independent variable) by multiple regression, it fits the third order polynomial model.
Arsenic = β0 + β1 t + β2 t2 + β3 t3
(3)
Where
IJSER © 2013 http://www.ijser.org
International Journal of Scientific & Engineering Research, Volume 4, Issue 9, September-2013 398
ISSN 2229-5518
t = Time in days of bioleaching
β0, β1 , β2 , β3 = Regression coefficient.
The aim of this work is to formulate a model for open-system predictive assessment of lead extraction rate based on the leaching time and final pH of leaching solution during biooxidation of galena by acidithiobacillus ferrooxidans.
2. Materials and methods
Weighed quantities of galena concentrate were placed in conical flasks containing prepared bioleaching solutions of different molarities and pH values. Details of the experimental procedure and associated process conditions are as stated in the past report [7].
3.1 Model formulation
Experimental data obtained from research work [7] were used for this work. Computational analysis of the experimental data [7] shown in Table 1, gave rise to Table 2 which indicate that;
K γ ≈ - N ln t – N ln α + 1 (4) Introducing the values of N and K into equation (4) reduces it to;
7.4074 γ = - 0.1304 ln t – 0.1304 ln α + 1 (5)
7.4074 γ = - 0.1304 ( ln t + ln α) +1 (6)


γ = - 0.1304 ( ln t + ln α) +1 (7)

7.4074
γ = - 0.0176 ( ln t + ln α ) + 0.135 (8)
Where
(γ) = Lead extraction rate (g/dm3 hr-1 )
(α) = Final pH of leaching solution
(t) = Leaching time (hrs)
K = 7.4074; Overall microbe- substrate interaction factor (determined using C- NIKBRAN [8])
N = 0.1304; Lead precipitation constant (determined using C-NIKBRAN [8])
Table 1: Variation of lead extraction rate with leaching time and final pH of leaching solution [7]
(t) | (α) | (γ) |
210 280 350 420 490 | 3.48 3.12 3.02 2.87 2.83 | 0.0195 0.0157 0.0137 0.0105 0.0084 |
IJSER © 2013 http://www.ijser.org
International Journal of Scientific & Engineering Research, Volume 4, Issue 9, September-2013 399
ISSN 2229-5518
4. Boundary and Initial Condition
Galena was placed in conical flasks 30 cm high containing bioleaching solution. The leaching solution is non flowing (stationary). Before the start of the leaching process, the flask was
assumed to be initially free of attached unwanted bacteria and other micro organism. The effect of oxygen on the process was assumed to be atmospheric since it is an open system
process. In all cases, weight of galena used was 60g. The range of the final pH of leaching solutions and leaching times: 2.83-3.48 and 210-490 hrs respectively were used. A constant leaching temperature of 25oC and average ore grain size of 150µm were also used. Details of the experimental technique and other process conditions are as presented in the report [7].
The leaching process boundary conditions include: atmospheric levels of oxygen (considering that the flasks was open at the top) at both the top and bottom of the ore particles in the gas and liquid phases respectively. A zero gradient was assumed for the liquid scalar at the bottom of the particles and for the gas phase at the top of the particles. The sides of the particles were assumed to be symmetries.
5. Results and Discussion
The derived model is equation (8). The computational analysis of Table 1 gave rise to Table 2
Table 2: Variation of 7.4074 γ with - 0.1304 (ln t + ln α) + 1
7.4074 γ | (ln t + ln α) | -0.1304 (ln t + ln α) | - 0.1304 (ln t + ln α) +1 |
0.1444 0.1163 0.1015 0.0778 0.0622 | 6.5941 6.7726 6.9632 7.0946 7.2347 | -0.8599 -0.8831 -0.9080 -0.9251 -0.9434 | 0.1401 0.1169 0.0920 0.0749 0.0566 |
5.1 Model validation
The validity of the model is strongly rooted on equation (6) where both sides of the equation are correspondingly approximately equal. Table 2 also agrees with equation (6) following the values of 7.4074 γ and - 0.1304 ( ln t + ln α) + 1 evaluated from the experimental results in Table 1. Furthermore, the derived model was validated by comparing the concentration of extracted lead predicted by the model and that obtained from the experiment [7]. This was done using various analytical techniques.
Computational Analysis
Computational analysis of the experimental and model-predicted concentration of extracted lead was carried out to ascertain the degree of validity of the derived model. This was done
by comparing the concentration of extracted lead obtained by calculations involving experimental results with the model-predicted results.
Concentration of extracted lead CL (g /dm3) was calculated from the equation;
CL = Δγ x Δt (9)
IJSER © 2013 http://www.ijser.org
International Journal of Scientific & Engineering Research, Volume 4, Issue 9, September-2013 400
ISSN 2229-5518
Equation (9) is detailed as
Where
CL = γ2 - γ1 x t2 - t1 (10)
Δγ = Change in the lead extraction rates γ2, γ 1 within a range of leaching time: t1 - t 2.
Δt = Change in the leaching times t2, t1 .
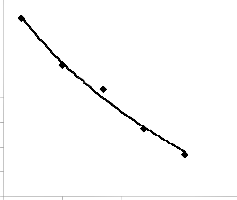
Therefore, a plot of lead extraction rate against leaching time as in Fig. 1 using experimental results in
Table 1, and substitution of points (210, 0.0195) and (490, 0.0084) for (t1, γ1) and (t2, γ2) respectively into the mathematical expression in equation (10) gives - 3.108 g/dm3 as the concentration of extracted lead during the actual experimental bioleaching process.
0.021
0.019
0.017
0.015
0.013
0.011
R2 = 0.9919
0.009
0.007
0.005
180 280 380 480 580
Time (hrs)
Fig. 1: Coefficient of determination between extraction rate and leaching time as obtained from the experiment [7].
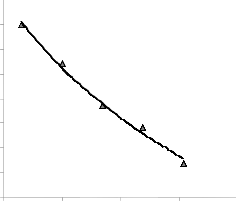
Similarly, a plot of lead extraction rate against leaching time as in Fig. 2 using model-predicted results, and substitution of points (210, 0.0189) and (490, 0.0077) for (t1, γ1) and (t2, γ2) respectively into the mathematical expression in equation (10) gives - 3.136 g/dm3 as the model-predicted concentration of extracted lead. These concentrations of extracted lead evaluated from experiment and derived
model indicate proximate agreement and hence validity of the model. The negative signs preceding the magnitudes of the extraction rate do not indicate that the extraction rate is negative, but that it decreases with increase in leaching time.
0.021
0.019
0.017
0.015
0.013
0.011
0.009
R2 = 0.9918
0.007
0.005
180 280 380 480 580
Time (hrs)
IJSER © 2013 http://www.ijser.org
International Journal of Scientific & Engineering Research, Volume 4, Issue 9, September-2013 401
ISSN 2229-5518
Fig. 2: Coefficient of determination between extraction rate and leaching time as predicted by model
0.023
0.021
0.019
0.017
0.015
0.013
0.011
0.009
0.007
0.005
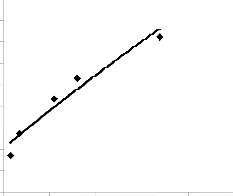
R2 = 0.9505
2.8 3 3.2 3.4 3.6 3.8
pH
Fig. 3: Coefficient of determination between extraction rate and pH as obtained from the experiment [7].
0.021
0.019
0.017
0.015
0.013
0.011
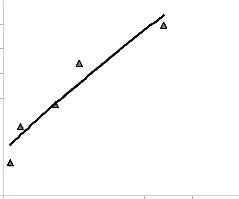
R2 = 0.9209
0.009
0.007
0.005
2.8 3 3.2 3.4 3.6 3.8
pH
Fig. 4: Coefficient of determination between lead extracted rate and final pH of leaching solution as predicted by model
Statistical Analysis
The standard errors (STEYX) incurred in predicting lead extraction rate for each value of the
leaching time and final leaching solution pH considered, as obtained from derived model and experiments are 5.15 x 10⁻⁴ and 4.66 x 10⁻⁴ % as well as 1.26 x 10⁻³ and 1.54 x 10⁻³ % respectively. The standard error was evaluated using [7].
The correlations between lead extraction rate and leaching time as well as lead extraction rate and final pH of leaching solution as obtained from derived model and experimental results [7] were calculated. This was done by considering the coefficients of determination R2 from Figs. 1-4, using the equation;
R = √R2 (11)
IJSER © 2013 http://www.ijser.org
International Journal of Scientific & Engineering Research, Volume 4, Issue 9, September-2013 402
ISSN 2229-5518
The evaluated correlations are shown in Tables 3 and 4 for experimental and model-predicted results which are in proximate agreement.
Table 3: Comparison of the correlations between extraction rate and leaching time as evaluated from experimental and derived model
Analysis | Based on leaching time |
Analysis | ExD | D-MoD |
CORREL | 0.9959 | 0.9959 |
Table 4: Comparison of the correlations between extraction rate and final pH of leaching solution as evaluated from experimental and derived model
Analysis | Based on final pH of leaching solution |
Analysis | ExD | D-MoD |
CORREL | 0.9596 | 0.9749 |
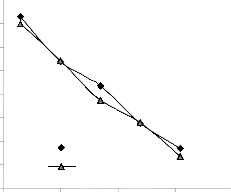
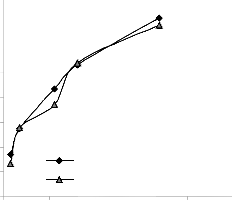
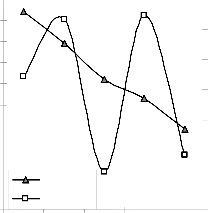
Graphical Analysis
Comparative graphical analysis of Figs. 5 and 6 shows very close alignment of the curves from model-predicted lead extraction rate (MoD) and that of the experiment (ExD). The degree of alignment of these curves is indicative of the proximate agreement between both experimental and model-predicted lead extraction rate.
0.021
0.019
0.017
0.015
0.013
0.011
0.009 ExD
0.007
M oD
0.005
180 280 380 480 580
Time (hrs)
Fig. 5: Comparison of lead extraction rate (relative to leaching time) as obtained from experiment [7] and derived model.
IJSER © 2013 http://www.ijser.org
International Journal of Scientific & Engineering Research, Volume 4, Issue 9, September-2013 403
ISSN 2229-5518
0.021
0.019
0.017
0.015
0.013
0.011
0.009
0.007
0.005
ExD M oD
2.8 3 3.2 3.4 3.6 3.8
pH
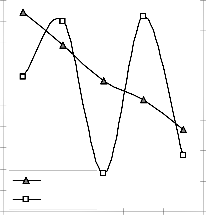
Fig. 6: Comparison of lead extraction rate (relative to final pH of leaching solution) as obtained from experiment [7] and derived model.
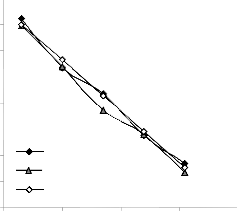
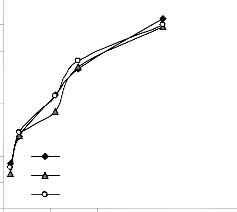
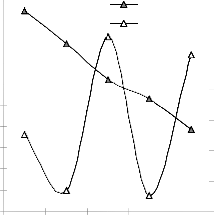
Regression model culled from Microsoft Excel [9] was used to predict the extraction rate within the same boundary conditions on which the derived model was based. Results predicted by the regression model was plotted; extraction rate against leaching time and final pH of leaching solution respectively along with results from the experiment and derived model for the purpose of comparatively analyzing its spread and trend relative to results from experiment and derived model. This is also a way of checking the validity of the derived model with reference to a standard model prediction.
0.021
0.019
0.017
0.015
0.013
0.011
0.009
0.007
0.005
ExD M oD
R-M oD
180 280 380 480 580
Leaching time (hr)
Fig. 7: Comparison of lead extraction rate (relative to leaching time) as obtained from experiment
[7] derived and regression model.
IJSER © 2013 http://www.ijser.org
International Journal of Scientific & Engineering Research, Volume 4, Issue 9, September-2013 404
ISSN 2229-5518
0.021
0.019
0.017
0.015
0.013
0.011
0.009
0.007
0.005
ExD M oD
R-M oD
2.8 3 3.2 3.4 3.6 3.8
pH
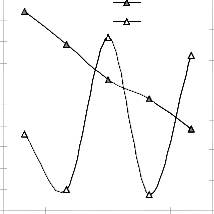
Fig. 8: Comparison of lead extraction rate (relative to final pH of leaching solution) as obtained from experiment [7] derived and regression model.
Graphical analysis of Figs. 7 and 8 shows very close alignment of the curves from derived model (D-MoD) and regression model (R-MoD) predicted results as well as experimental (ExD) results of lead extraction rate. It is strongly believed that the degree of alignment of these curves is indicative of the proximate agreement between ExD, D-MoD and R-MoD predicted results.
Deviational Analysis
Comparative analysis of lead extraction rate from experiment [7] and derived model revealed deviations on the part of the model-predicted values relative to values obtained from the
experiment. This is attributed to the fact that the surface properties of the sulphide ore and the physiochemical interactions between the ore and the leaching solution (containing the
microbes) which played vital roles during the process [7] were not considered during the model formulation. This necessitated the introduction of correction factor, to bring the model-
predicted lead extraction rate to those of the corresponding experimental values.


Deviation (Dn) of model-predicted lead extraction rate from that of the experiment [7] is given by
Dn = PL – EL x 100 (12) EL
Correction factor (Cr ) is the negative of the deviation i.e
Cr = -Dn (13)


Therefore
Cr = - PL – EL x 100 (14) EL
IJSER © 2013 http://www.ijser.org
International Journal of Scientific & Engineering Research, Volume 4, Issue 9, September-2013 405
ISSN 2229-5518
Where
PL = Model-predicted lead extraction rate (g /dm3 hr-1) EL = Lead extraction rate from experiment (g /dm3 hr-1)
Cr = Correction factor (%)
Dn = Deviation (%)
Introduction of the corresponding values of Cr from equation (14) into the model gives exactly the corresponding experimental extraction rate.
Figs. 9 and 10 show that the maximum deviation of the mode-predicted lead extraction rate from the corresponding experimental values is less than 10% and quite within the acceptable deviation limit of experimental results.
0.02
0.018
0.016
0.014
0.012
0.01
0.008
0.006
0.004
0.002
0
Lch.rate
De viation
210 280 350 420 490
2
0
-2
-4
-6
-8
-10
-12
Time (hrs)
Fig. 9: Variation of model-predicted extraction rate (relative to leaching time) with its associated deviation from experimental values
0.02
0.018
0.016
0.014
0.012
0.01
0.008
0.006
0.004
0.002
0
Lch.rate
De viation
3.48 3.12 3.02 2.87 2.83
2
0
-2
-4
-6
-8
-10
-12
pH
Fig. 10: Variation of model-predicted extraction rate (relative to final pH of leaching solution) with its associated deviation from experimental values
These figures show that least and highest magnitudes of deviation of the model-predicted lead extraction rate (from the corresponding experimental values) are 0.64 and -9.49% which
IJSER © 2013 http://www.ijser.org
International Journal of Scientific & Engineering Research, Volume 4, Issue 9, September-2013 406
ISSN 2229-5518
corresponds to lead extraction rates: 0.0158 and 0.0124 g/dm3 hr-1 and leaching times: 280 and 350 hrs respectively.
0.02
0.018
0.016
0.014
0.012
0.01
0.008
0.006
0.004
0.002
0
Lch.rate 12
Corr.factor 10
8
6
4
2
0
-2
210 280 350 420 490
Time (hrs)
Fig. 11: Variation of model-predicted extraction rate (relative to leaching time) with its associated correction factor
0.02
0.018
0.016
0.014
0.012
0.01
0.008
0.006
0.004
0.002
0
Lch.rate 12
Corr.factor
10
8
6
4
2
0
-2
3.48 3.12 3.02 2.87 2.83
pH
Fig. 12: Variation of model-predicted extraction rate (relative to final pH of leaching solution) with its associated correction factor
Comparative analysis of Figs. 9-12 indicates that the orientation of the curve in Figs. 11 and
12 is opposite that of the deviation of model-predicted lead extraction rate (Figs. 7 and 8). This is because correction factor is the negative of the deviation as shown in equations (13) and (14). It is believed that the correction factor takes care of the effects of the surface properties of the ore and the physiochemical interaction between the ore and the leaching solution (containing the microbes) which (affected experimental results) were not considered during the model formulation. Figs. 11 and 12 indicate that the least and highest magnitudes of correction factor to the model-predicted lead extraction rate are - 0.64 and + 9.49%,
corresponding to lead extraction rates: 0.0158 and 0.0124 g/dm3 hr-1 and leaching times: 280
and 350 hrs respectively.
IJSER © 2013 http://www.ijser.org
International Journal of Scientific & Engineering Research, Volume 4, Issue 9, September-2013 407
ISSN 2229-5518
It is important to state that the deviation of model predicted results from that of the experiment is just the magnitude of the value. The associated sign preceding the value signifies if the deviation is deficit (negative sign) or surplus (positive sign).
6. Conclusion
Open-system predictive assessment of lead extraction rate during biooxidation of galena by acidithiobacillus ferrooxidans (ATF) has been carried out based on the leaching time and final pH of leaching solution using a derived model. The model indicates an logarithmic relationship between lead extraction rate and combined input of time and pH. The standard errors incurred in predicting lead extraction rate for each value of the leaching time and final leaching solution pH considered, as obtained from derived model and experiments are 5.15 x
10-4 and 4.66 x 10⁻⁴ % as well as 1.26 x 10⁻³ and 1.54 x 10⁻³ % respectively.The concentration of lead extracted within a leaching time interval 210-490 hrs as obtained from derived model
and experiment are 3.136 and 3.108 g/dm3. Deviational analysis indicates that the maximum deviation of the model-predicted lead extraction rate from the corresponding experimental
value is less than 10%. The validity of the model is rooted on the core expression 7.4074 γ =
- 0.1304 ( ln t + ln α) +1 where both sides of the expression are correspondingly
approximately equal.
References
[1]Trupti, D., Subbanna, A., and Chaudhury, G. R. (1999). Factors Affecting Bioleaching
Kinetics of Sulphide Ores Using Acidophilic Micro-organisms. Biometals, 12(1):1-10. [2]Sugio, T., Domatsu, C., Munakata, O., Tano, T., and Imai, K. (1999). Role of Ferric
Reducing System in Sulphur Oxidation of Acidithiobacillus Ferrooxidans. Applied and
Environmental Microbiology, 49:1401-1406.
[3]Shively, J. M., Van, K. G., and Meijer, W. G. (1998).Something from Almost Nothing: Carbon Dioxide Fixation in Chermoautotrophs. Annual Reviews of Microbiology. 52:191-
230.
[4]Chong, N., Karamanev, D. G.,Margaritis, A. (2002). Effect of Particle-Particle Shearing
on the Bioleaching of Sulphide Minerals. Biotechnology and Bioengineering. 80(3):349-
357.
[5]Deveci, H. (2002). Effect of Solids on Viability of Acidophilic Bacteria. Mineral
Engineering, 15(12): 1181-1189.
[6]Mario, M., Margarita, E., Benito, P., Alejandro, L., and Erasmo, O. (2004). Reduction of
Arsenic Content in a Complex Galena Concentrate by Acidithiobacillus Ferrooxidans, BMC, Biotechnology, doi: 10.1186/1472-6750-4-22.
[7]Nwoye, C. I. (2008). Bioleaching Studies of Ishiagu Galena. Ph.D Thesis, Federal
University of Technology, Owerri, Nigeria.
[8]Nwoye, C. I. (2008) Data Analytical Memory; C-NIKBRAN [9]Micrsoft Excel 2003 Version.
IJSER © 2013 http://www.ijser.org
408
I£ER 2013 http://WWW.ISer.org